DISCLAIMER: Please note these pages present experimental analyses developed by researchers at CICS-NC and/or of interest to the CICS-NC community and their collaborators. These analyses are subject to change as our understanding of the Earth's climate system improves and/or our interests change. There is no guarantee on their future availability.
NCSU > CICS-NC > Monitoring > MJO
Monitoring the MJO and Tropical Waves
Updated: 19 Dec, 2011
Archive | CFS Forecasts | DYNAMO | RMM
Data
Outgoing Longwave Radiation (OLR)
o OLR is frequently used as a proxy for tropical convection.
o These data are observed with the AVHRR sensor on the NOAA polar-orbiting satellites.
o Uninterpolated gridded data are obtained from NOAA/OAR/ESRL/PSD.
Upper Tropospheric Water Vapor (UTWV)
o These brightness temperatures are observed with the HIRS sensor on the NOAA and MetOp polar-orbiting satellites.
o Orbital swath data are obtained from NOAA/CLASS.
o Inter-satellite calibration is performed following Shi & Bates (2011, JGR), which was developed as part of the Climate Data Record program.
o The calibrated data are binned into daily 2.5° latitude–longitude grids.
Method
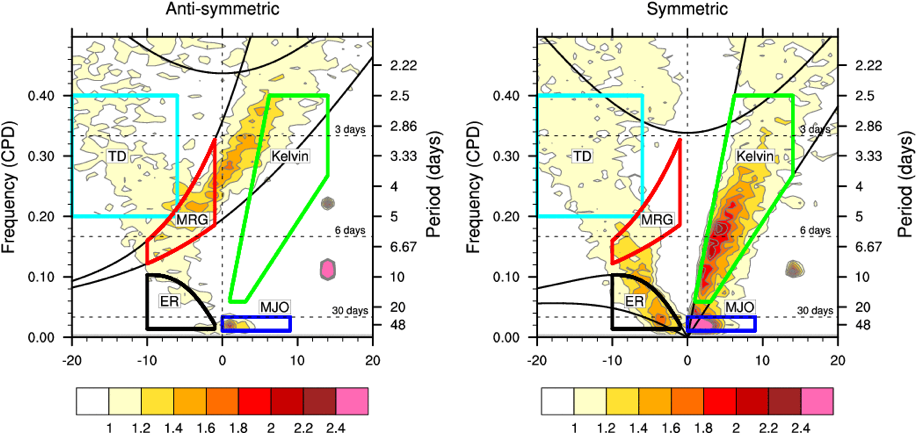
The figure above shows the wavenumber–frequency spectrum for OLR, divided by an estimate of the red background following Wheeler & Kiladis (1999, JAS). The panel on the left shows signals that are anti-symmetric about the equator, while the panel on the right shows those that are symmetric. Spectral peaks tend to lie along the dispersion curves for shallow water equatorial waves (black lines).
To identify tropical waves in near real-time, the OLR and UTWV data are filtered following Wheeler & Weickmann (2001 MWR). The daily anomalies are calculated using the first 3 harmonics of the seasonal cycle for 1979–2009. Missing values are then filled using linear interpolation in space and time. The most recent 365 days of anomalies are padded with 659 days of zeroes, and the result is filtered for each wave type.
No equatorial symmetry is imposed here, and the filters differ somewhat from the original ones defined by Wheeler & Kiladis (1999):
Wave Type |
Color |
Propagation Direction |
Wavenumber |
Period (days) |
Equivalent Depth (m) |
Source |
|
Madden–Julian Oscillation (MJO) |
Blue |
Eastward |
0–9 |
30–96 |
n/a |
|
|
Kelvin Waves |
Green |
Eastward |
1–14 |
2.5–17 |
8–90 |
|
|
Equatorial Rossby (ER) Waves |
Black |
Westward |
1–10 |
9–72 |
0–90 |
|
|
Mixed Rossby–Gravity (MRG) Waves |
Red |
Westward |
1–10 |
3–10 |
8–90 |
|
|
Tropical Depression (TD)-type disturbances |
Cyan |
Westward |
6–20 |
2.5–5 |
n/a |
Global Maps of Totals & Anomalies
|
|
OLR |
HIRS UTWV |
||
1 day |
||||
3 days |
||||
7 days |
||||
30 days |
||||
60 days |
||||
180 days |
||||
365 days |
|
|
||
Hovmöllers
|
|
OLR |
HIRS UTWV |
||||
Northern Narrow2.5°N – 7.5°N |
||||||
Northern Medium2.5°N – 17.5°N |
||||||
Northern Wide2.5°N – 27.5°N |
||||||
Equatorial Narrow2.5°S – 2.5°N |
||||||
Equatorial Medium7.5°S – 7.5°N |
||||||
Equatorial Wide15°S – 15°N |
||||||
Southern Narrow7.5°S – 2.5°S |
||||||
Southern Medium17.5°S – 2.5°S |
||||||
Southern Wide27.5°S – 2.5°S |
||||||
Paneled Global Maps of Recent and Forecast Data
|
|
OLR |
HIRS UTWV |
Total |
||
Anomaly |
||
MJO |
||
Kelvin Waves |
||
Symmetric Kelvin Waves |
||
ER Waves |
||
Symmetric ER Waves |
||
MRG Waves |
||
Anti-Symmetric MRG Waves |
||
TD-type Disturbances |
||
Sum of Waves |
Related Links
o NOAA/CPC Global Tropical Hazards Assessment
o NOAA/CPC Global Hazards Briefing
o CAWCR's Current Climate Charts (by Matt Wheeler)
o Navy/NRL Tropical Cyclone Page
o Paul Roundy's Tropical Waves
o Carl Schreck's Tropical Rainfall and Winds
Created and maintained by Carl Schreck.