Monitoring the MJO and Tropical Waves
Updated: 11 Dec, 2014
Archive | CFS Forecasts | DYNAMO | RMM | Extratropics
Global Maps of Totals & Anomalies
| OLR | HIRS UTWV | |||
|---|---|---|---|---|
| 1 day | Last | Previous | Last | Previous |
| 3 days | Last | Previous | Last | Previous |
| 7 days | Last | Previous | Last | Previous |
| 30 days | Last | Previous | Last | Previous |
| 60 days | Last | Previous | Last | Previous |
| 180 days | Last | Previous | Last | Previous |
| 365 days | Last | Last | ||
Hovmöllers
| OLR | HIRS UTWV | |||||
|---|---|---|---|---|---|---|
| Northern Narrow 2.5°N – 7.5°N | Total | Anomaly | Waves | Total | Anomaly | Waves |
| Northern Medium 2.5°N – 17.5°N | Total | Anomaly | Waves | Total | Anomaly | Waves |
| Northern Wide 2.5°N – 27.5°N | Total | Anomaly | Waves | Total | Anomaly | Waves |
| Equatorial Narrow 2.5°S – 2.5°N | Total | Anomaly | Waves | Total | Anomaly | Waves |
| Equatorial Medium 7.5°S – 7.5°N | Total | Anomaly | Waves | Total | Anomaly | Waves |
| Equatorial Wide 15°S – 15°N | Total | Anomaly | Waves | Total | Anomaly | Waves |
| Southern Narrow 7.5°S – 2.5°S | Total | Anomaly | Waves | Total | Anomaly | Waves |
| Southern Medium 17.5°S – 2.5°S | Total | Anomaly | Waves | Total | Anomaly | Waves |
| Southern Wide 27.5°S – 2.5°S | Total | Anomaly | Waves | Total | Anomaly | Waves |
Paneled Global Maps of Recent and Forecast Data
| OLR | HIRS UTWV | |
|---|---|---|
| Total | 1d • 3d • 5d - 7d • 15d | 1d • 3d • 5d • 7d • 15d |
| Anomaly | 1d • 3d • 5d • 7d • 15d | 1d • 3d • 5d • 7d • 15d |
| MJO | 5d • 7d | 5d • 7d |
| Kelvin Waves | 1d • 2d | 1d • 2d |
| Symmetric Kelvin Waves | 1d • 2d | 1d • 2d |
| ER Waves | 3d • 5d | 3d • 5d |
| Symmetric ER Waves | 3d • 5d | 3d • 5d |
| MRG Waves | 1d | 1d |
| Anti-Symmetric MRG Waves | 1d | 1d |
| TD-type Disturbances | 1d | 1d |
| Sum of Waves | 3d • 5d • 7d | 3d • 5d • 7d |
Outgoing Longwave Radiation (OLR)
-
OLR is frequently used as a proxy for tropical convection.
-
These data are observed with the AVHRR sensor on the NOAA polar-orbiting satellites.
-
Uninterpolated gridded data are obtained from NOAA/OAR/ESRL/PSD.
Upper Tropospheric Water Vapor (UTWV)
-
These brightness temperatures are observed with the HIRS sensor on the NOAA and MetOp polar-orbiting satellites.
-
Orbital swath data are obtained from NOAA/CLASS.
-
Inter-satellite calibration is performed following Shi & Bates (2011, JGR), which was developed as part of the Climate Data Record program.
-
The calibrated data are binned into daily 2.5° latitude—longitude grids.
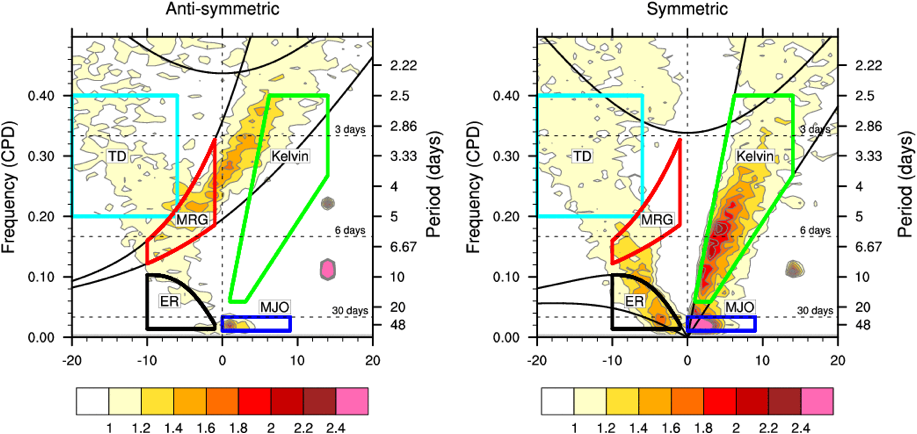
The figure above shows the wavenumber—frequency spectrum for OLR, divided by an estimate of the red background following Wheeler & Kiladis (1999, JAS). The panel on the left shows signals that are anti-symmetric about the equator, while the panel on the right shows those that are symmetric. Spectral peaks tend to lie along the dispersion curves for shallow water equatorial waves (black lines).
To identify tropical waves in near real-time, the OLR and UTWV data are filtered following Wheeler & Weickmann (2001 MWR). The daily anomalies are calculated using the first 3 harmonics of the seasonal cycle for 1979–2009. Missing values are then filled using linear interpolation in space and time. The most recent 365 days of anomalies are padded with 659 days of zeroes, and the result is filtered for each wave type.
No equatorial symmetry is imposed here, and the filters differ somewhat from the original ones defined by Wheeler & Kiladis (1999):
| Wave Type | Color | Propagation Direction | Wavenumber | Period (days) | Equivalent Depth (m) | Source |
|---|---|---|---|---|---|---|
| Julian Oscillation (MJO) | Blue | Eastward | 0–9 | 30–96 | n/a | Kiladis et al. (2005 JAS) |
| Kelvin Waves | Green | Eastward | 1–14 | 2.5–17 | 8–90 | Straub & Kiladis (2002, JAS) |
| Equatorial Rossby (ER) Waves | Black | Westward | 1–10 | 9–72 | 0–90 | Kiladis et al. (2009, Rev. Geophys.) |
| Mixed Rossby-Gravity (MRG) Waves | Red | Westward | 1–10 | 3–10 | 8–90 | Wheeler & Kiladis (1999) |
| Tropical Depression (TD)-type disturbances | Cyan | Westward | 6–20 | 2.5–5 | n/a | Roundy & Frank (2004, JAS) |