Updated State Climate Summaries Assist Resilience Planning
Third edition provides curated climate observations, future projections, and new online tool
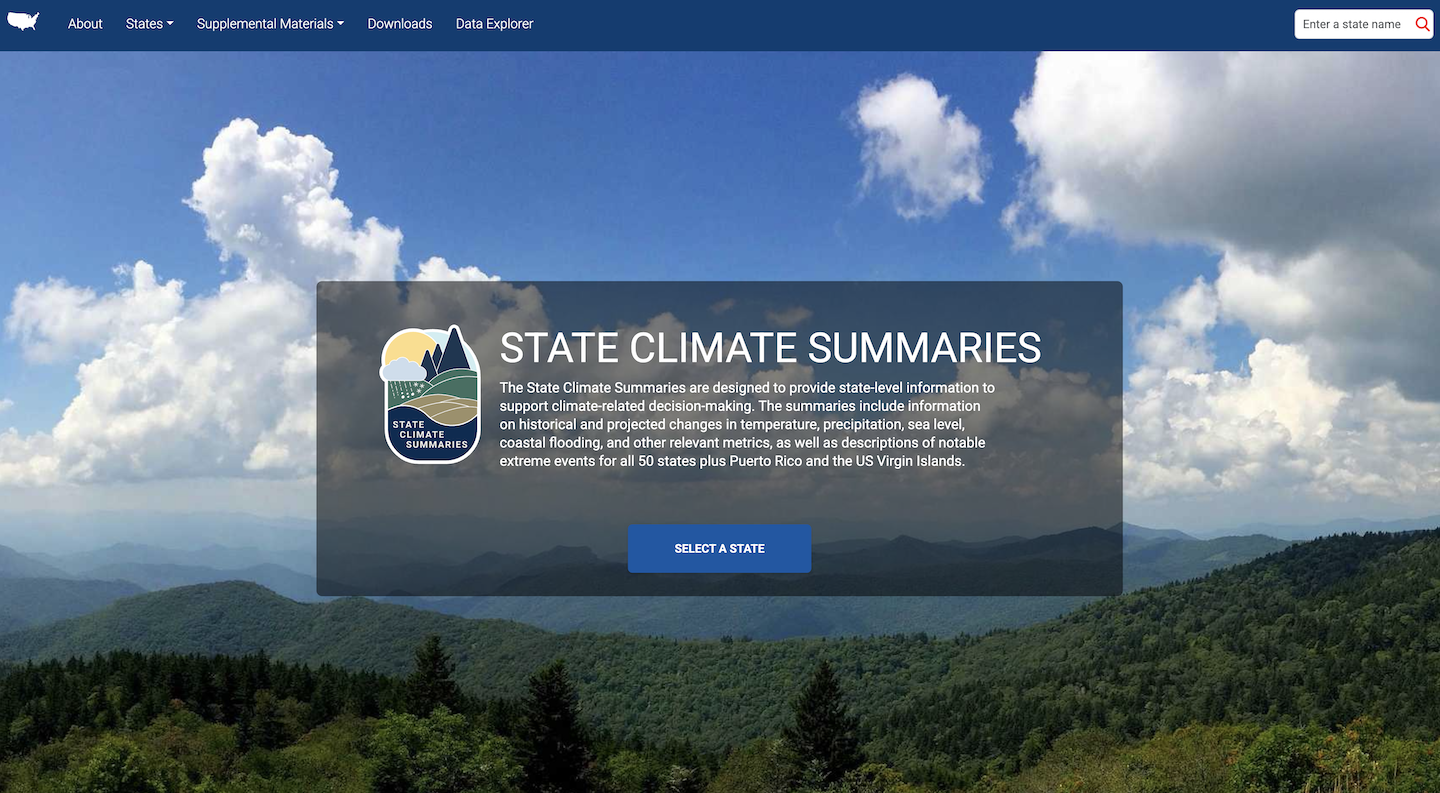
The latest version of the State Climate Summaries has launched, offering a powerful resource to help Americans understand and adapt to a changing climate. The summaries offer targeted climate data designed to assist decision-makers in government and the private sector. The information includes observations about changes in climate that have already taken place, as well as projections of future trends. And for the first time, the summaries feature an online Data Explorer, which allows users to generate precisely the information they need. The summaries were produced by the North Carolina Institute for Climate Studies (NCICS), part of NC State University. There are 51 new summaries in all, one for each state as well as one covering Puerto Rico and the US Virgin Islands. This is the third edition of the State Climate Summaries, following earlier versions released in 2017 and 2022. “The State Climate Summaries empower the public to make informed decisions,” said NCICS Research Scholar Laura Stevens, who led the project. “By understanding climate risk, communities can build resilience and prepare for the future.”Tighter Focus
The significance of the summaries comes down to scale. The most well-known climate assessments—the IPCC Assessment Reports and the US National Climate Assessment—assist planning at the international and national levels, respectively. The State Climate Summaries narrow the focus, offering information detailed enough to address state or regional issues—crucial for elected officials in statehouses and city governments, as well as for leaders of businesses and nonprofits. The summaries cover long-term trends in temperature and precipitation, as well as projections of how average temperatures and precipitation patterns may shift in the future.
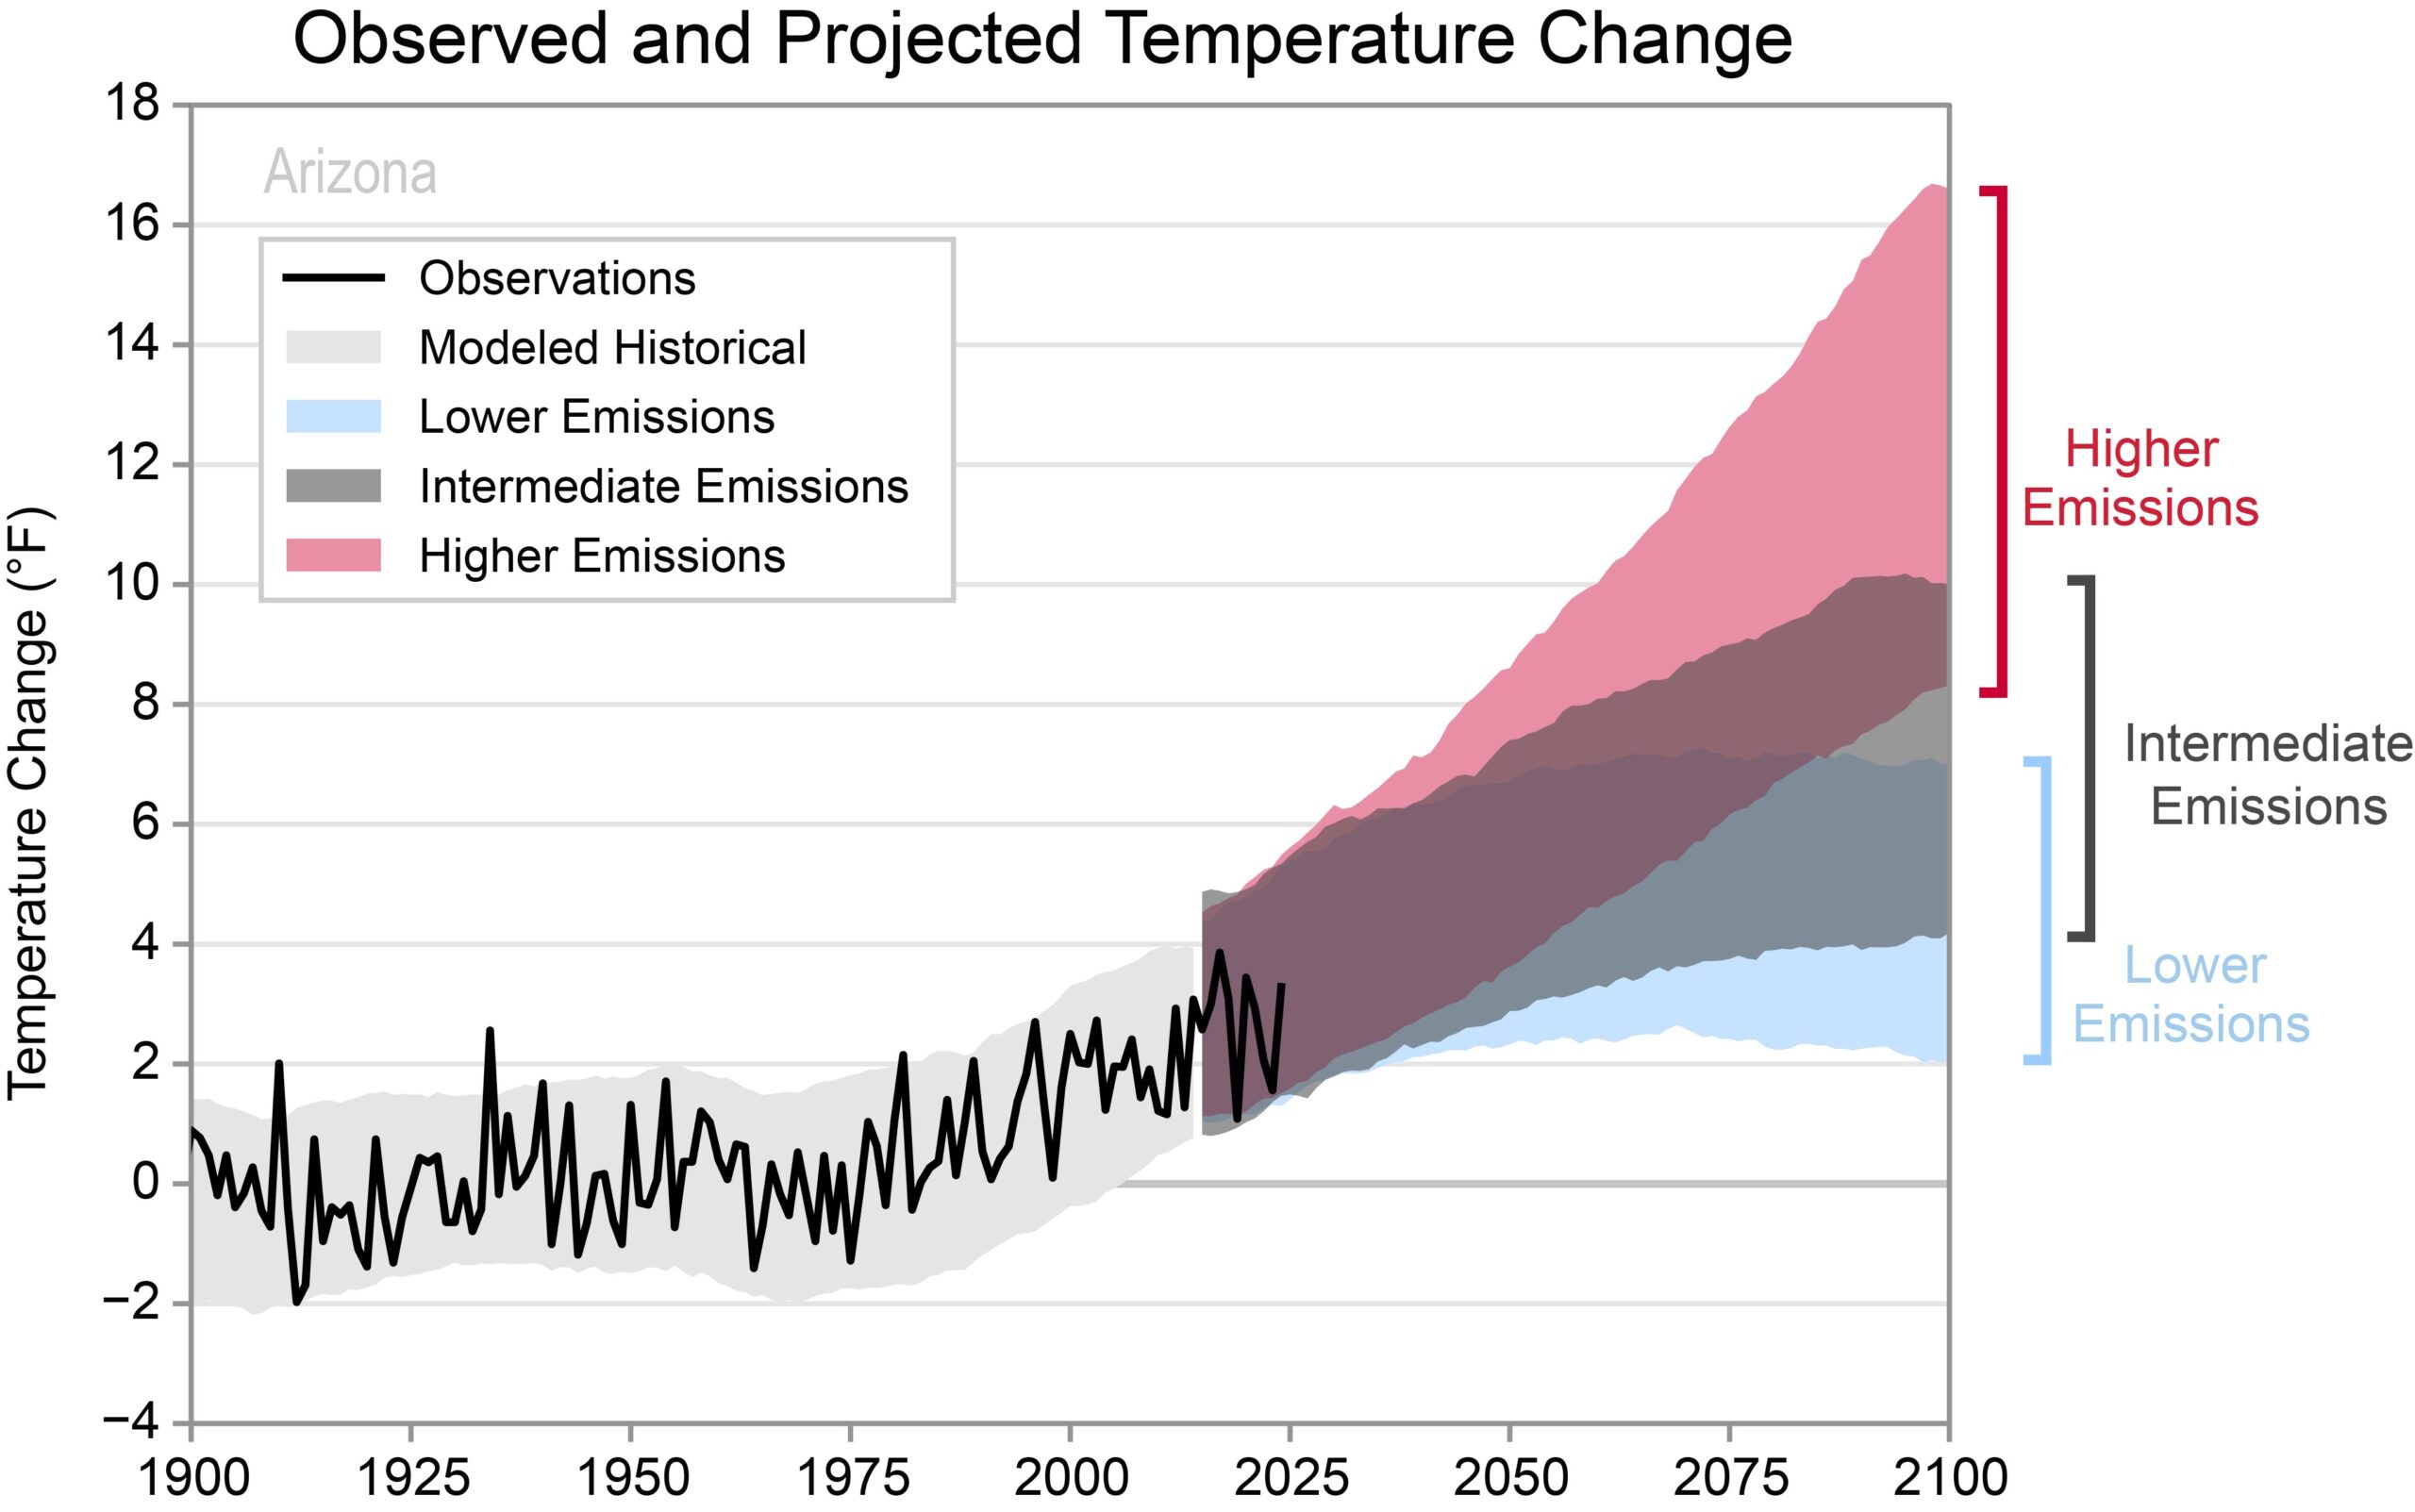
Each summary includes a figure showing observed and projected temperature changes, such as this one for Arizona.
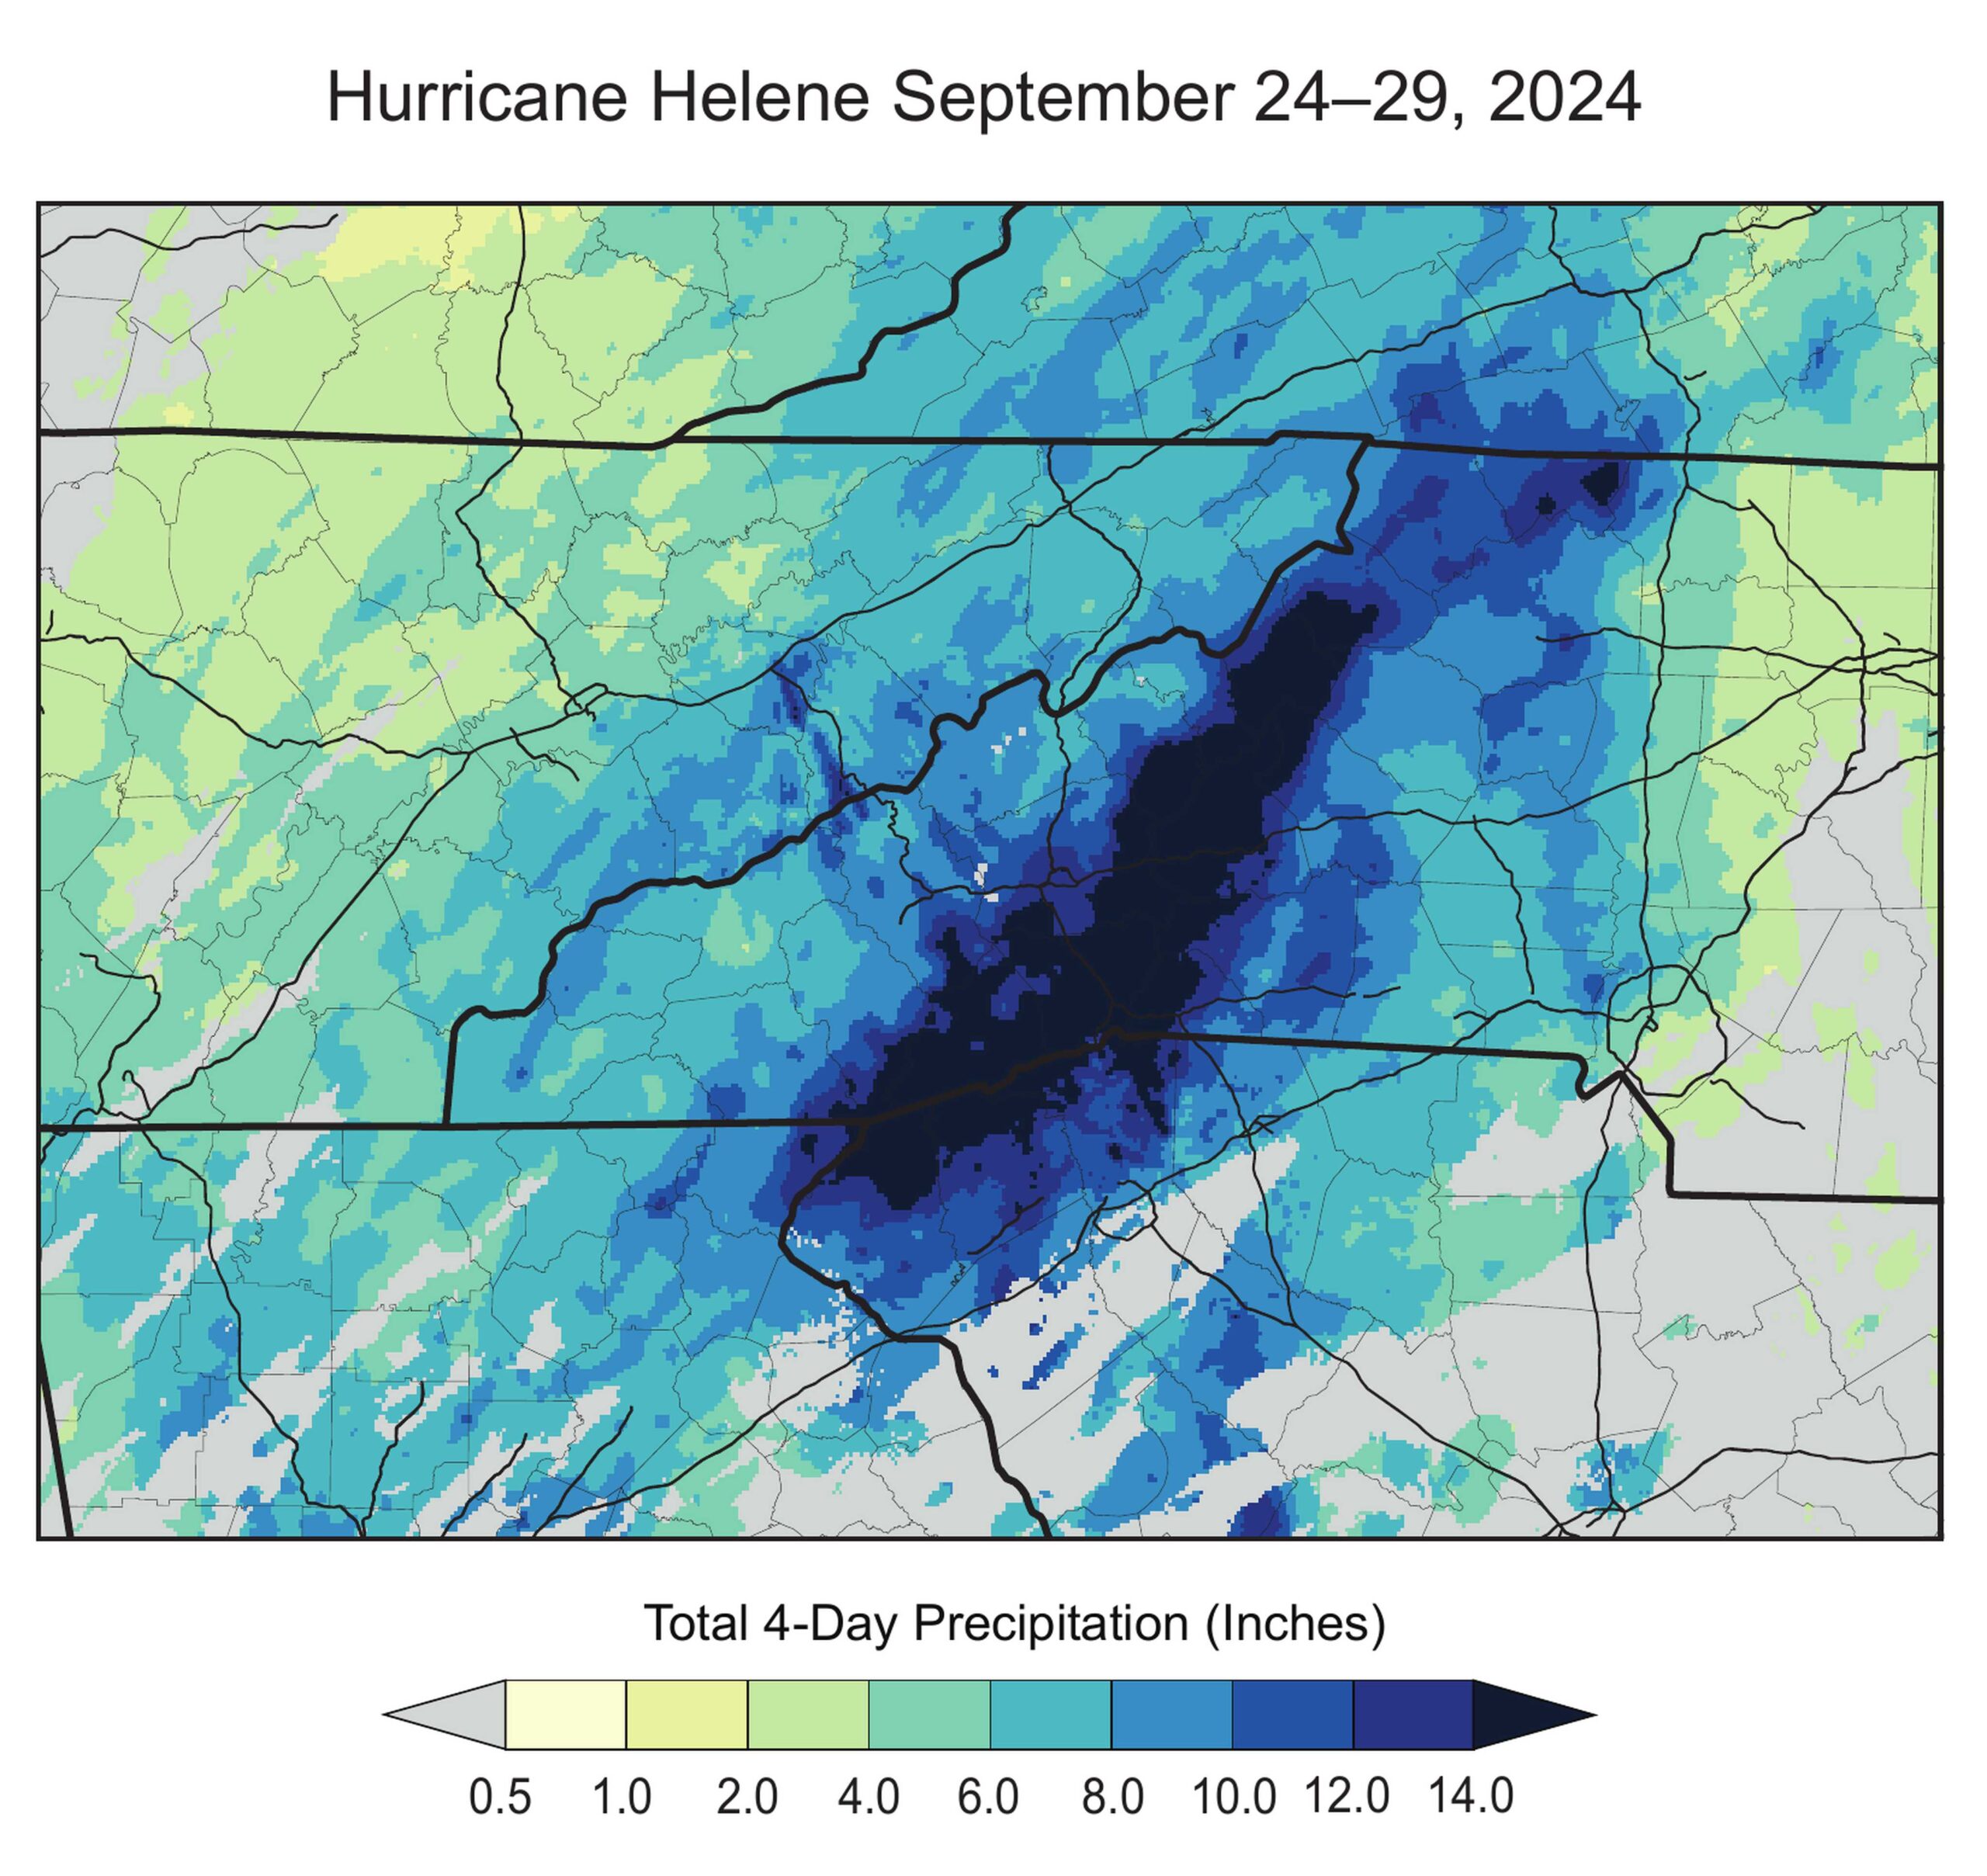
The summaries include state-specific information, such as this map of Hurricane Helene precipitation from the North Carolina summary.
New Online Tool
The Data Explorer, developed by NCICS in collaboration with the National Environmental Mapping and Applications Center (NEMAC) at UNC Asheville, provides even more granular information. Because the State Climate Summaries are concise, they include only a limited set of figures showing the metrics most relevant to each state. The online tool features a more expansive range of options, allowing users to generate figures with the precise information they need.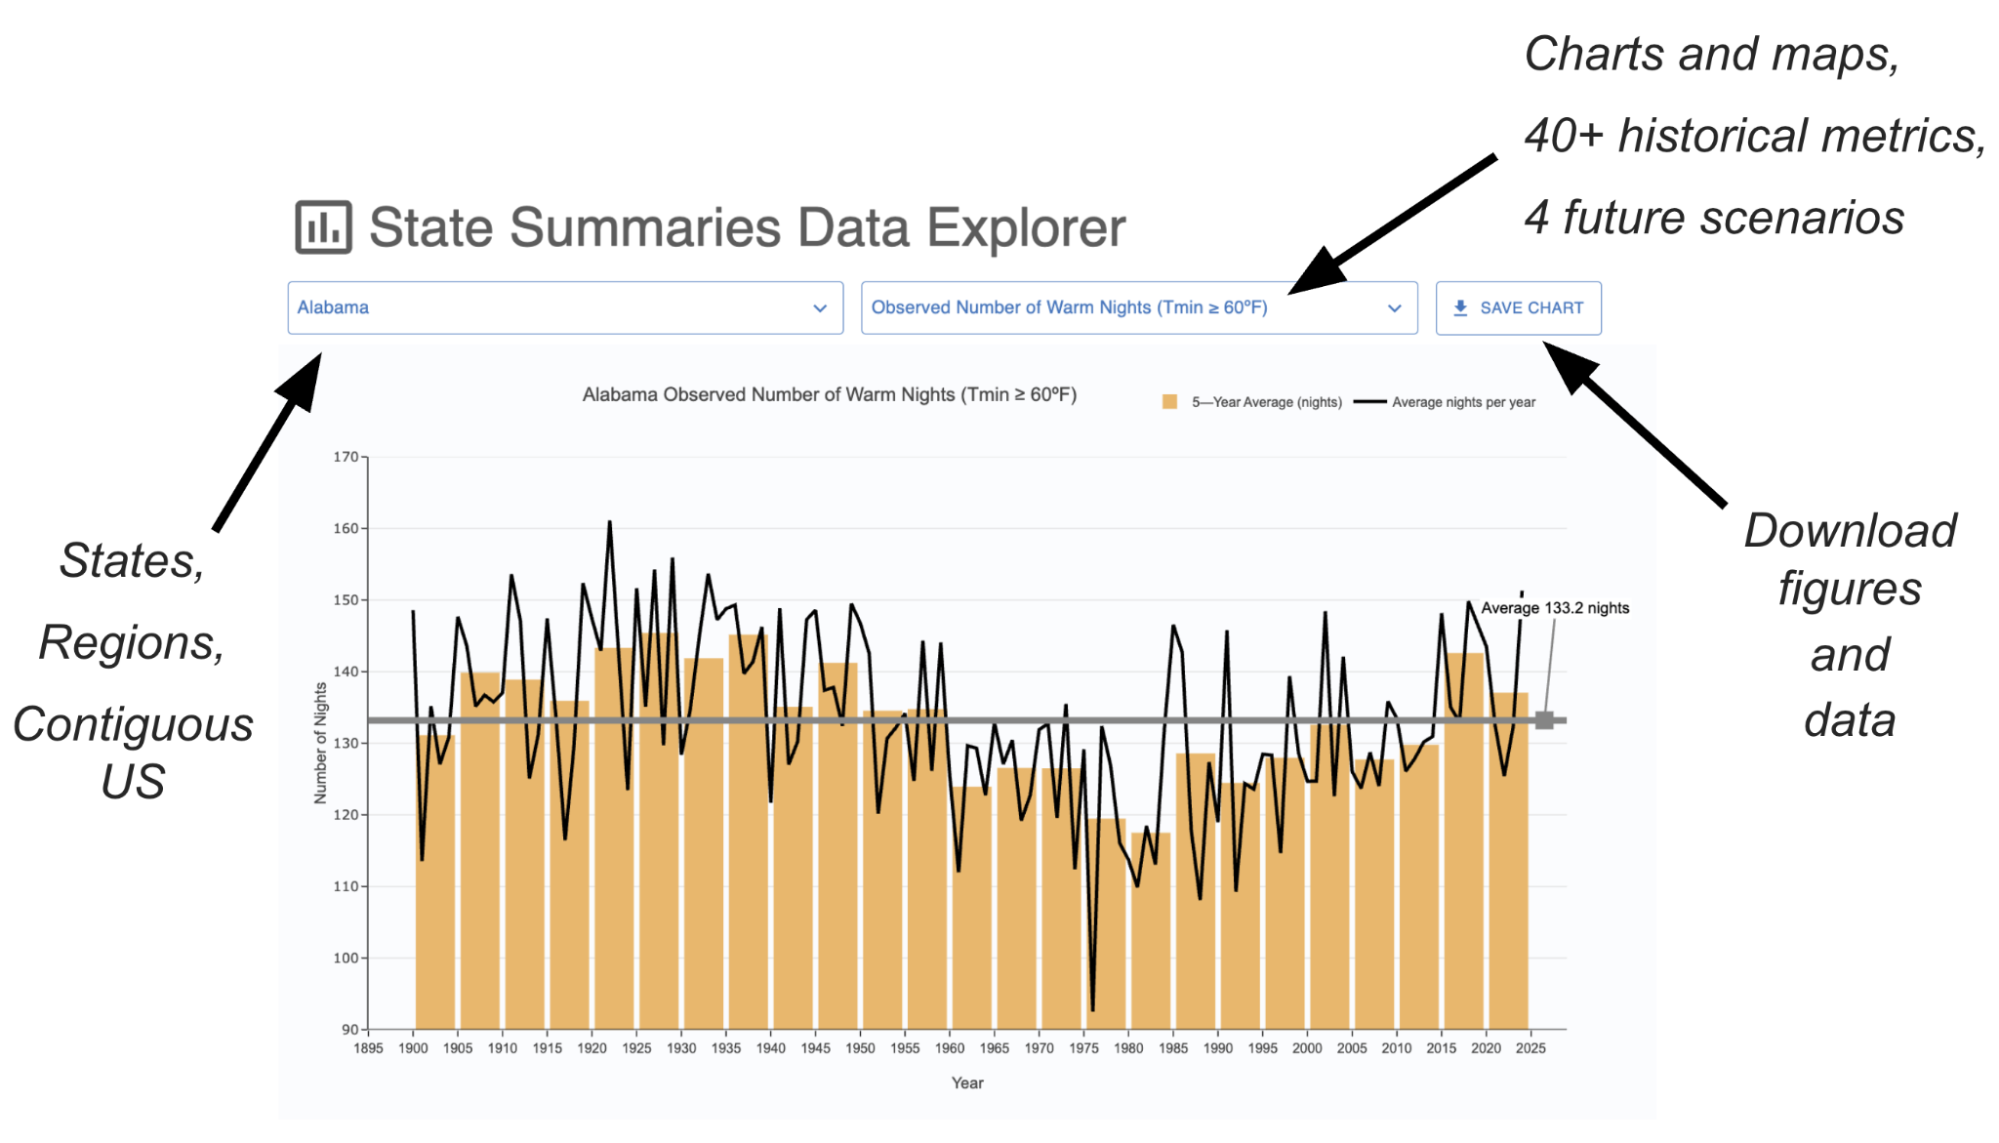
A screenshot from the online Data Explorer, annotated to highlight features.
Your Chance to Contribute
Even as the new version of the state summaries is released, the work continues. NCICS staff will be hosting webinars and conducting other post-release engagement activities. The goal is to spread the word about this resource and learn how it can be improved. To receive updates related to the State Climate Summaries, sign up here. And as you work with the summaries, please let us know what you think. “Feedback is vital to us,” Stevens said. “We’d love to hear how you use the summaries in your work and what improvements would make them even more valuable.” To share your thoughts, email scs_engagement@ncics.org.To read the summaries, visit https://statesummaries.ncics.org/.