Data from NOAA Technical Report NESDIS 144
The following figures were created by the National Climate Assessment (NCA) Technical Support Unit (TSU) for the NOAA Technical Report NESDIS 144 (TR144).
Click “Download data files” to download the relevant data files.
Please cite the following reference when using any of these figures:
Sun, L., K.E. Kunkel, L.E. Stevens, A. Buddenberg, J.G. Dobson, and D.R. Easterling, 2015: Regional Surface Climate Conditions in CMIP3 and CMIP5 for the United States: Differences, Similarities, and Implications for the U.S. National Climate Assessment, NOAA Technical Report NESDIS 144, 111 pp.
 The full TR144 report can be found
online here.
The full TR144 report can be found
online here.
TR144 Data Figures
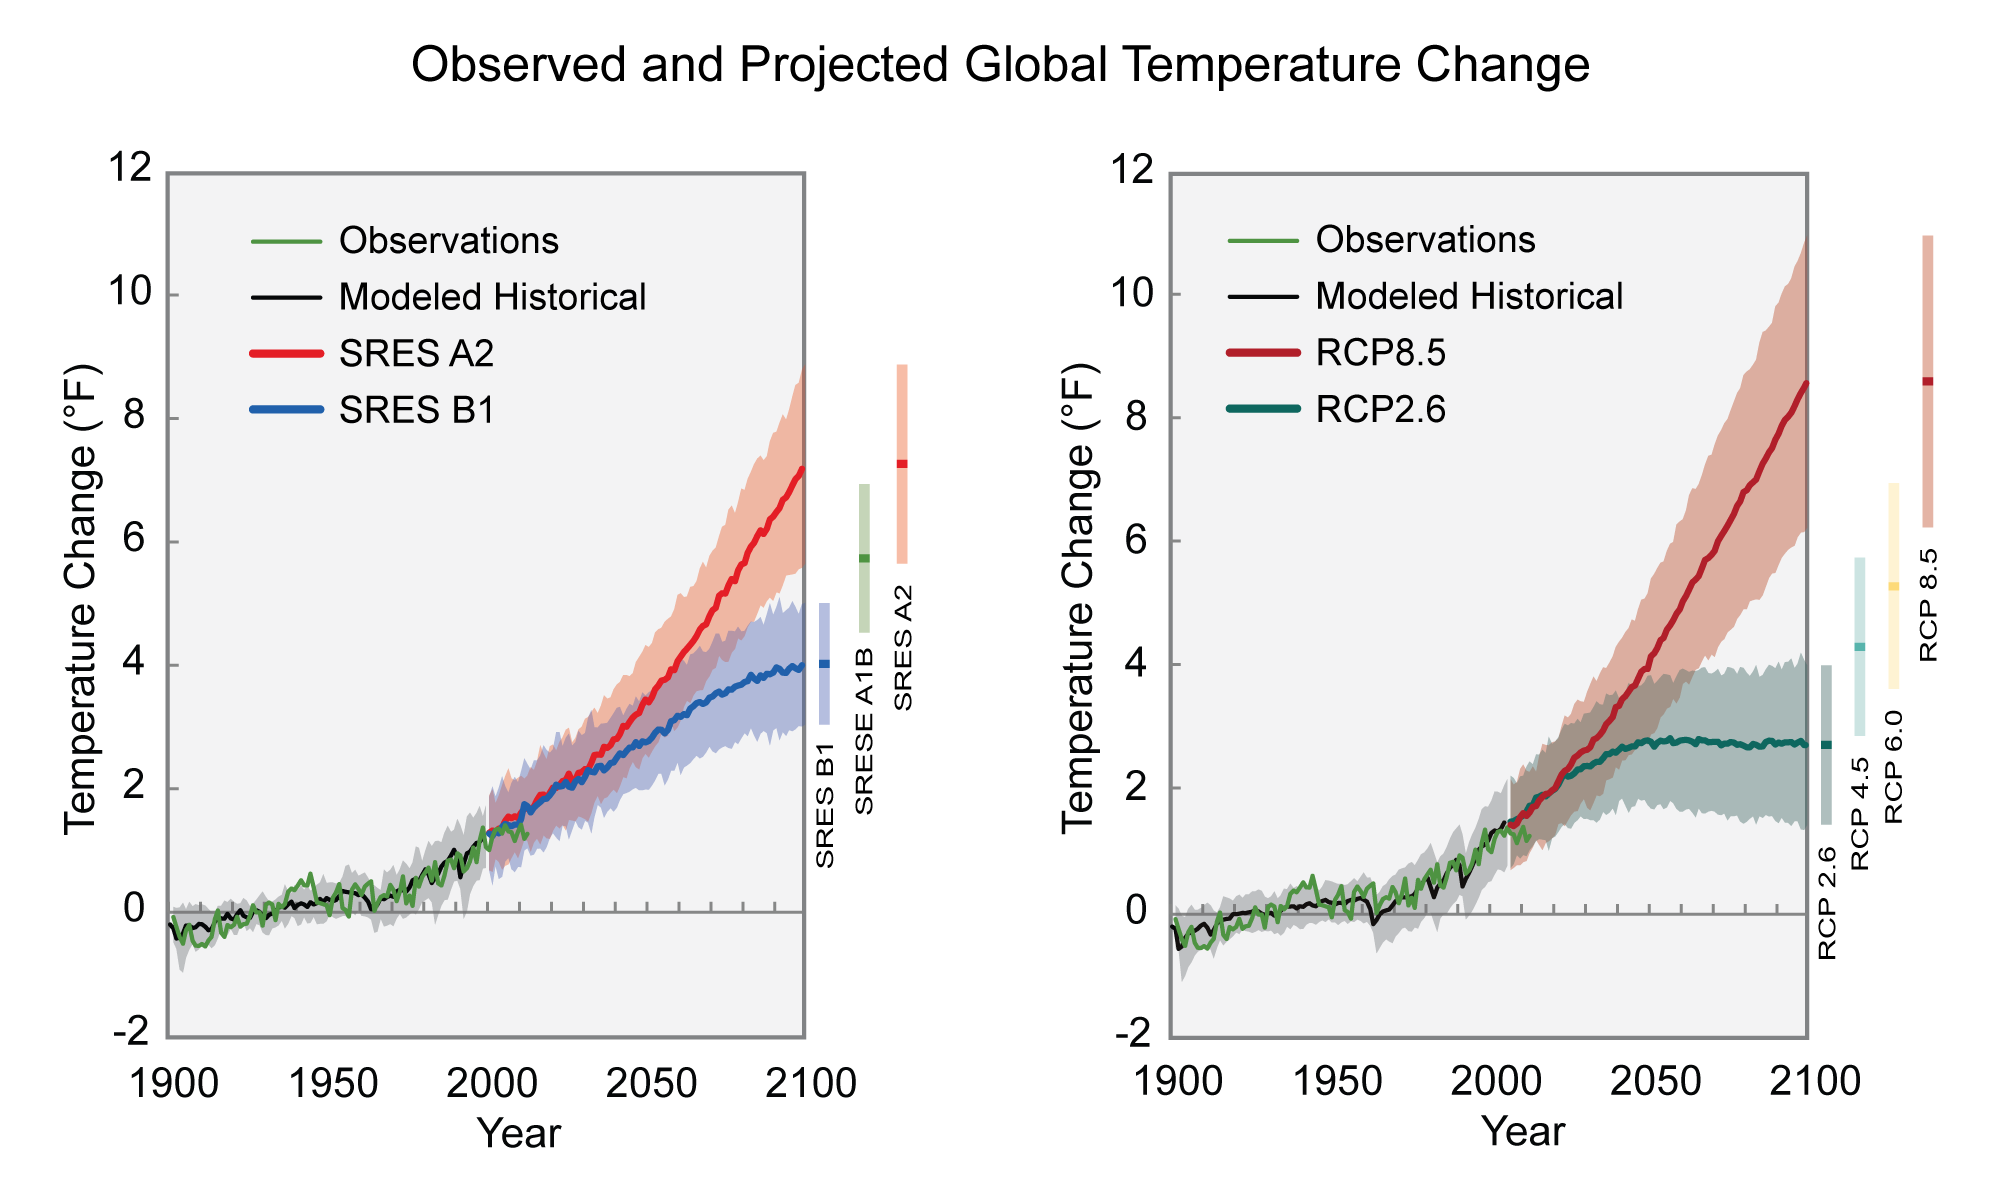
Observed and Projected Global Temperature Change
Time series of global average temperature changes (relative to the 1901–1960 average) for specific emissions pathways. Shading indicates the range (5th to 95th percentile) of results from a suite of climate models. Projections in 2099 for additional emissions pathways are indicated by the bars to the right of each panel. The left panel shows the CMIP3 simulations for the SRES A2 and B1 scenarios. The right panel shows the CMIP5 simulations for the RCP8.5 and 2.6 scenarios. The thick solid lines show the multi-model mean values. The thin green line shows the observed global temperature. Figure source: Adapted from Melillo et al. (2014).
URL: http://nca2014.globalchange.gov/report/our-changing-climate/future-climate-change#narrative-page-16565
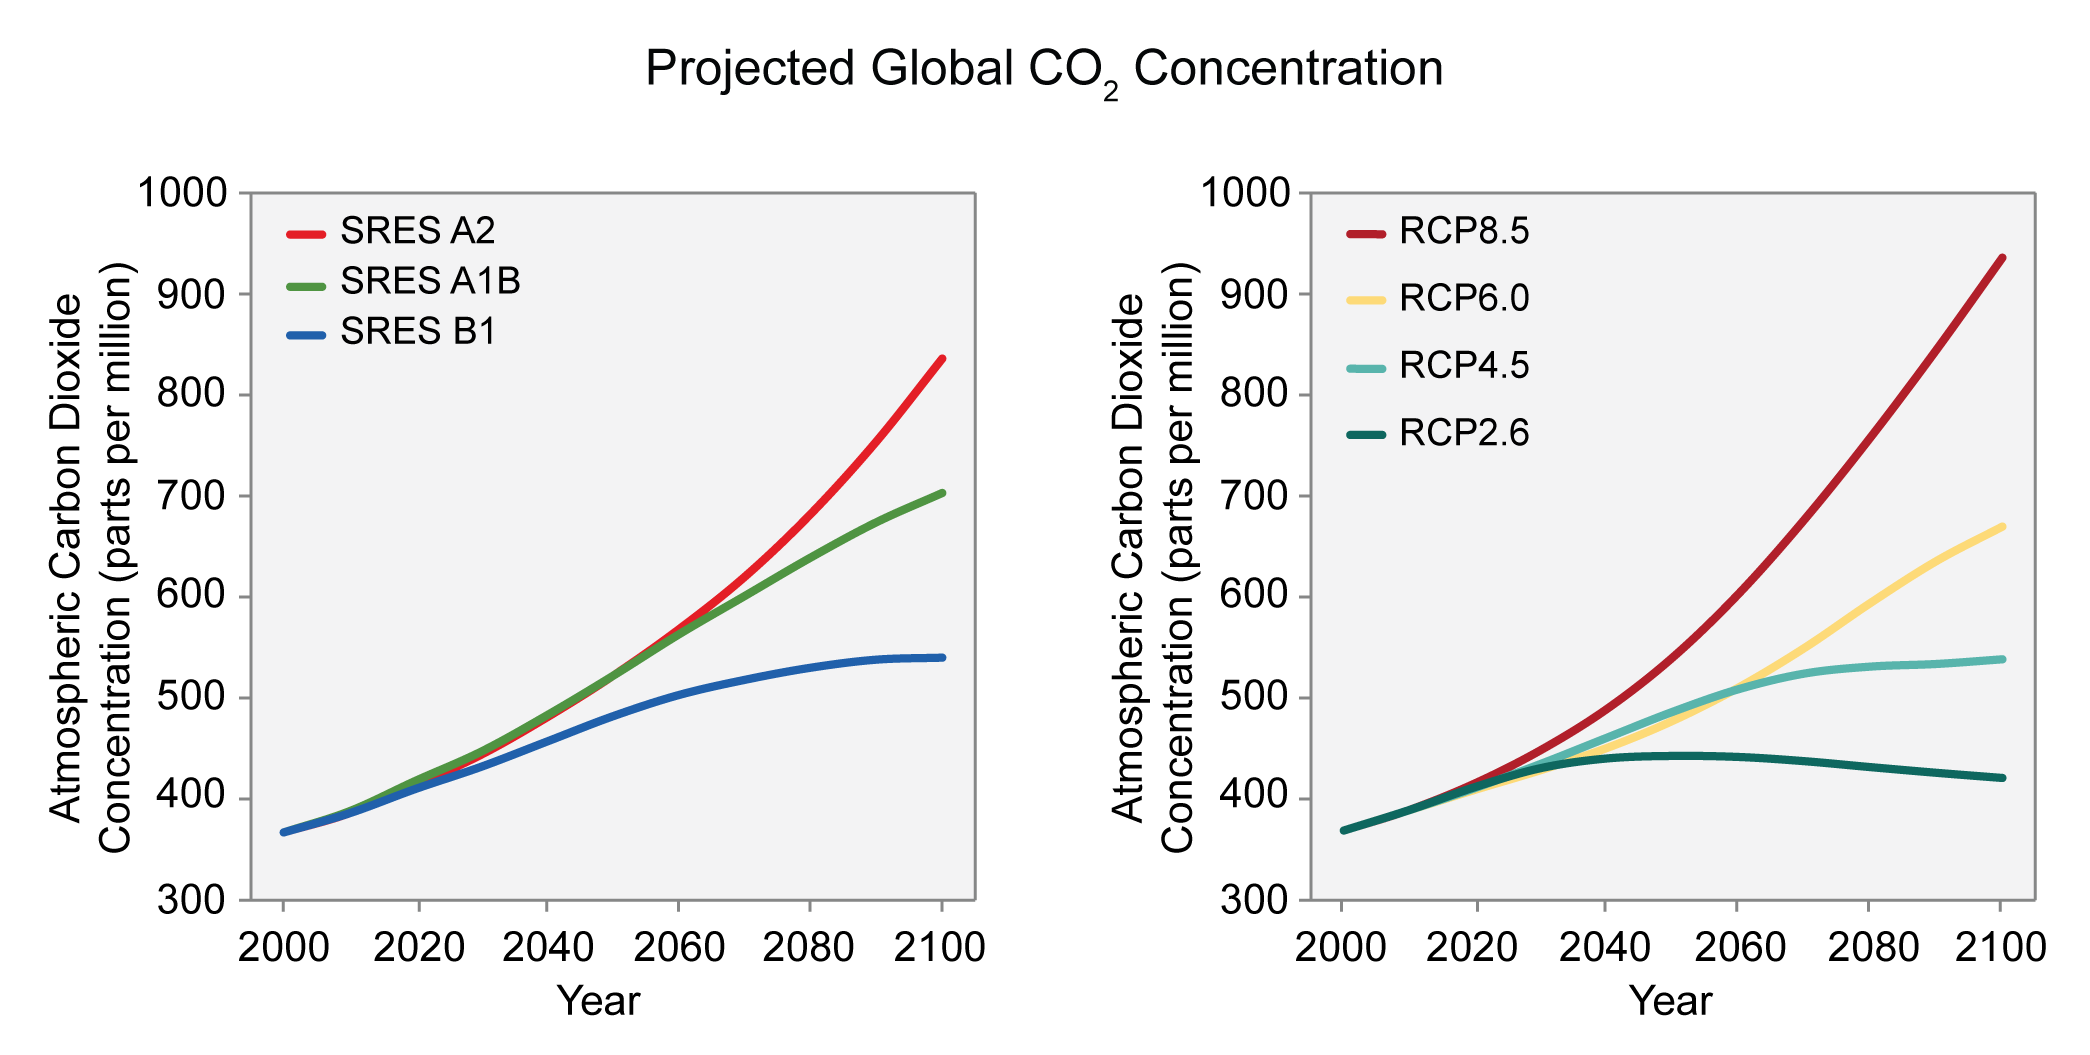
Projected Global CO2 Concentration
Time series of global average atmospheric carbon dioxide concentration for specific emissions
pathways. The left panel shows the CMIP3 simulations for the SRES A2, A1B and B1 scenarios. The right
panel shows the CMIP5 simulations for the RCP8.5, 6.0, 4.5, and 2.6 scenarios. Figure source: Adapted from
Melillo et al. (2014).
URL: http://nca2014.globalchange.gov/report/appendices/climate-science-supplement#narrative-page-38702
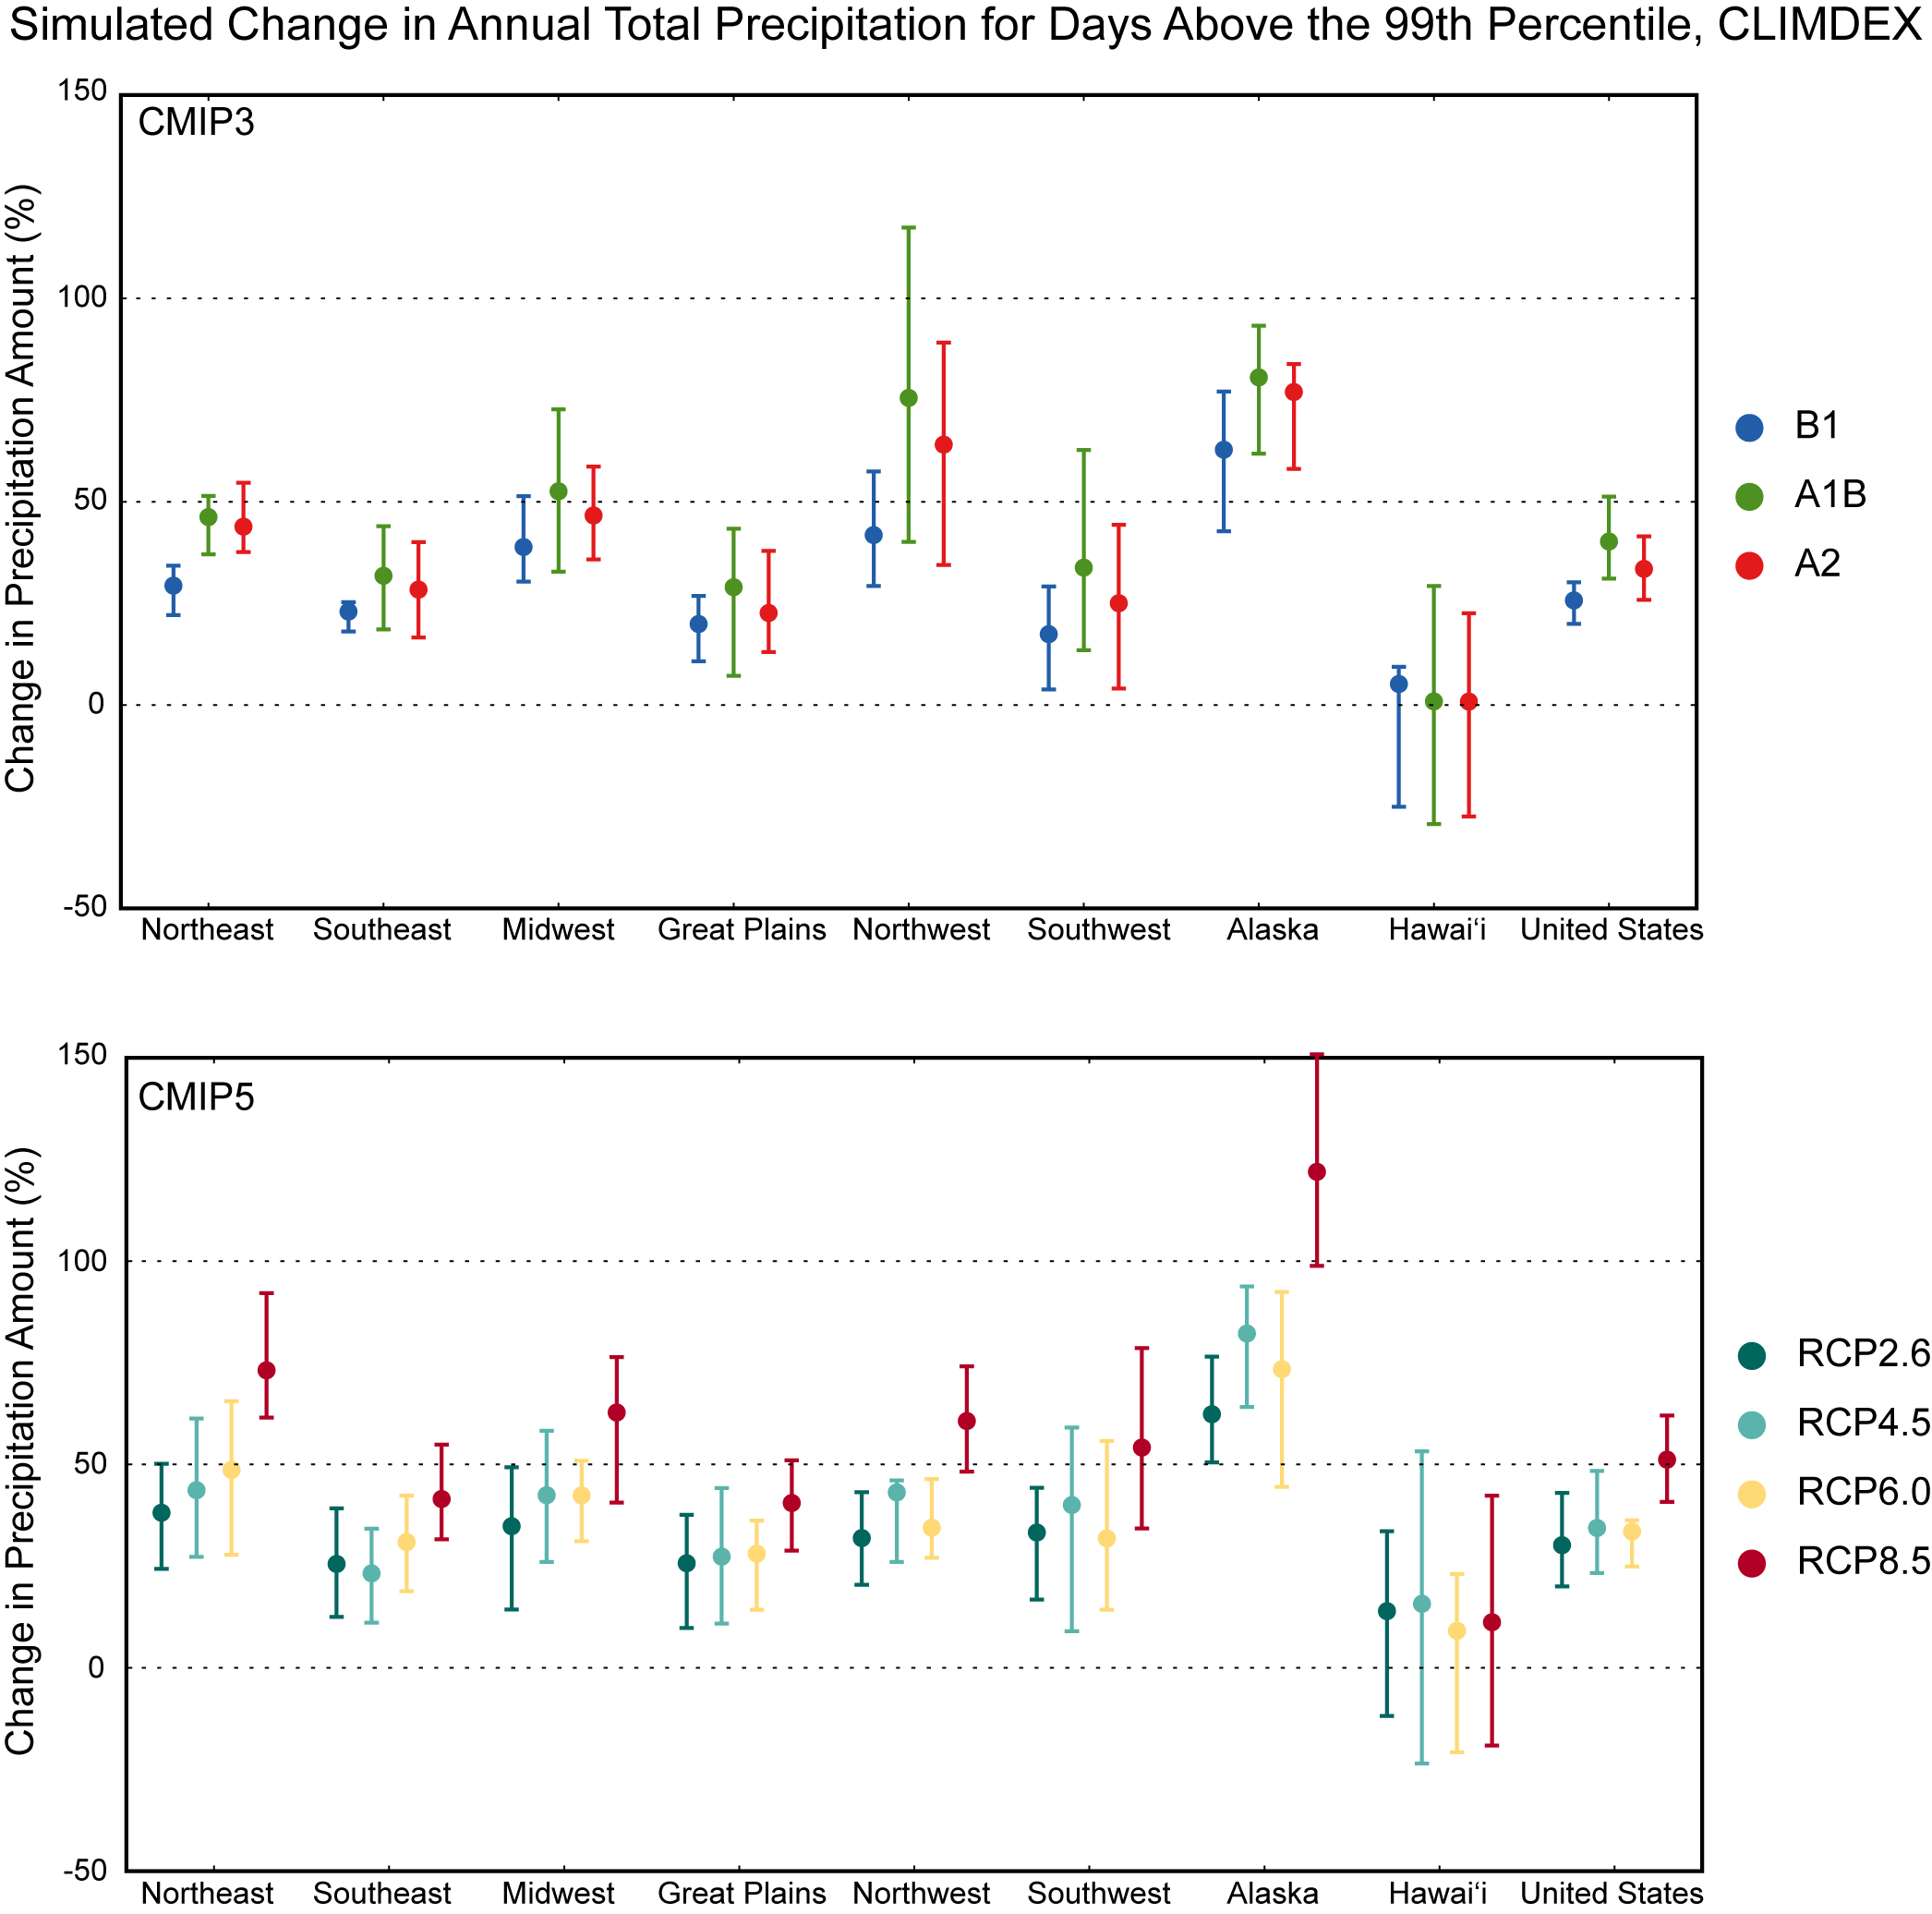
Simulated Annual Total Precipitation for Days Above the 99th Percentile, CLIMDEX RCP8.5
Simulated change in annual total precipitation for days above the 99th percentile (R99pTOT) for each region and the contiguous United State, for 2046–2065 with respect to the reference period of 1981–2000. The upper panel shows values for the CLIMDEX SRES B1 (blue), A1B (green), and A2 (red) scenarios. The lower panel shows values for the CLIMDEX RCP2.6 (dark teal), 4.5 (light teal), 6.0 (yellow), and 8.5 (dark red) scenarios. Bars indicate the interquartile ranges of model values and circles depict the multi-model means.
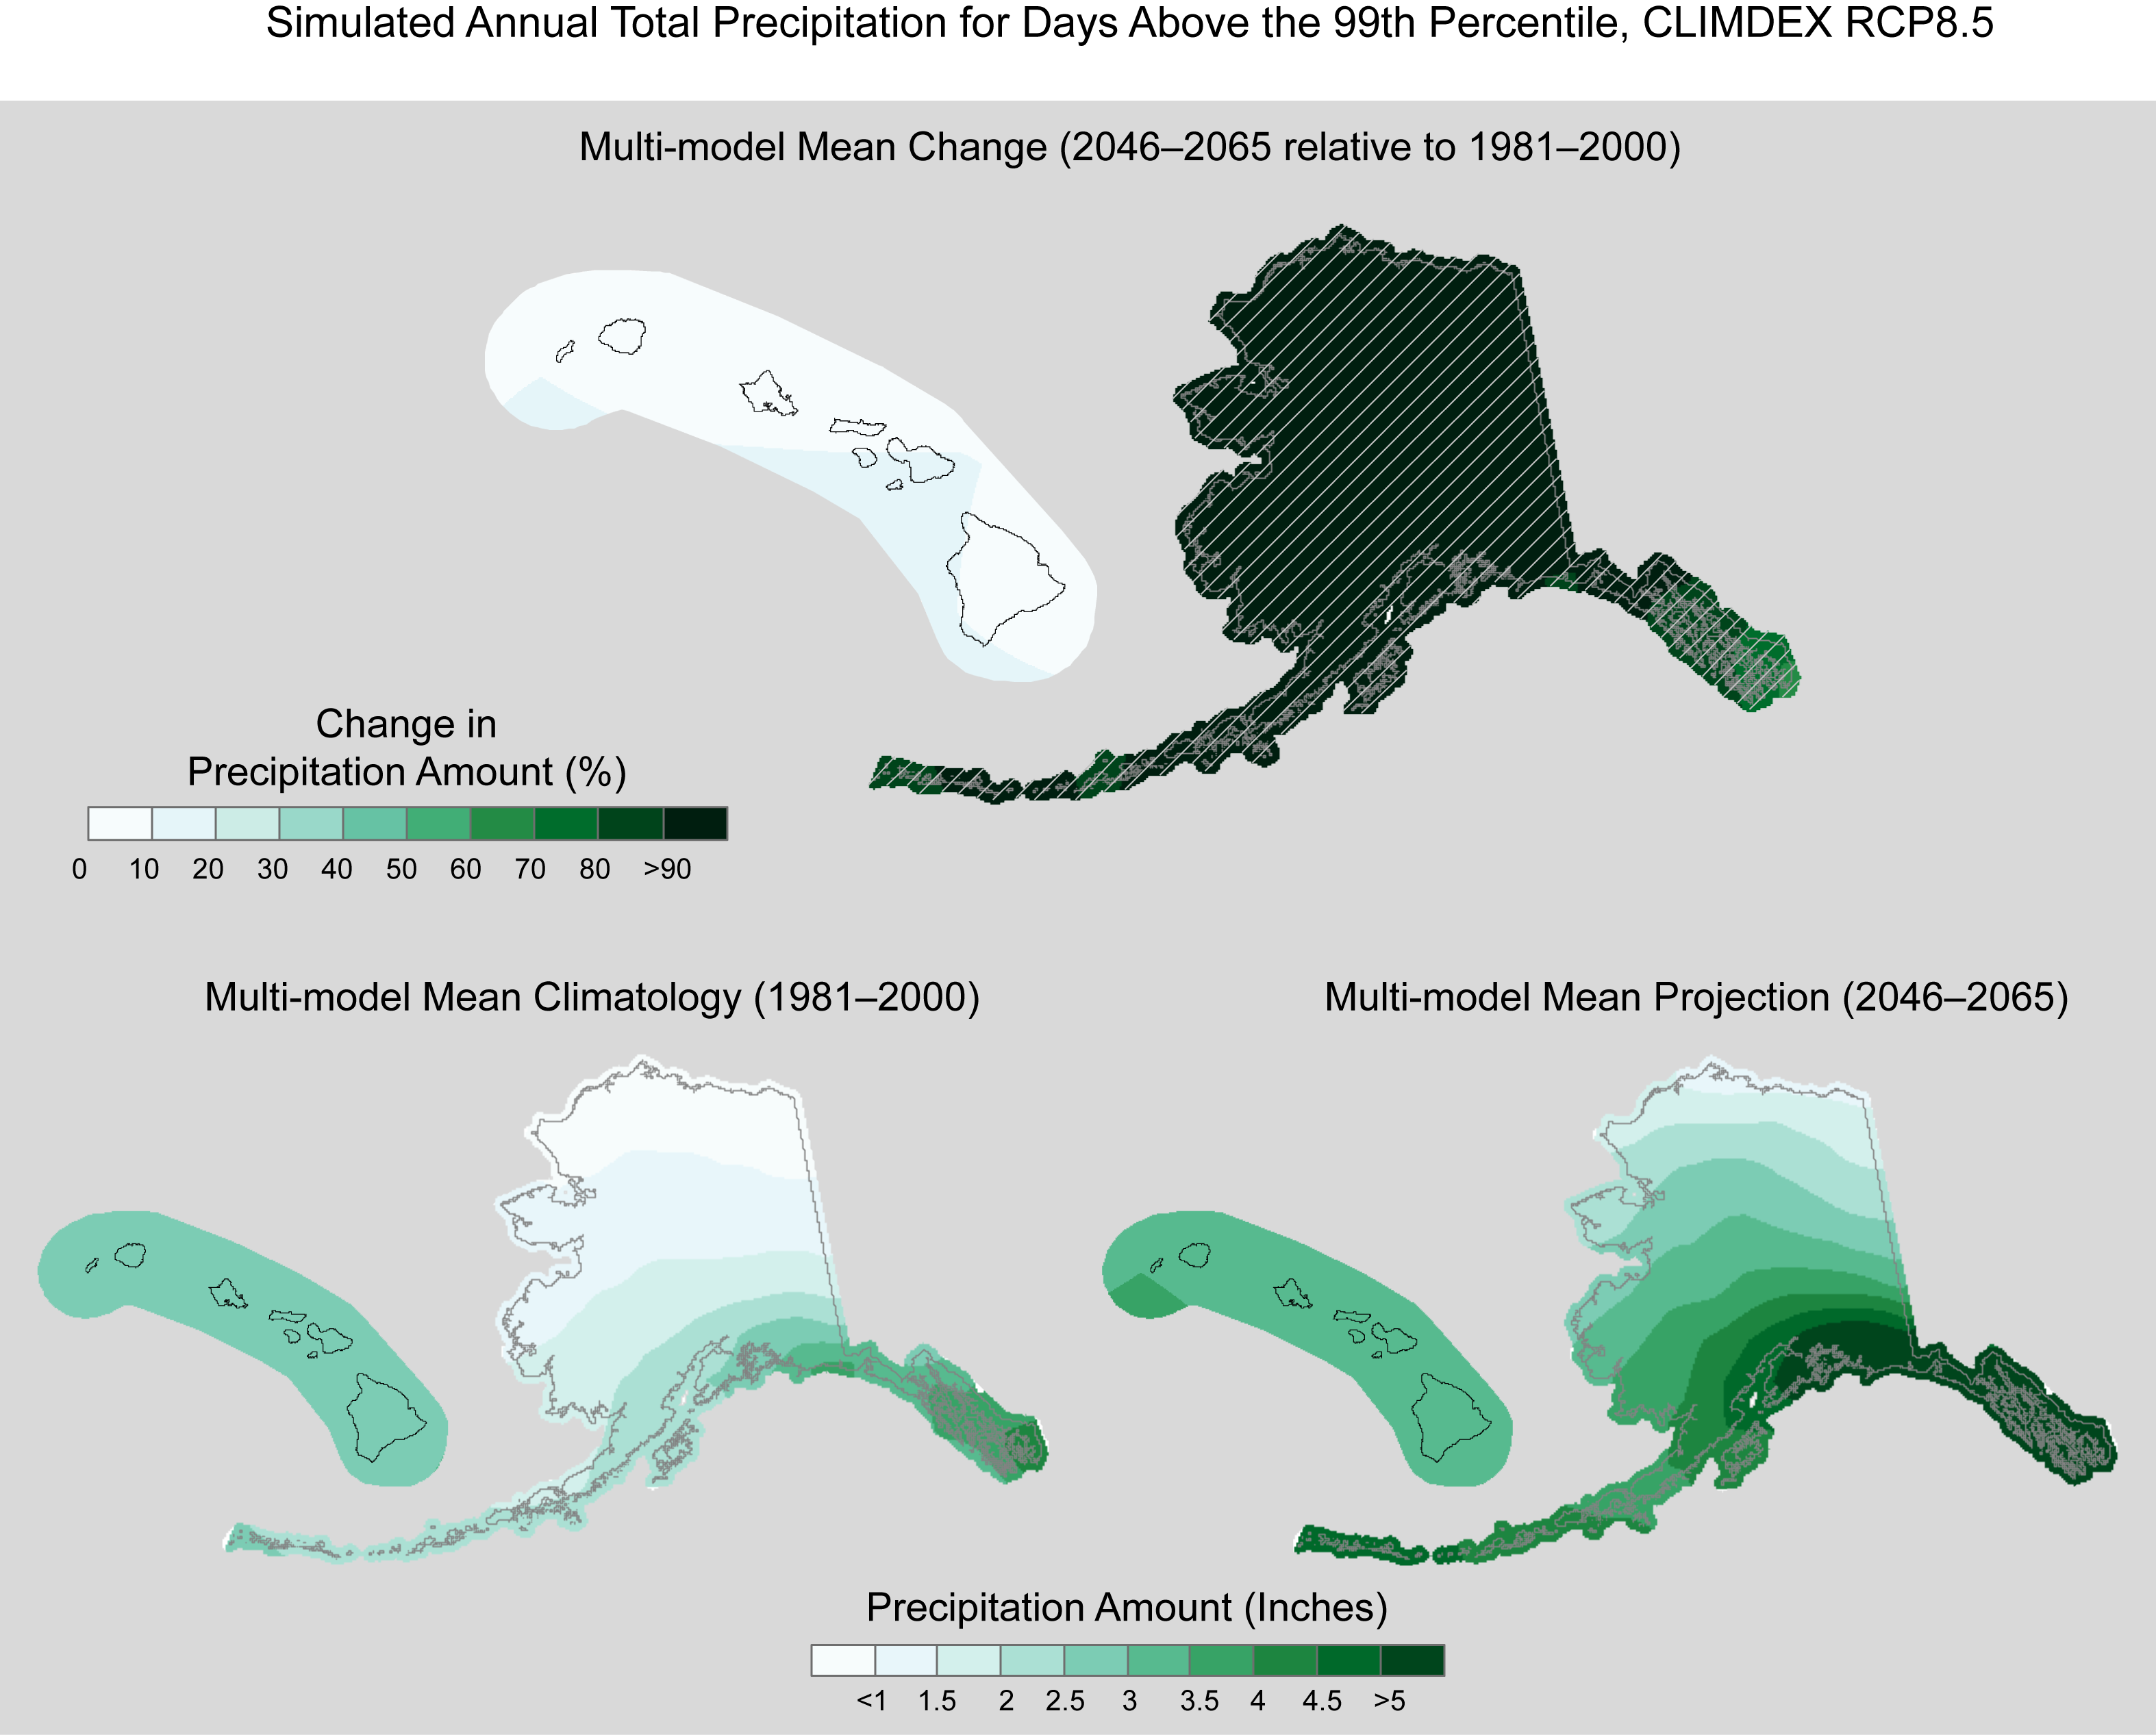
Simulated Annual Total Precipitation for Days Above the 99th Percentile, CLIMDEX RCP8.5 (Alaska and Hawaii)
Simulated multi-model mean change in annual total precipitation for days above the 99th percentile (R99pTOT) for Alaska and Hawai‘i, for 2046–2065 with respect to the reference period of 1981–2000, using the CLIMDEX RCP8.5 scenario (top). Color only (category 1) indicates that less than 50% of the models show a statistically significant change. Color with hatching (category 3) indicates that more than 50% of the models show a statistically significant change, and more than 67% agree on the sign of the change (see Section 3). Multi-model mean climatology indicating the R99pTOT for 1981–2000 (bottom left). Multi-model mean projection indicating the R99pTOT for 2046–2065 (bottom right).
Simulated Annual Total Precipitation for Days Above the 99th Percentile, CLIMDEX RCP8.5
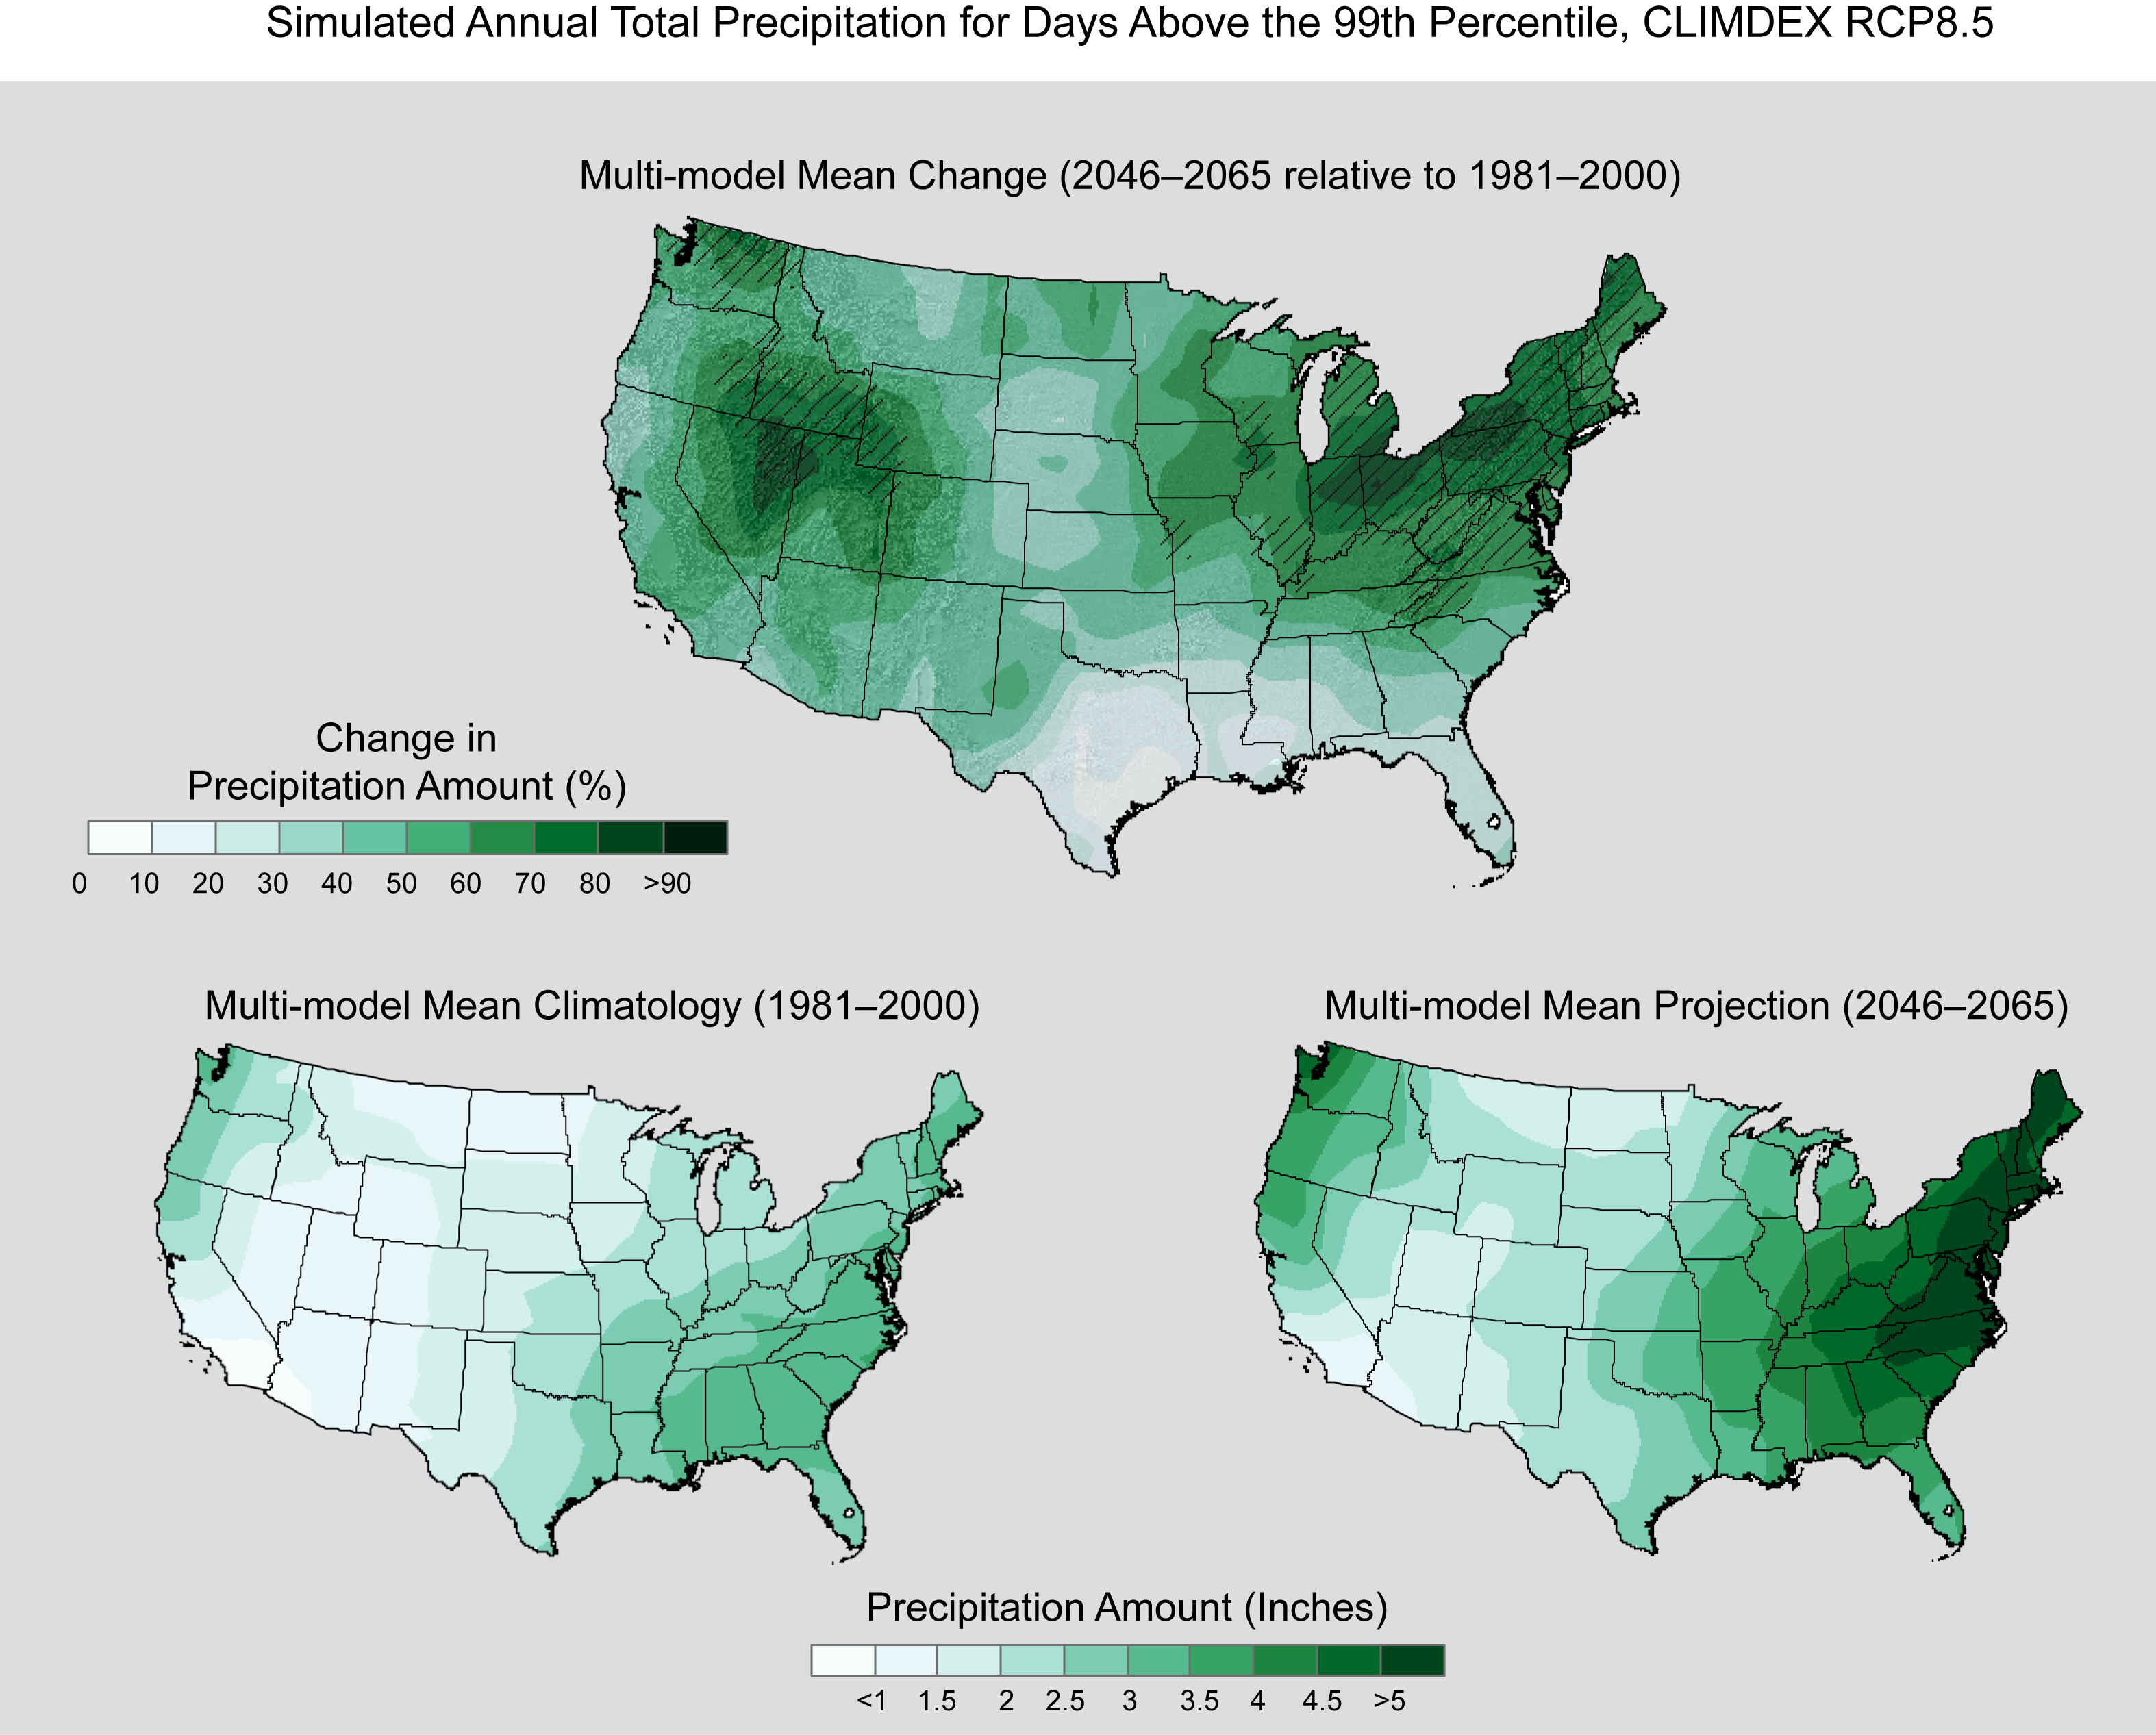
Simulated multi-model mean change in annual total precipitation for days above the 99th percentile (R99pTOT) for the contiguous United States, for 2046–2065 with respect to the reference period of 1981–2000, using the CLIMDEX RCP8.5 scenario (top). Color only (category 1) indicates that less than 50% of the models show a statistically significant change. Color with hatching (category 3) indicates that more than 50% of the models show a statistically significant change, and more than 67% agree on the sign of the change (see Section 3). Multi-model mean climatology indicating the R99pTOT for 1981–2000 (bottom left). Multi-model mean projection indicating the R99pTOT for 2046–2065 (bottom right).

Simulated Annual Longest Wet Spell, CLIMDEX RCP8.5
Simulated change in the annual maximum number of consecutive wet days (CWD) for each region and the contiguous United States, for 2046–2065 with respect to the reference period of 1981–2000. The upper panel shows values for the CLIMDEX SRES B1 (blue), A1B (green), and A2 (red) scenarios. The lower panel shows values for the CLIMDEX RCP2.6 (dark teal), 4.5 (light teal), 6.0 (yellow), and 8.5 (dark red) scenarios. Bars indicate the interquartile ranges of model values and circles depict the multi-model means.

Simulated Annual Longest Wet Spell, CLIMDEX RCP8.5 (Alaska and Hawaii)
Simulated multi-model mean change in the annual maximum number of consecutive wet days (CWD) for Alaska and Hawai‘i, for 2046–2065 with respect to the reference period of 1981–2000, using the CLIMDEX RCP8.5 scenario (top). Color only (category 1) indicates that less than 50% of the models show a statistically significant change (see Section 3). Multi-model mean climatology indicating the annual number of CWD for 1981–2000 (bottom left). Multi-model mean projection indicating the annual number of CWD for 2046–2065 (bottom right).
Simulated Annual Longest Wet Spell, CLIMDEX RCP8.5
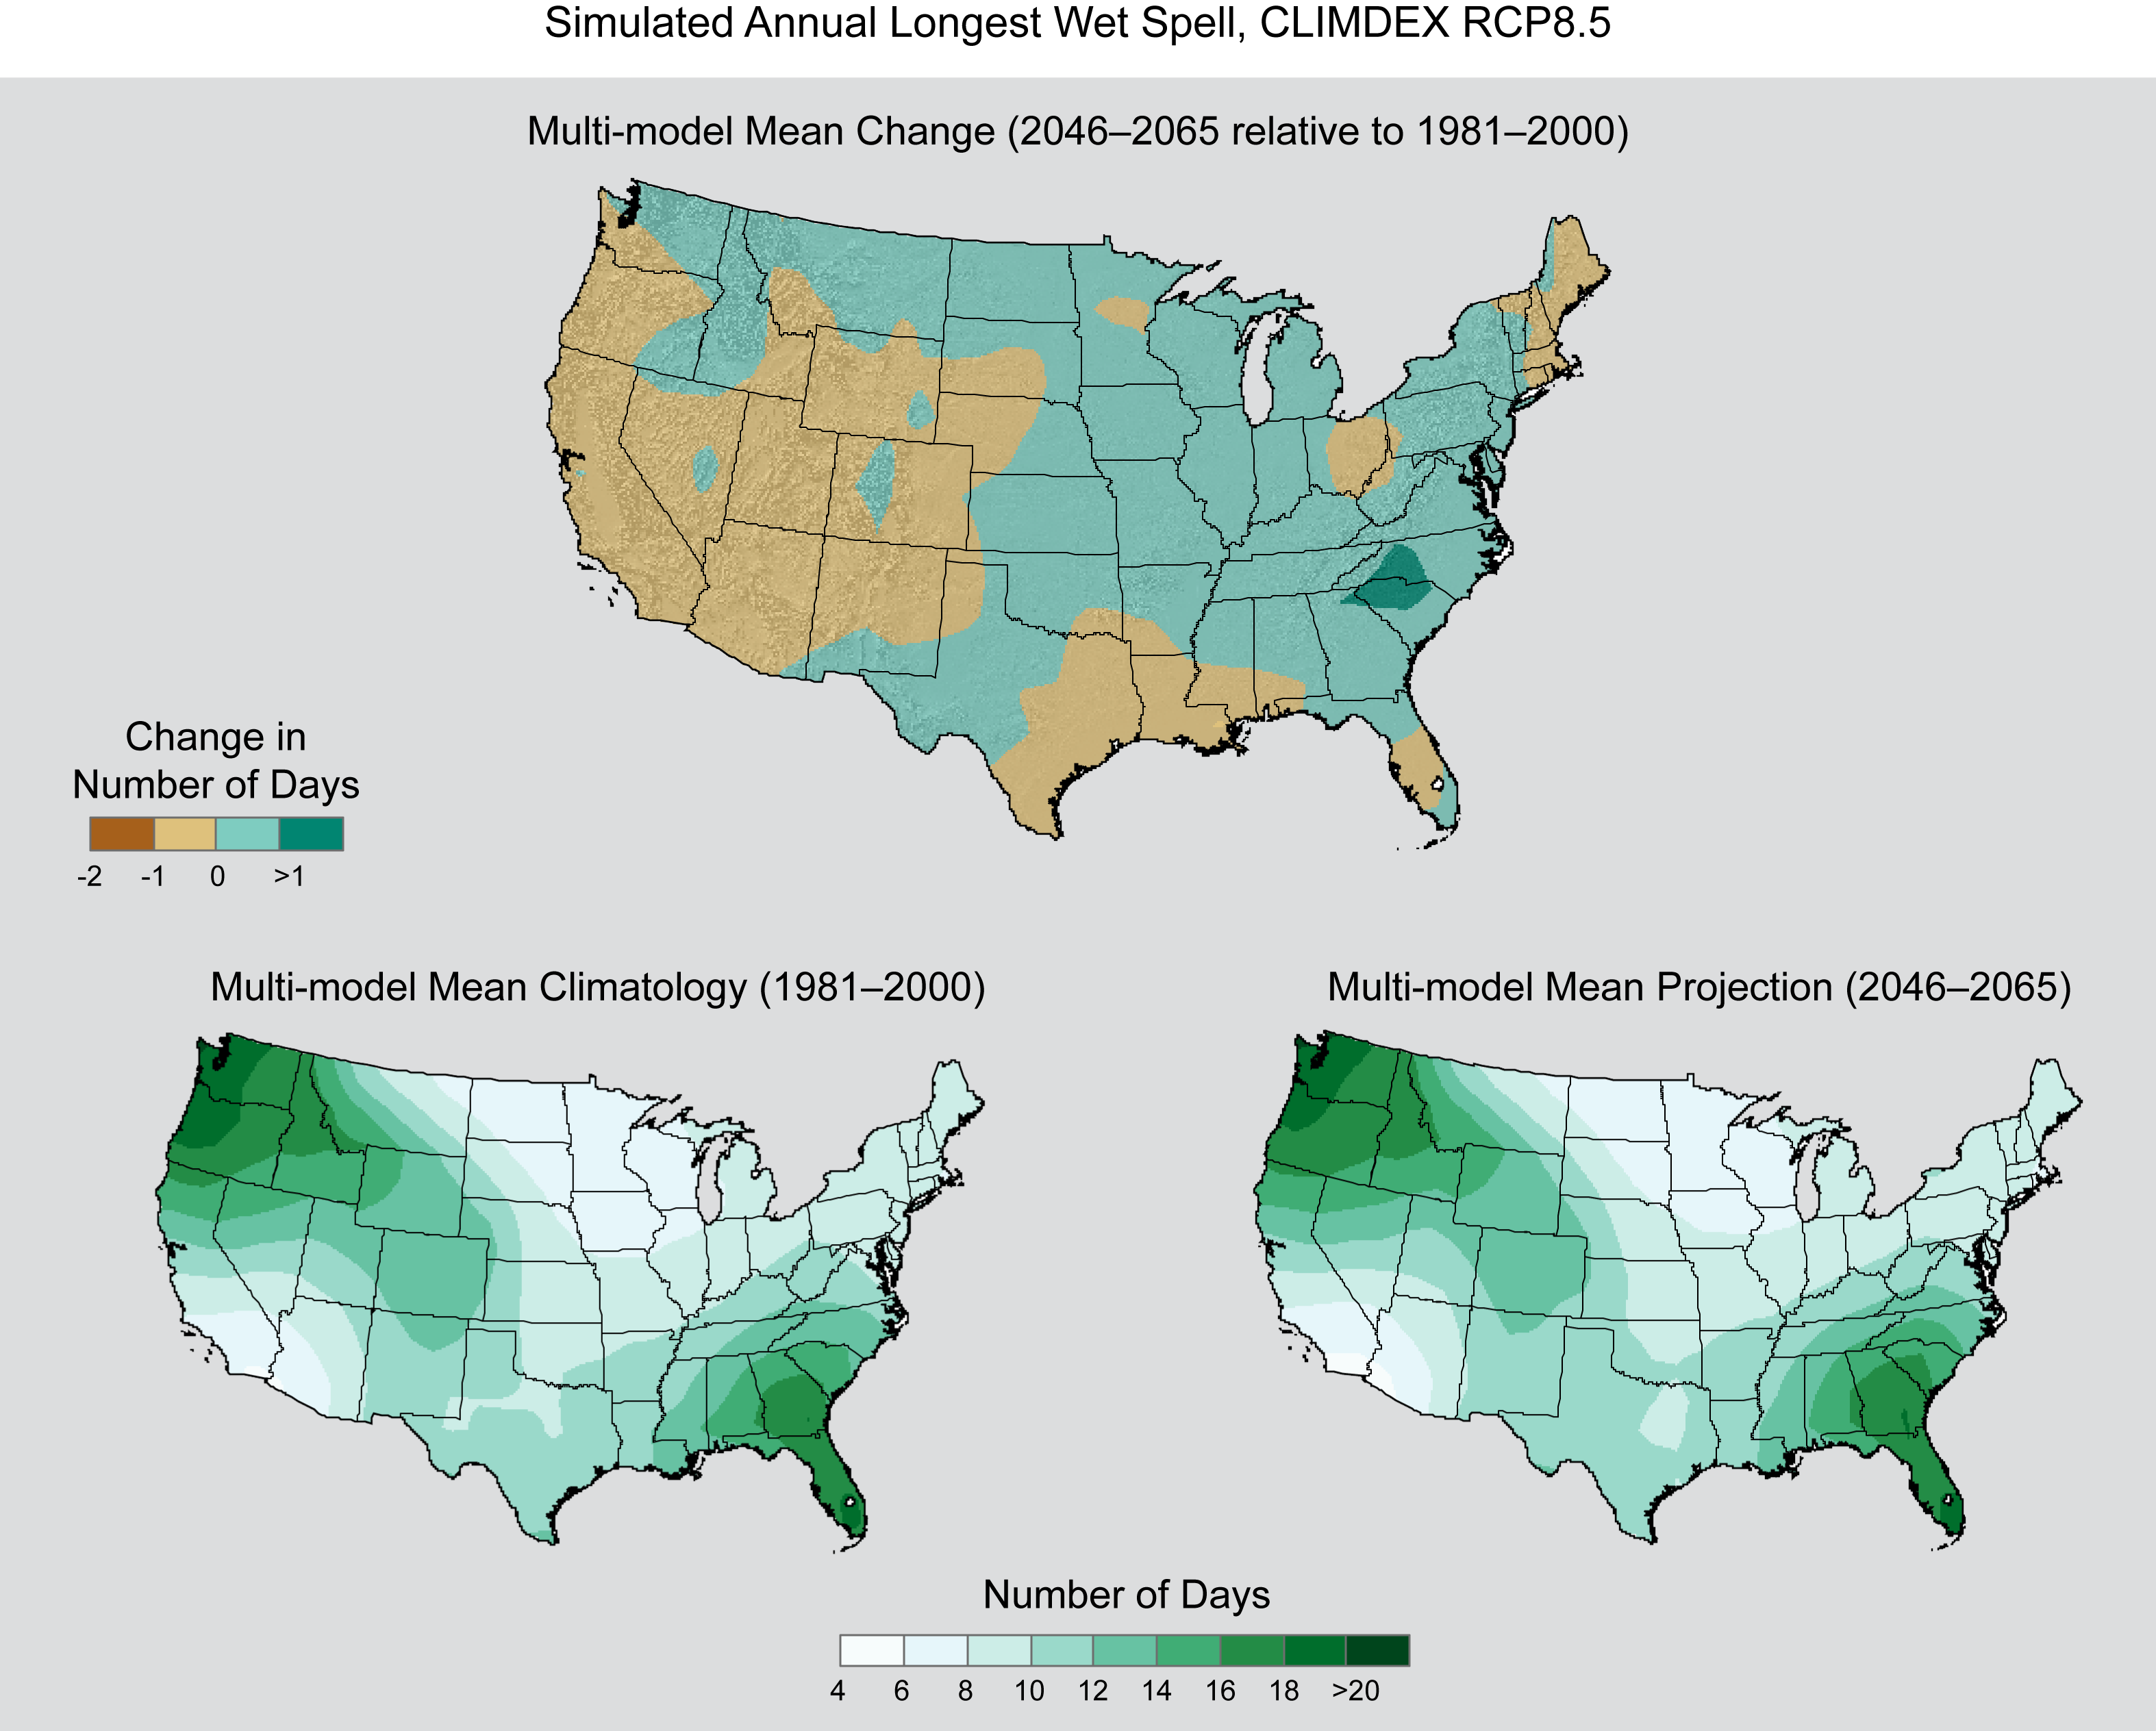
Simulated multi-model mean change in the annual maximum number of consecutive wet days (CWD) for the contiguous United States, for 2046–2065 with respect to the reference period of 1981–2000, using the CLIMDEX RCP8.5 scenario (top). Color only (category 1) indicates that less than 50% of the models show a statistically significant change (see Section 3). Multi-model mean climatology indicating the annual number of CWD for 1981–2000 (bottom left). Multi-model mean projection indicating the annual number of CWD for 2046–2065 (bottom right).
Simulated Annual Longest Dry Spell, CLIMDEX RCP8.5
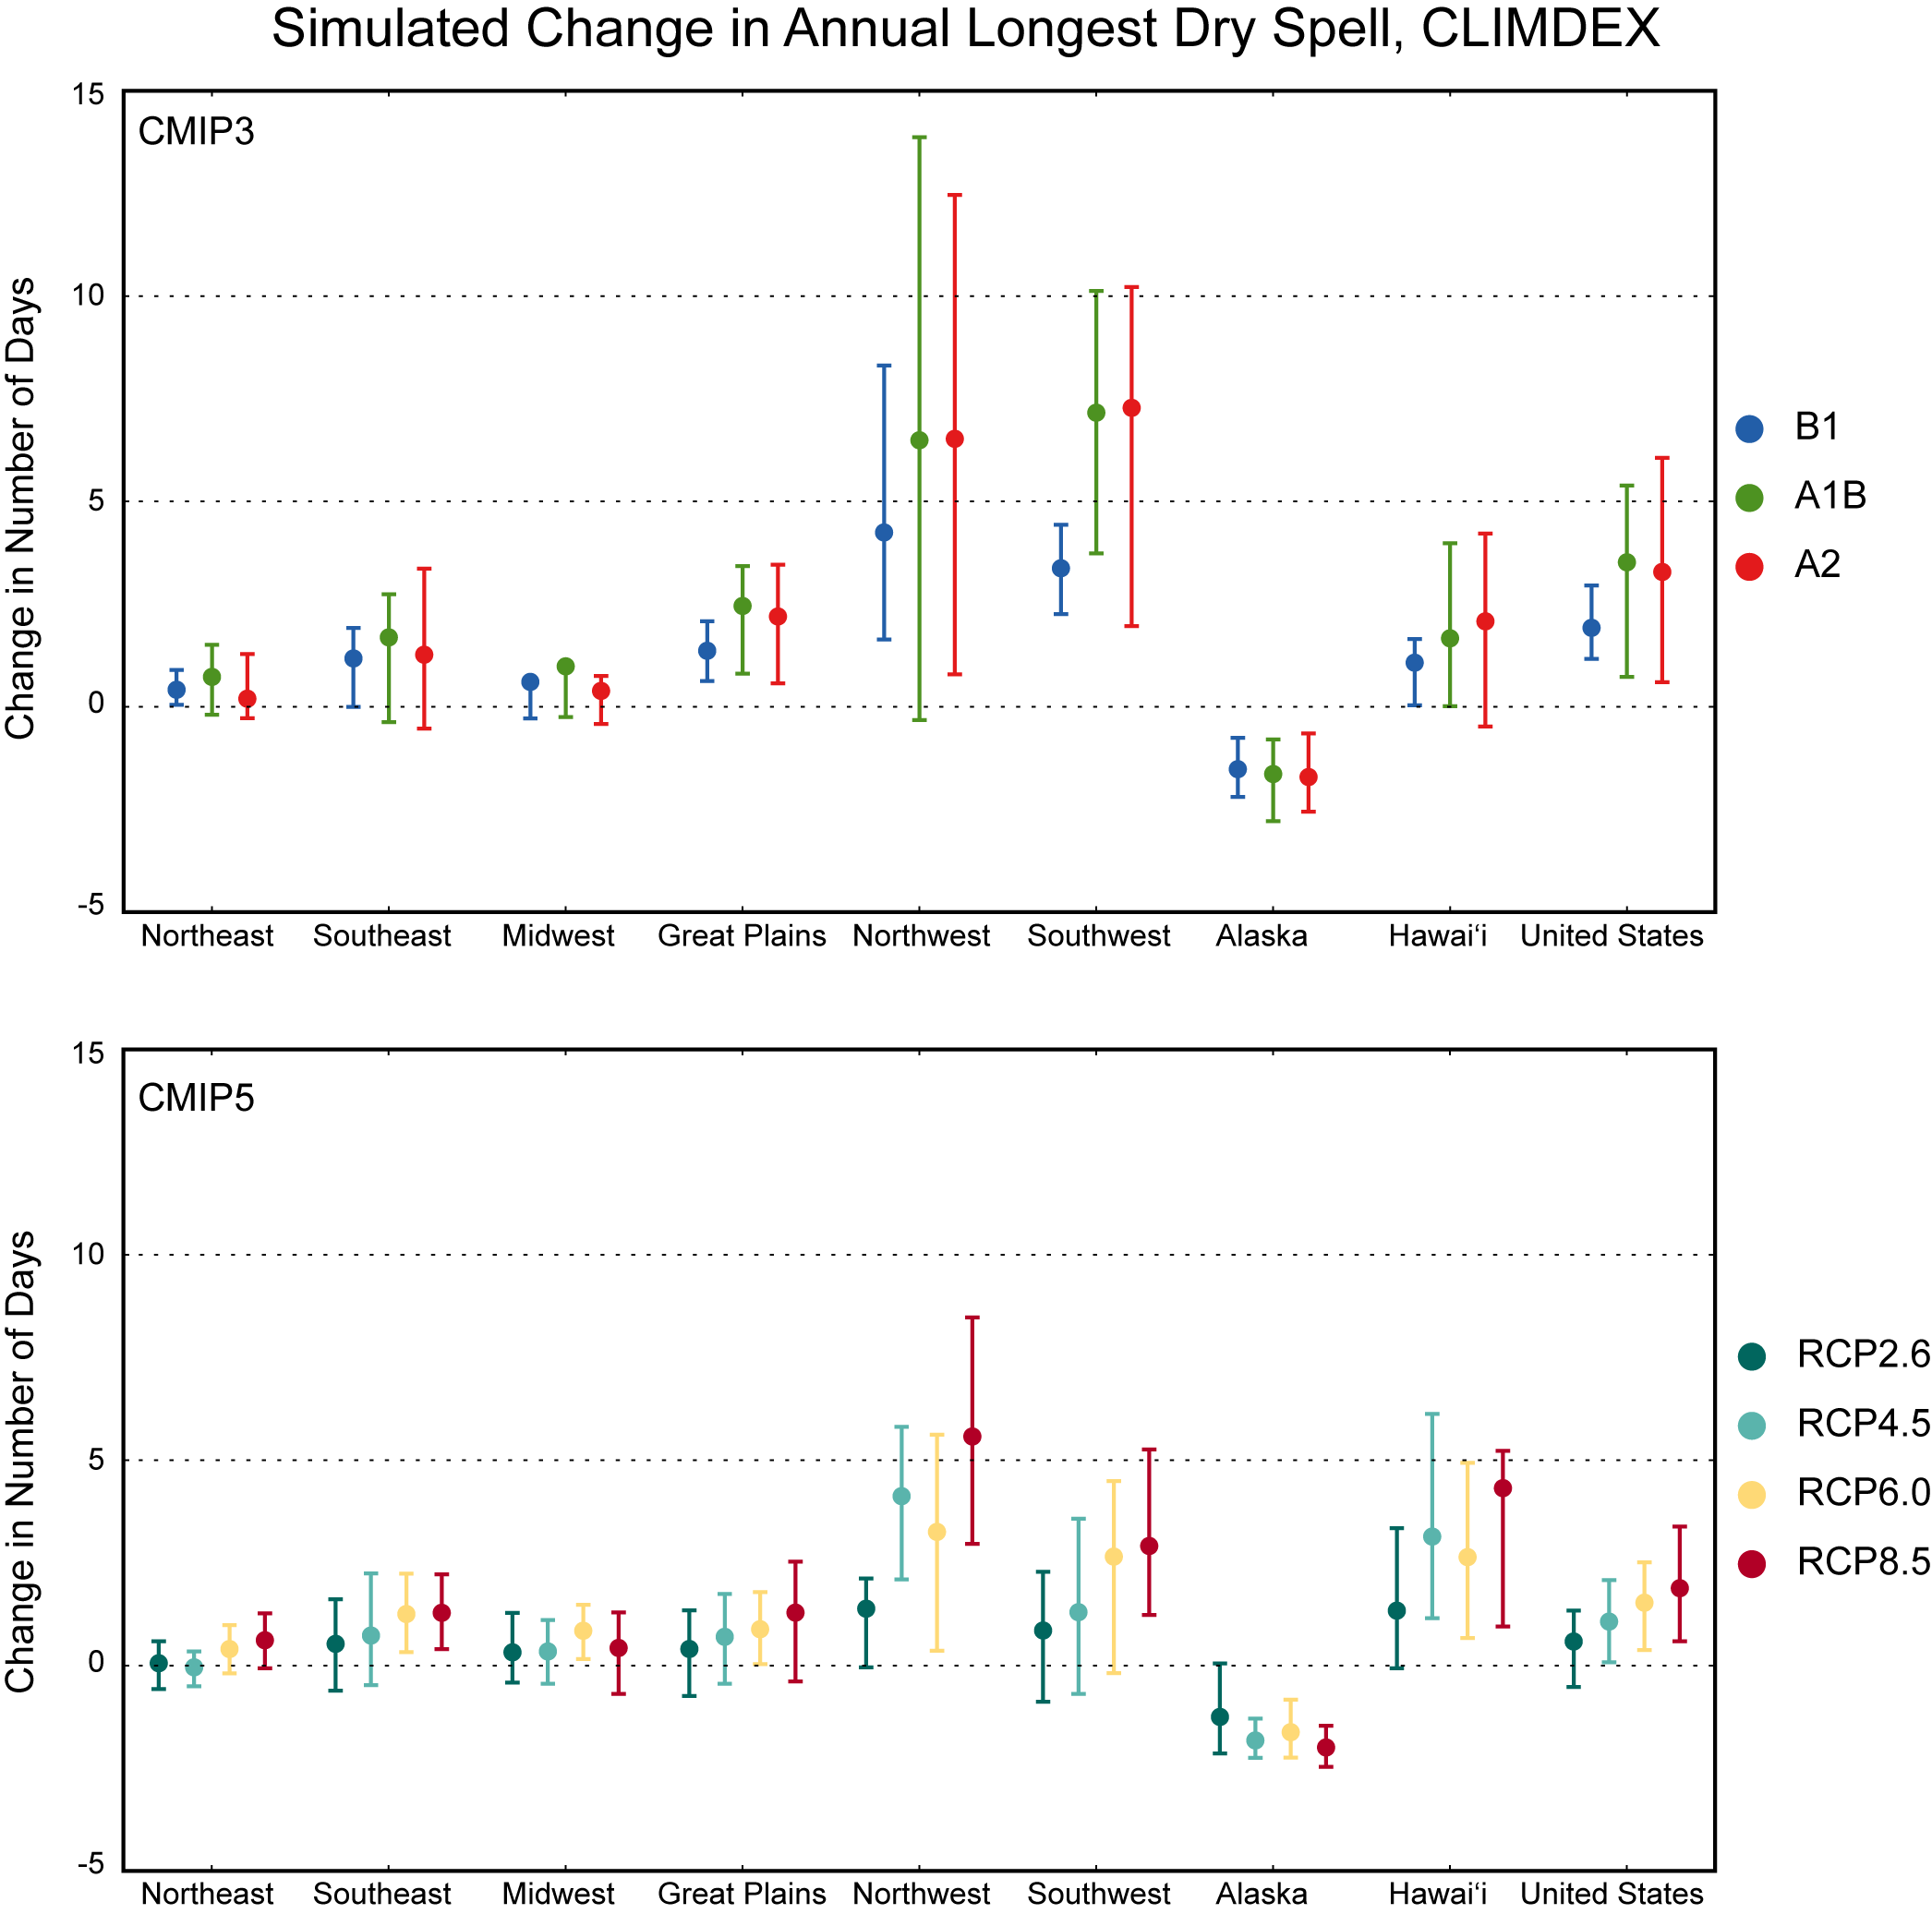
Simulated change in the annual maximum number of consecutive dry days (CDD) for each region and the contiguous United States, for 2046–2065 with respect to the reference period of 1981–2000. The upper panel shows values for the CLIMDEX SRES B1 (blue), A1B (green), and A2 (red) scenarios. The lower panel shows values for the CLIMDEX RCP2.6 (dark teal), 4.5 (light teal), 6.0 (yellow), and 8.5 (dark red) scenarios. Bars indicate the interquartile ranges of model values and circles depict the multi-model means.
Simulated Annual Longest Dry Spell, CLIMDEX RCP8.5 (Alaska and Hawaii)
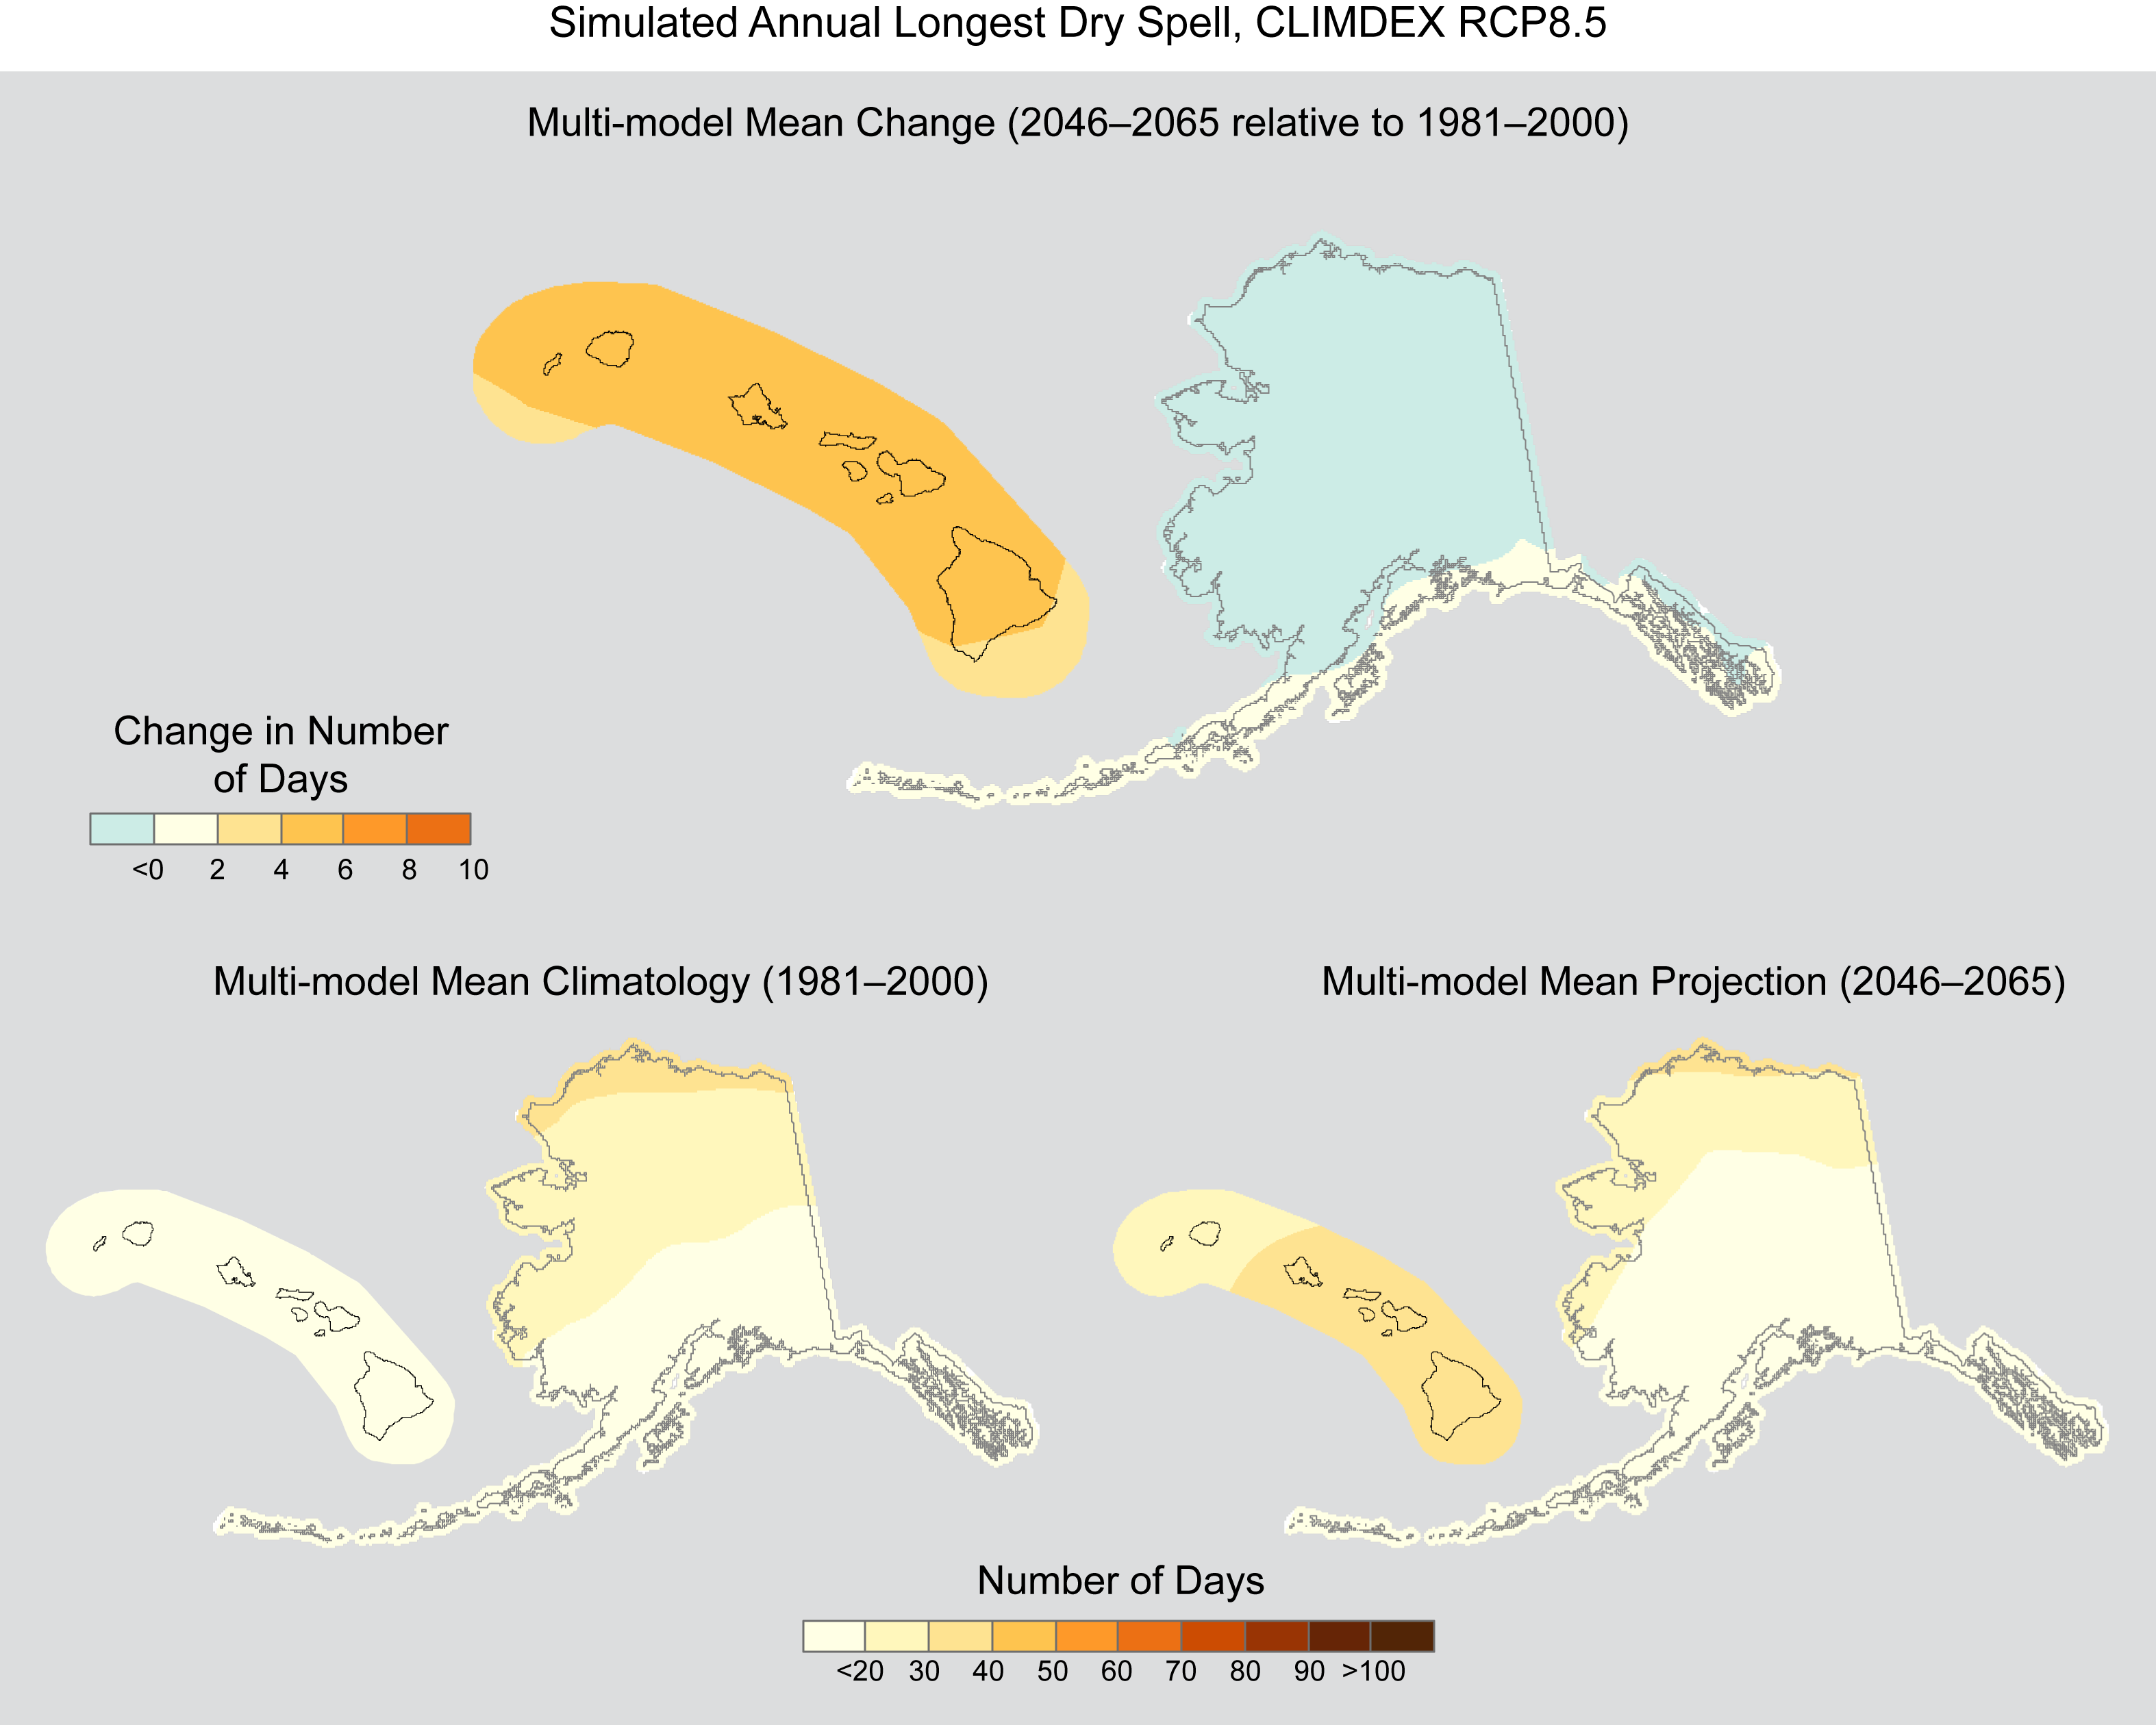
Simulated multi-model mean change in the annual maximum number of consecutive dry days (CDD) for Alaska and Hawai‘i, for 2046–2065 with respect to the reference period of 1981–2000, using the CLIMDEX RCP8.5 scenario (top). Color only (category 1) indicates that less than 50% of the models show a statistically significant change (see Section 3). Multi-model mean climatology indicating the annual number of CDD for 1981–2000 (bottom left). Multi-model mean projection indicating the annual number of CDD for 2046–2065 (bottom right).
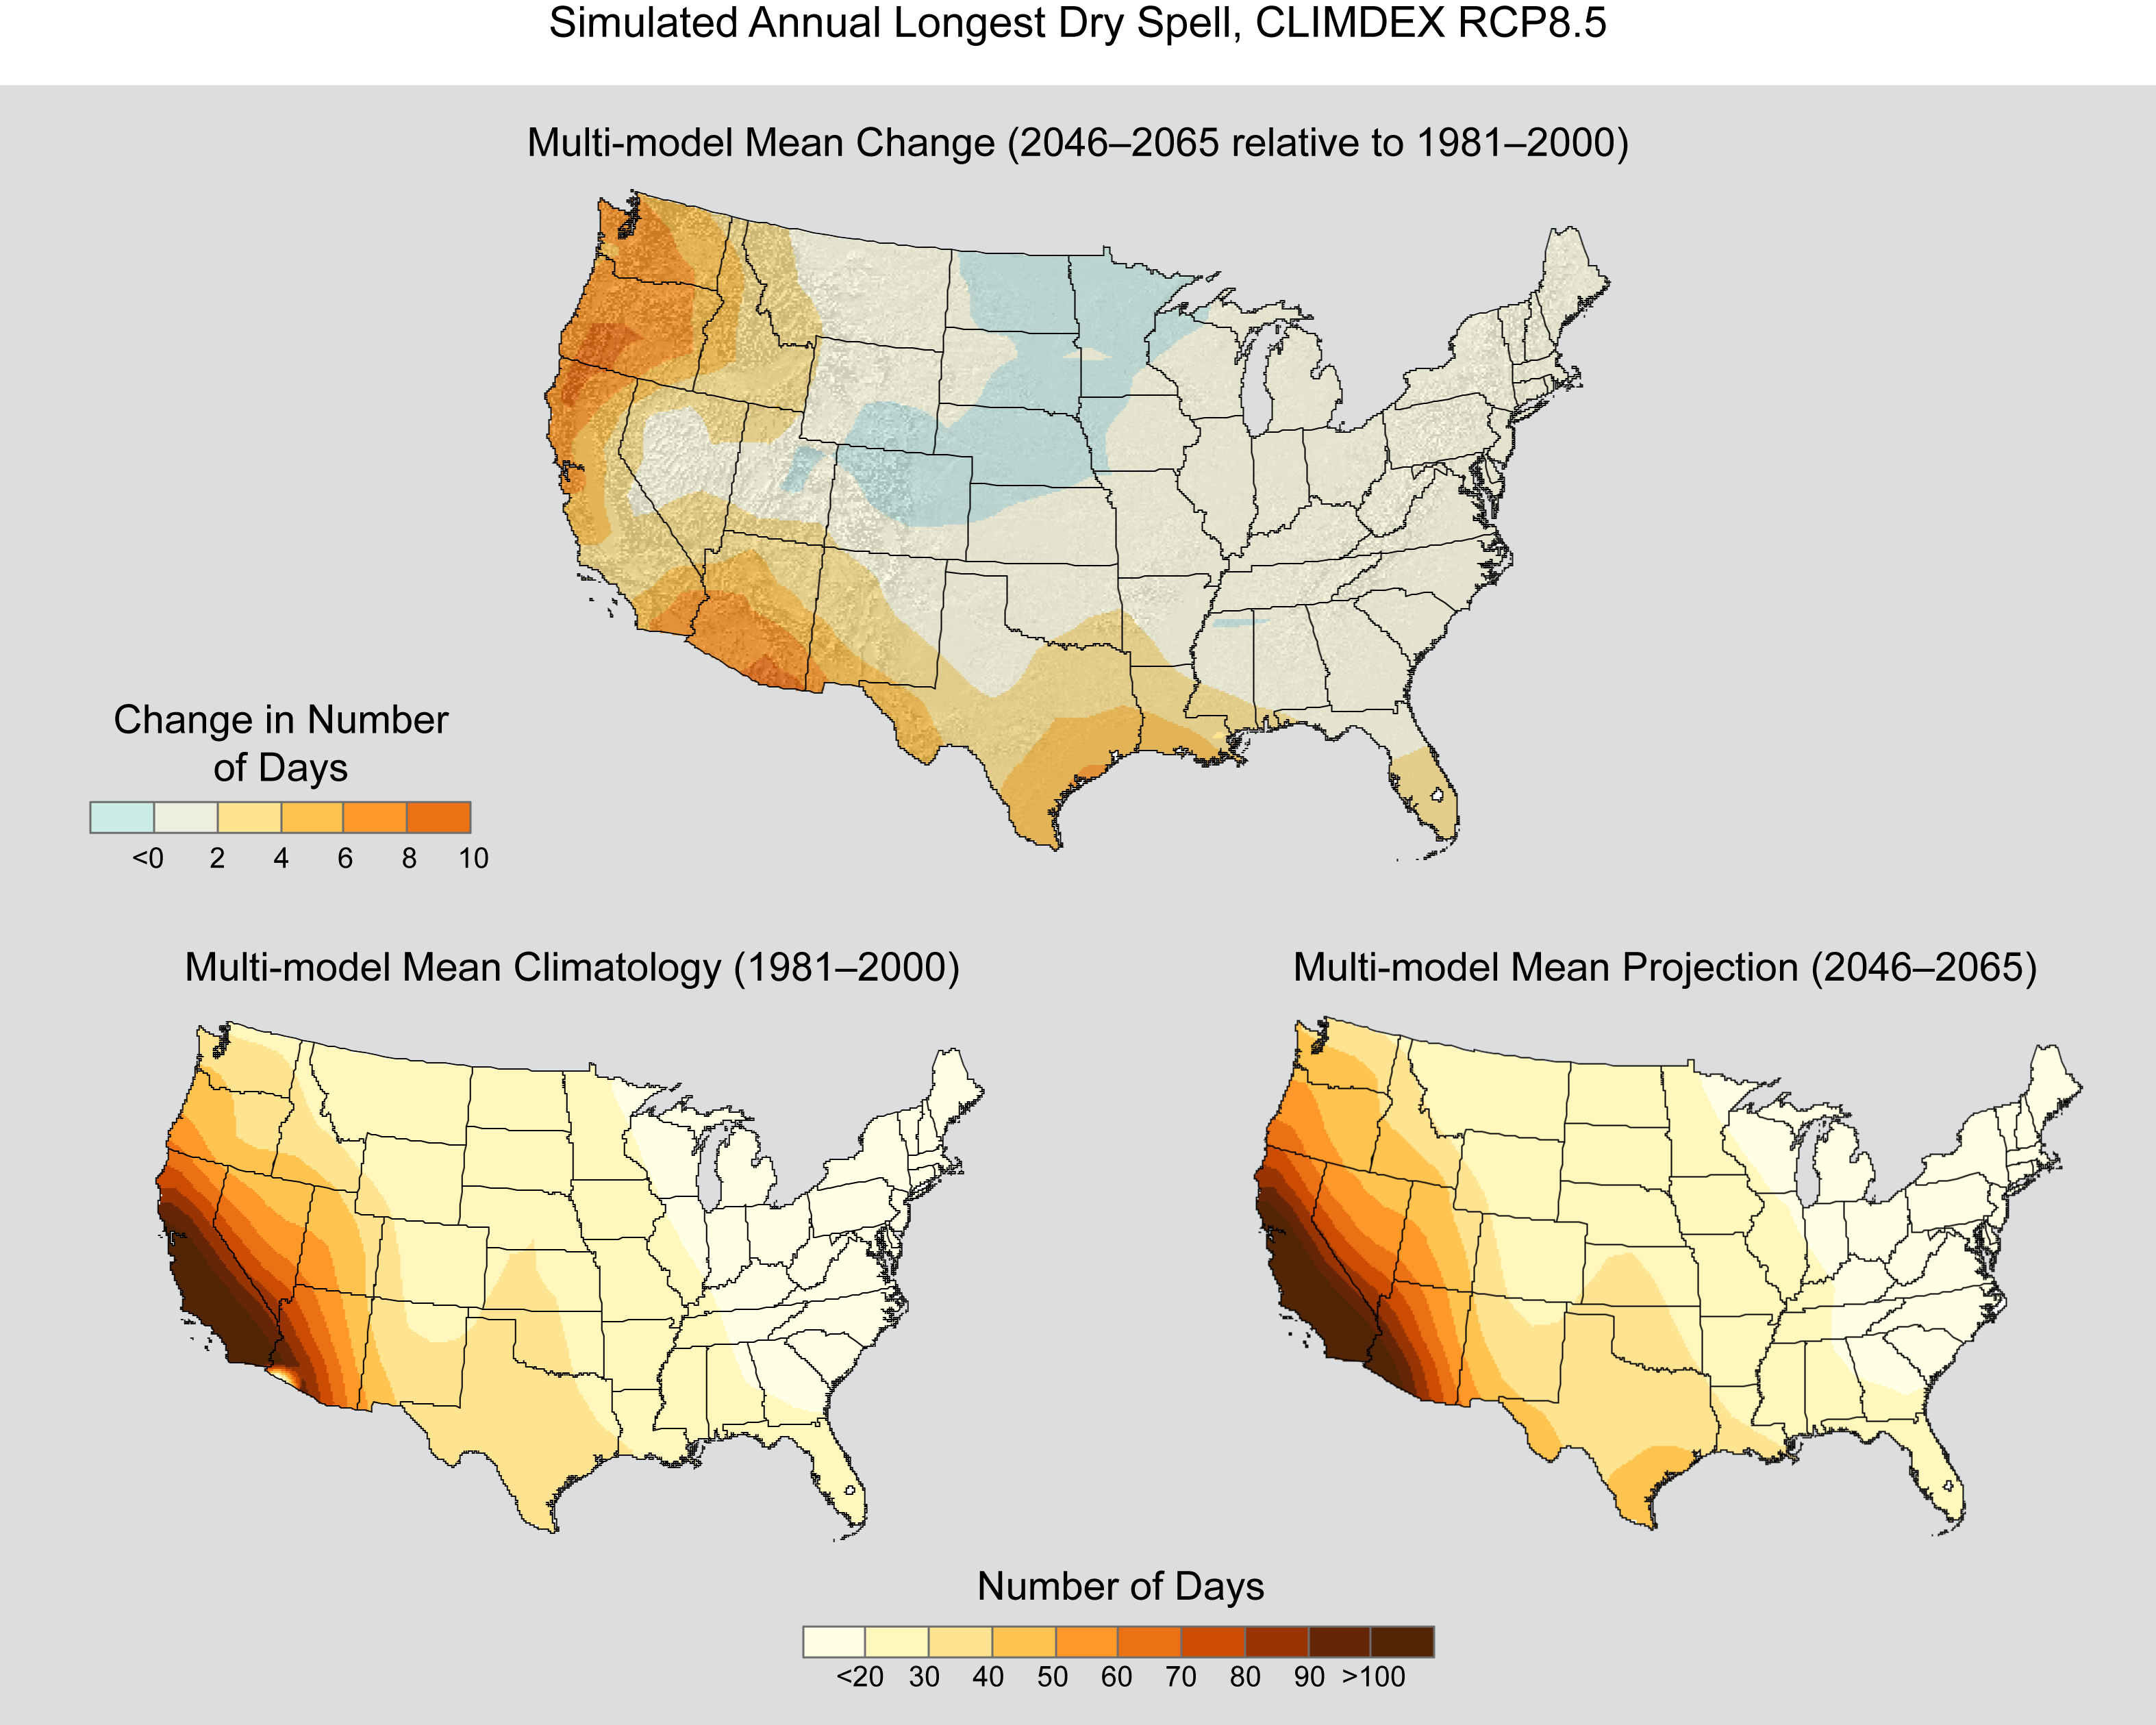
Simulated Annual Longest Dry Spell, CLIMDEX RCP8.5
Simulated multi-model mean change in the annual maximum number of consecutive dry days (CDD) for the contiguous United States, for 2046–2065 with respect to the reference period of 1981–2000, using the CLIMDEX RCP8.5 scenario (top). Color only (category 1) indicates that less than 50% of the models show a statistically significant change (see Section 3). Multi-model mean climatology indicating the annual number of CDD for 1981–2000 (bottom left). Multi-model mean projection indicating the annual number of CDD for 2046–2065 (bottom right).
Simulated Annual Maximum 5-day Precipitation, CLIMDEX RCP8.5
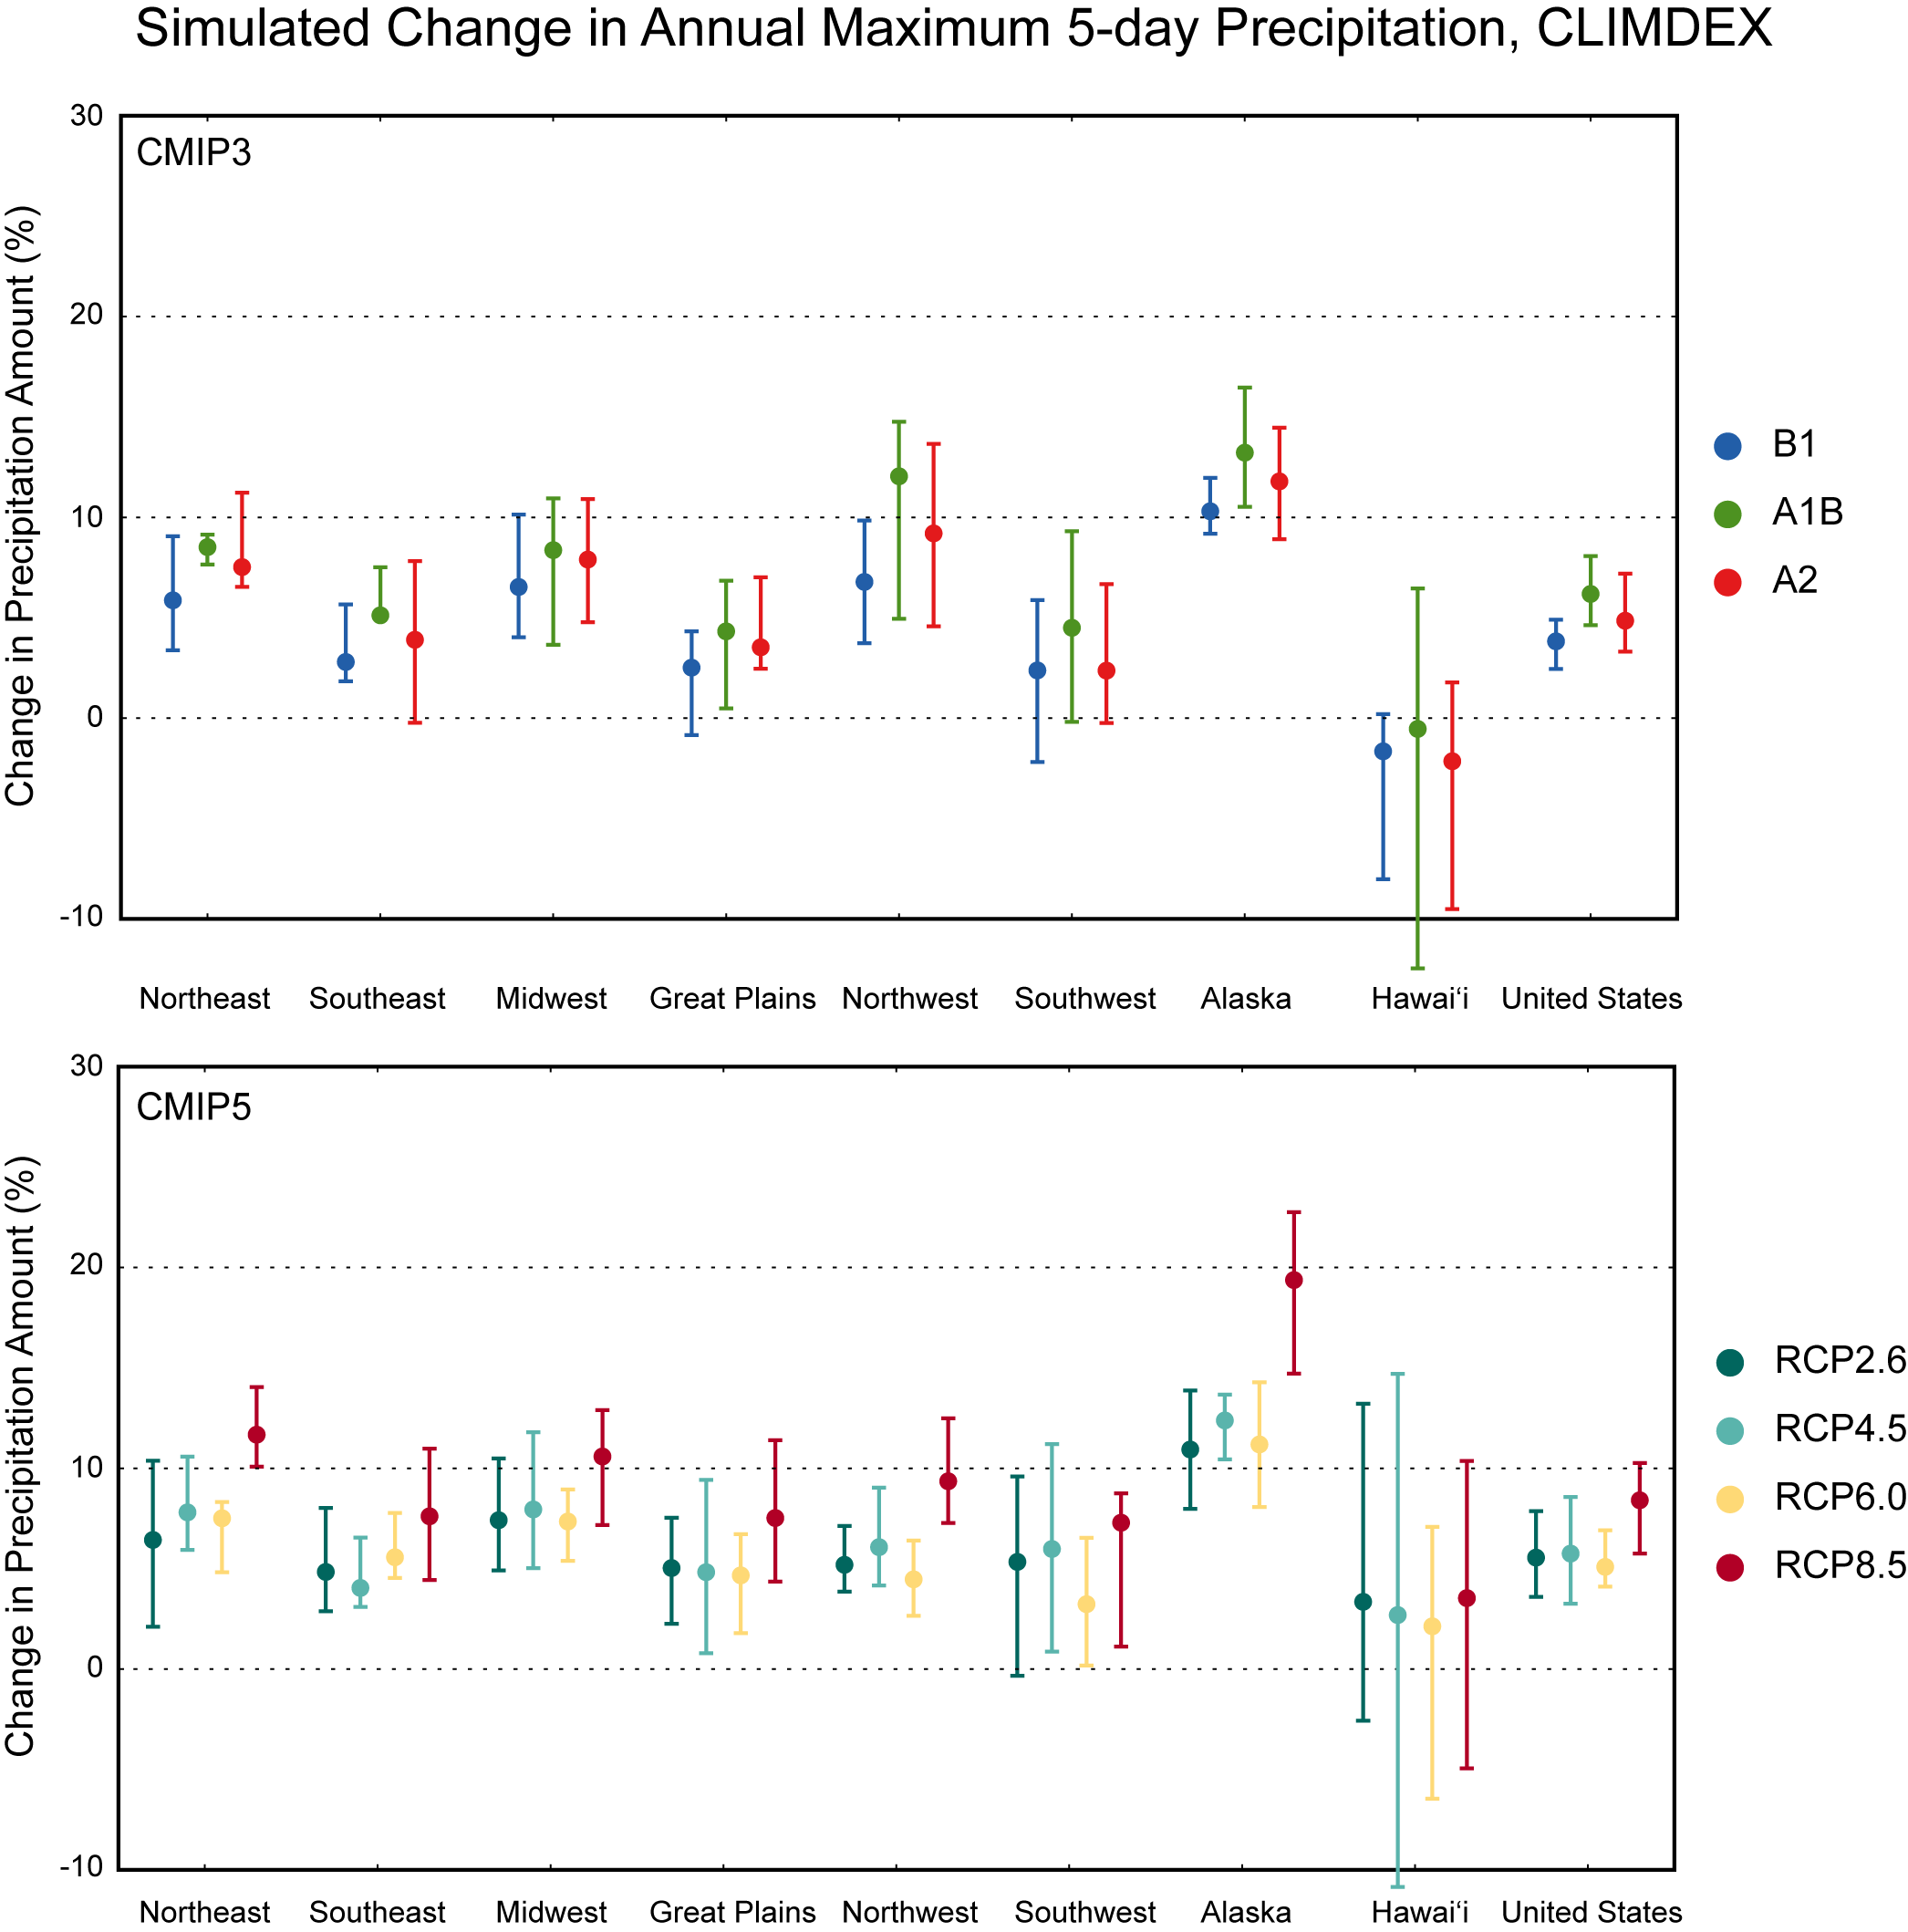
Simulated change in annual maximum 5-day precipitation (Rx5day) for each region and the contiguous United States, for 2046–2065 with respect to the reference period of 1981–2000. The upper panel shows values for the CLIMDEX SRES B1 (blue), A1B (green), and A2 (red) scenarios. The lower panel shows values for the CLIMDEX RCP2.6 (dark teal), 4.5 (light teal), 6.0 (yellow), and 8.5 (dark red) scenarios. Bars indicate the interquartile ranges of model values and circles depict the multi-model means.
Simulated Annual Maximum 5-day Precipitation, CLIMDEX RCP8.5 (Alaska and Hawaii)
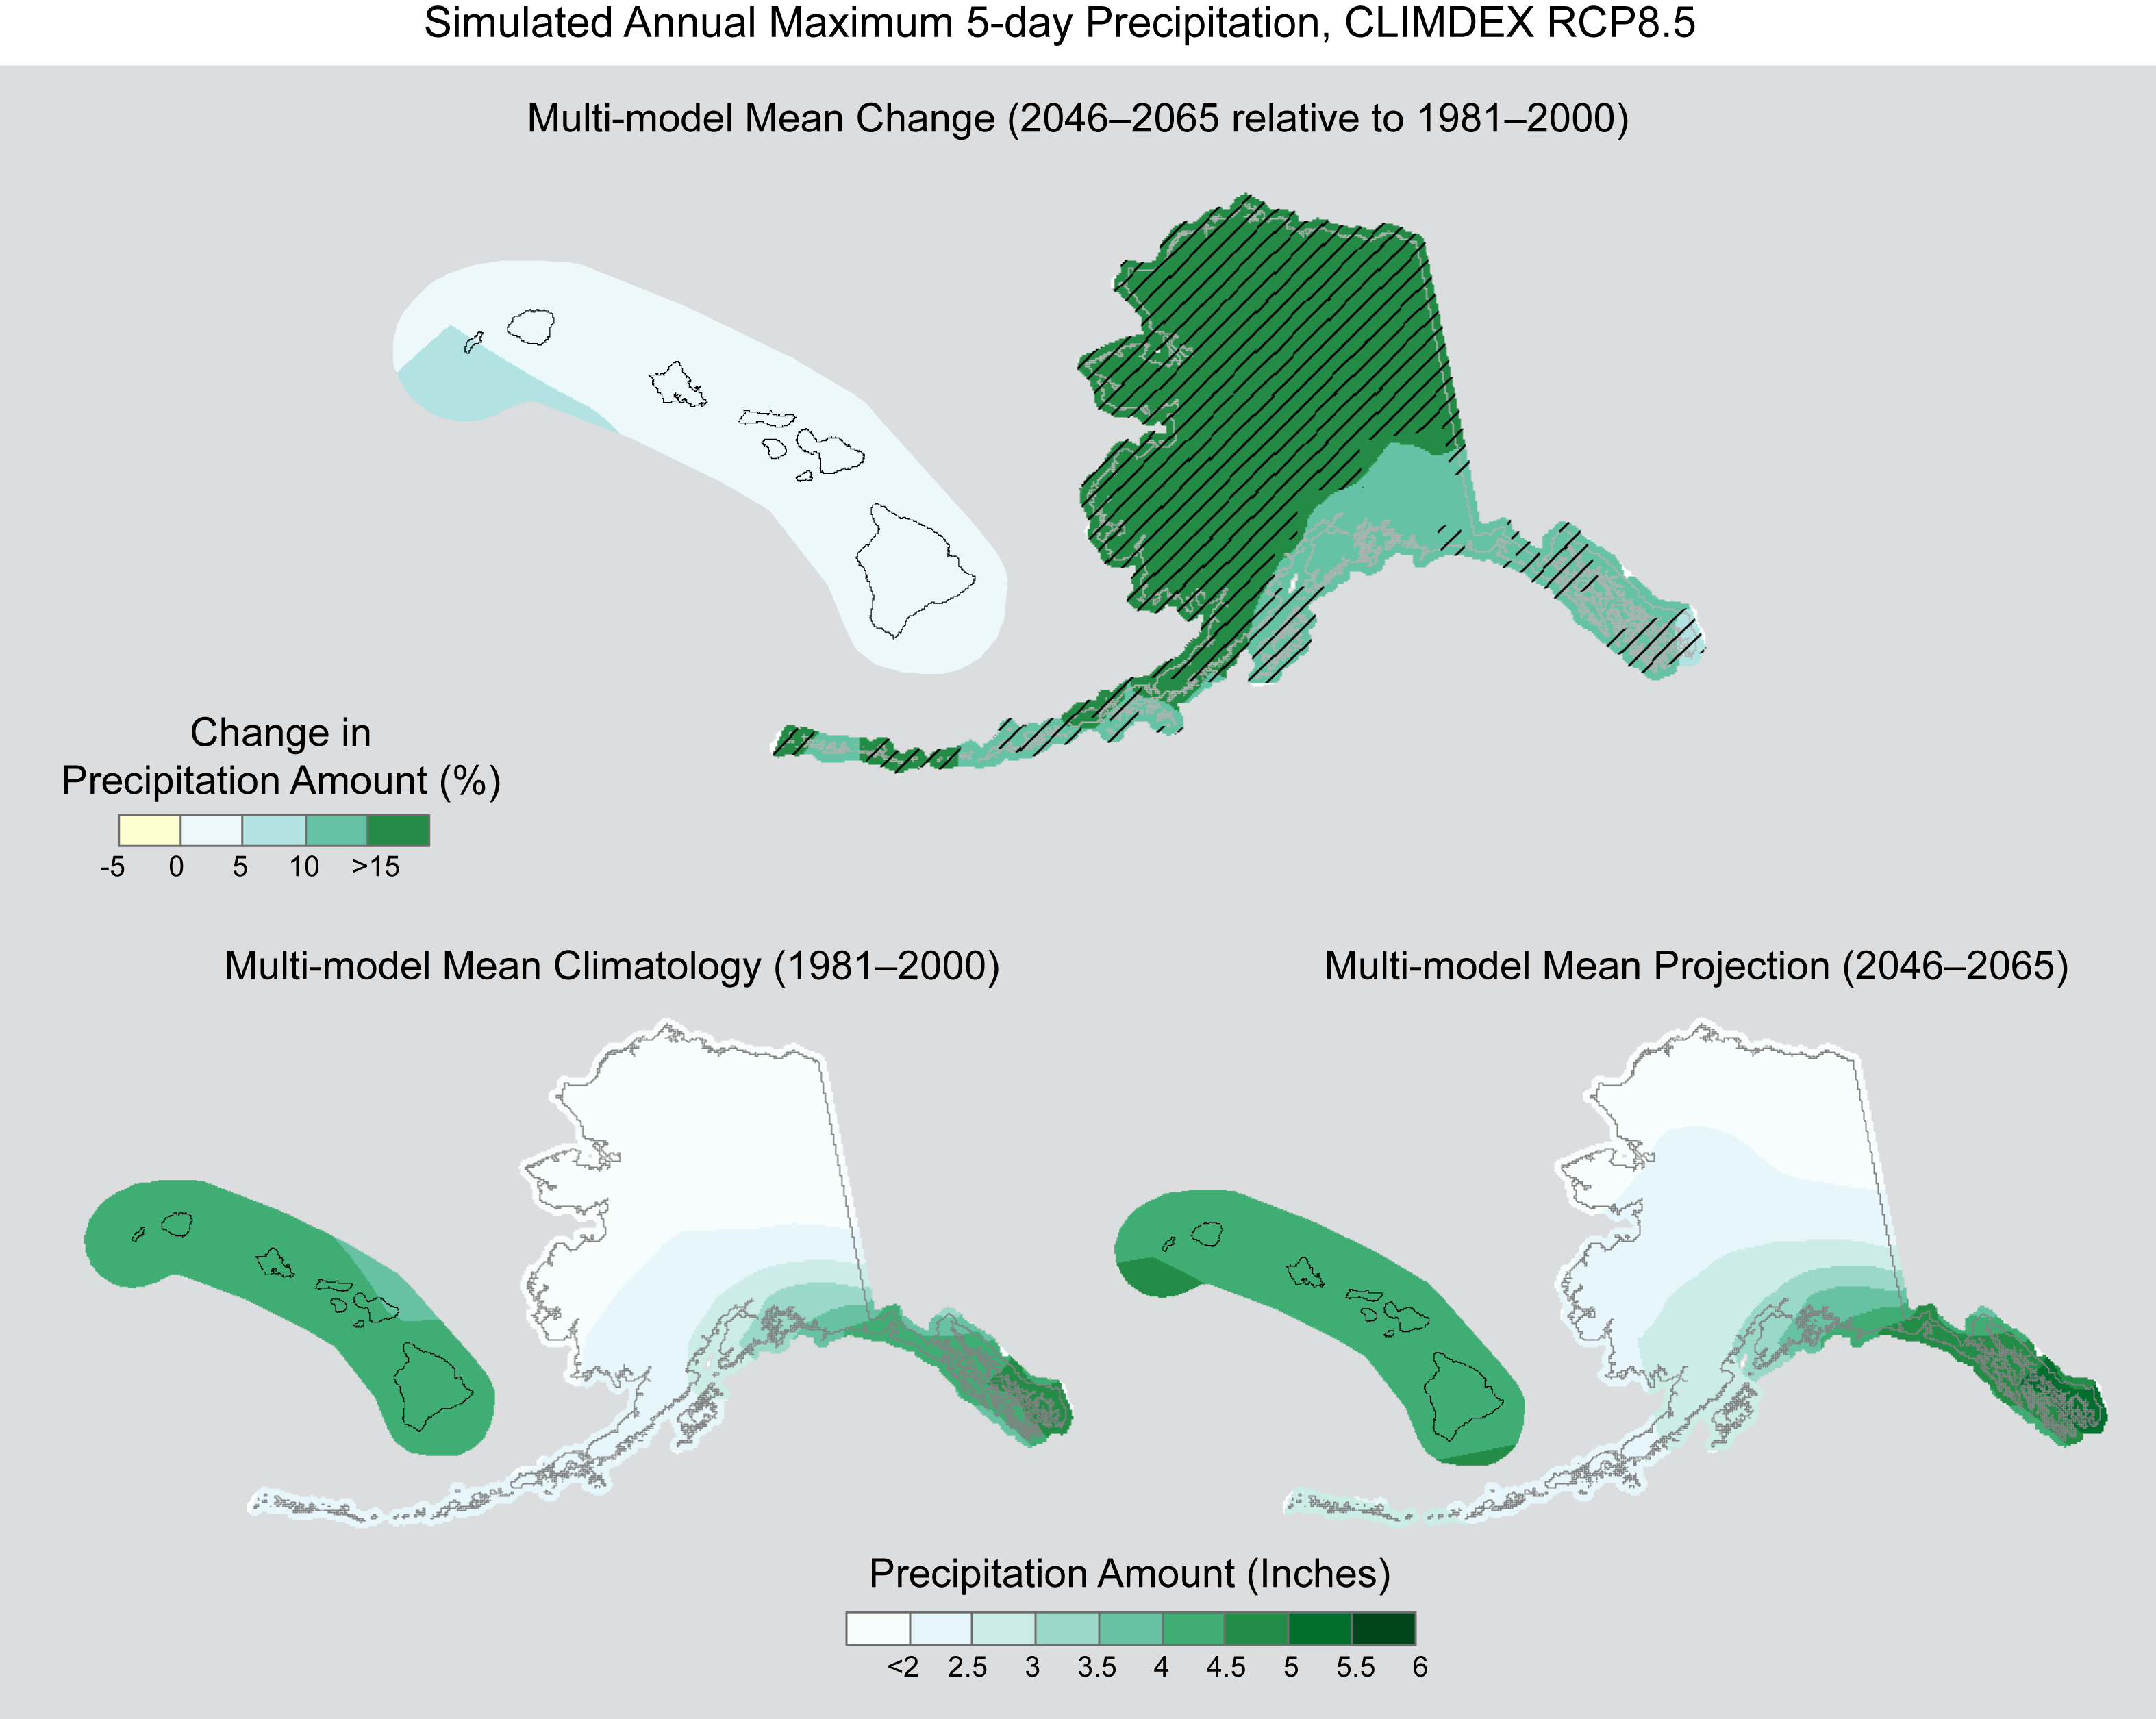
Simulated multi-model mean change in annual maximum 5-day precipitation (Rx5day) for Alaska and Hawai‘i, for 2046–2065 with respect to the reference period of 1971–2000, using the CLIMDEX RCP8.5 scenario (top). Color only (category 1) indicates that less than 50% of the models show a statistically significant change. Color with hatching (category 3) indicates that more than 50% of the models show a statistically significant change, and more than 67% agree on the sign of the change (see Section 3). Multi-model mean climatology indicating the Rx5day for 1981–2000 (bottom left). Multi-model mean projection indicating the Rx5day for 2046–2065 (bottom right).
Simulated Annual Maximum 5-day Precipitation, CLIMDEX RCP8.5
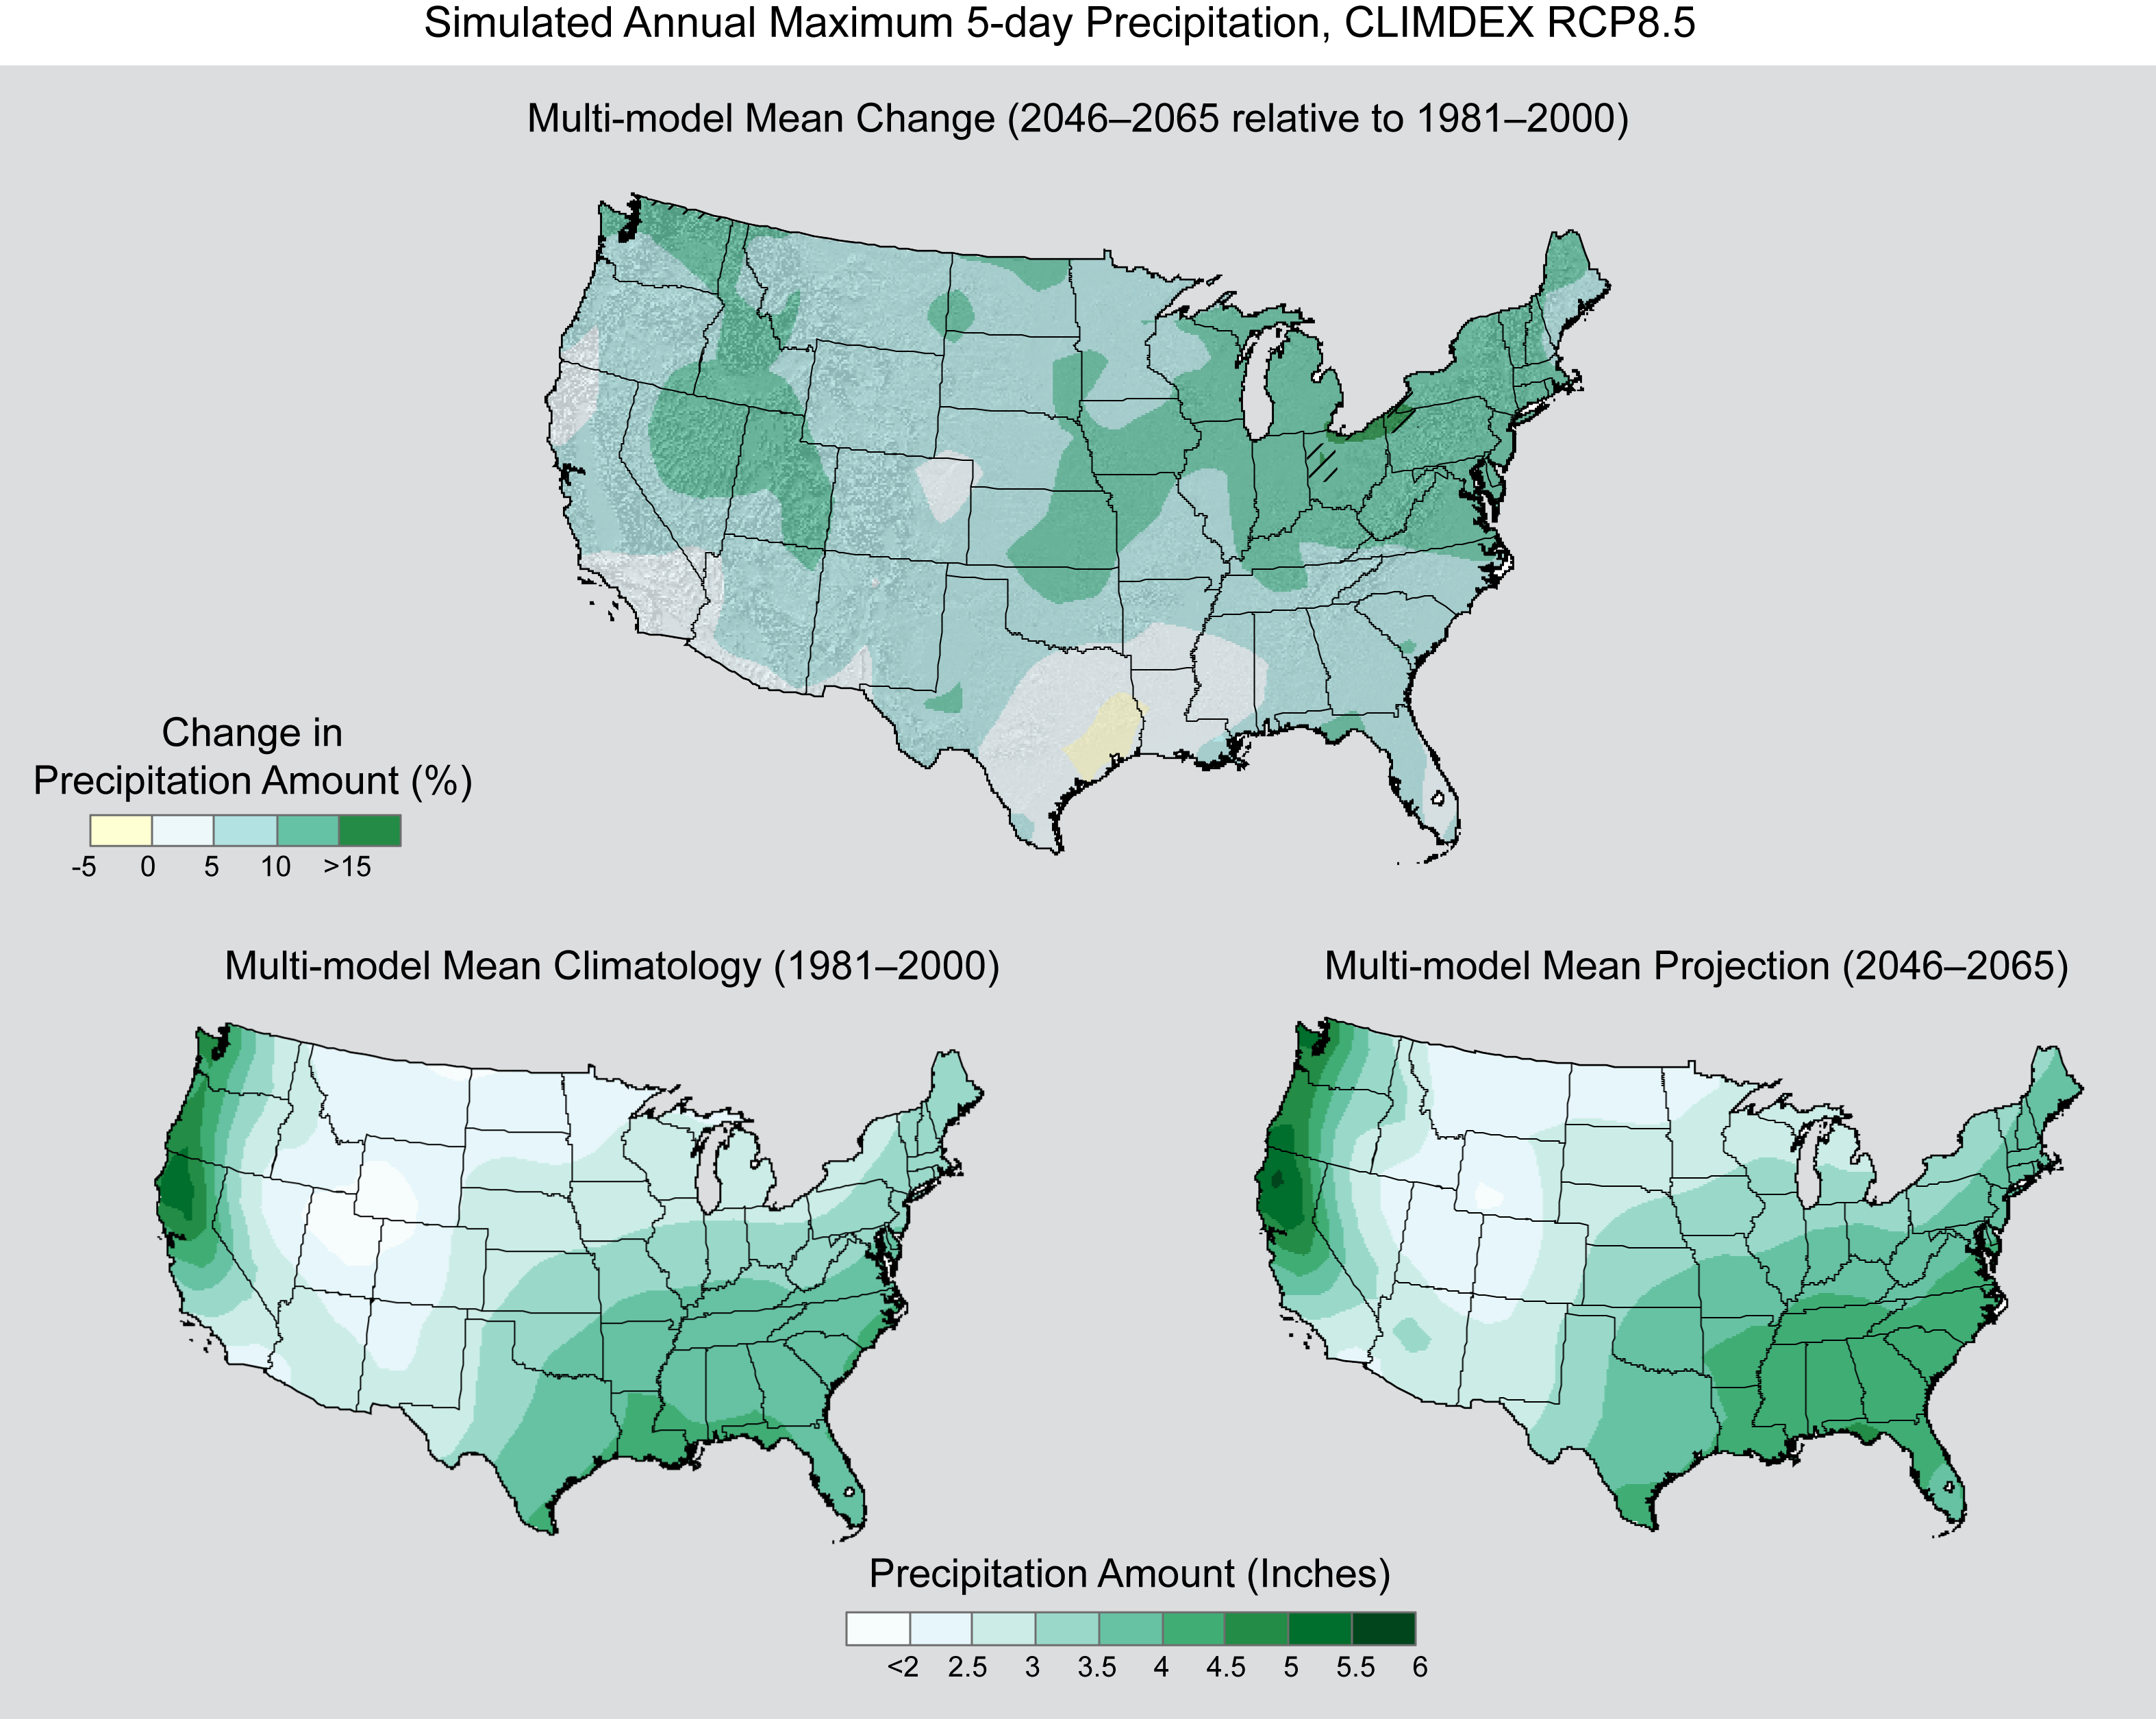
Simulated multi-model mean change in annual maximum 5-day precipitation (Rx5day) for the contiguous United States, for 2046–2065 with respect to the reference period of 1971–2000, using the CLIMDEX RCP8.5 scenario (top). Color only (category 1) indicates that less than 50% of the models show a statistically significant change. Color with hatching (category 3) indicates that more than 50% of the models show a statistically significant change, and more than 67% agree on the sign of the change (see Section 3). Multi-model mean climatology indicating the Rx5day for 1981–2000 (bottom left). Multi-model mean projection indicating the Rx5day for 2046–2065 (bottom right).

Simulated Annual Maximum 1-day Precipitation, CLIMDEX RCP8.5
Simulated change in annual maximum 1-day precipitation (Rx1day) for each region and the contiguous United States, for 2046–2065 with respect to the reference period of 1981–2000. The upper panel shows values for the CLIMDEX SRES B1 (blue), A1B (green), and A2 (red) scenarios. The lower panel shows values for the CLIMDEX RCP2.6 (dark teal), 4.5 (light teal), 6.0 (yellow), and 8.5 (dark red) scenarios. Bars indicate the interquartile ranges of model values and circles depict the multi-model means.

Simulated Annual Maximum 1-day Precipitation, CLIMDEX RCP8.5 (Alaska and Hawaii)
Simulated multi-model mean change in annual maximum 1-day precipitation (Rx1day) for Alaska and Hawai‘i, for 2046–2065 with respect to the reference period of 1981–2000, using the CLIMDEX RCP8.5 scenario (top). Color only (category 1) indicates that less than 50% of the models show a statistically significant change. Color with hatching (category 3) indicates that more than 50% of the models show a statistically significant change, and more than 67% agree on the sign of the change (see Section 3). Multi-model mean climatology indicating the Rx1day for 1981–2000 (bottom left). Multi-model mean projection indicating the Rx1day for 2046–2065 (bottom right).
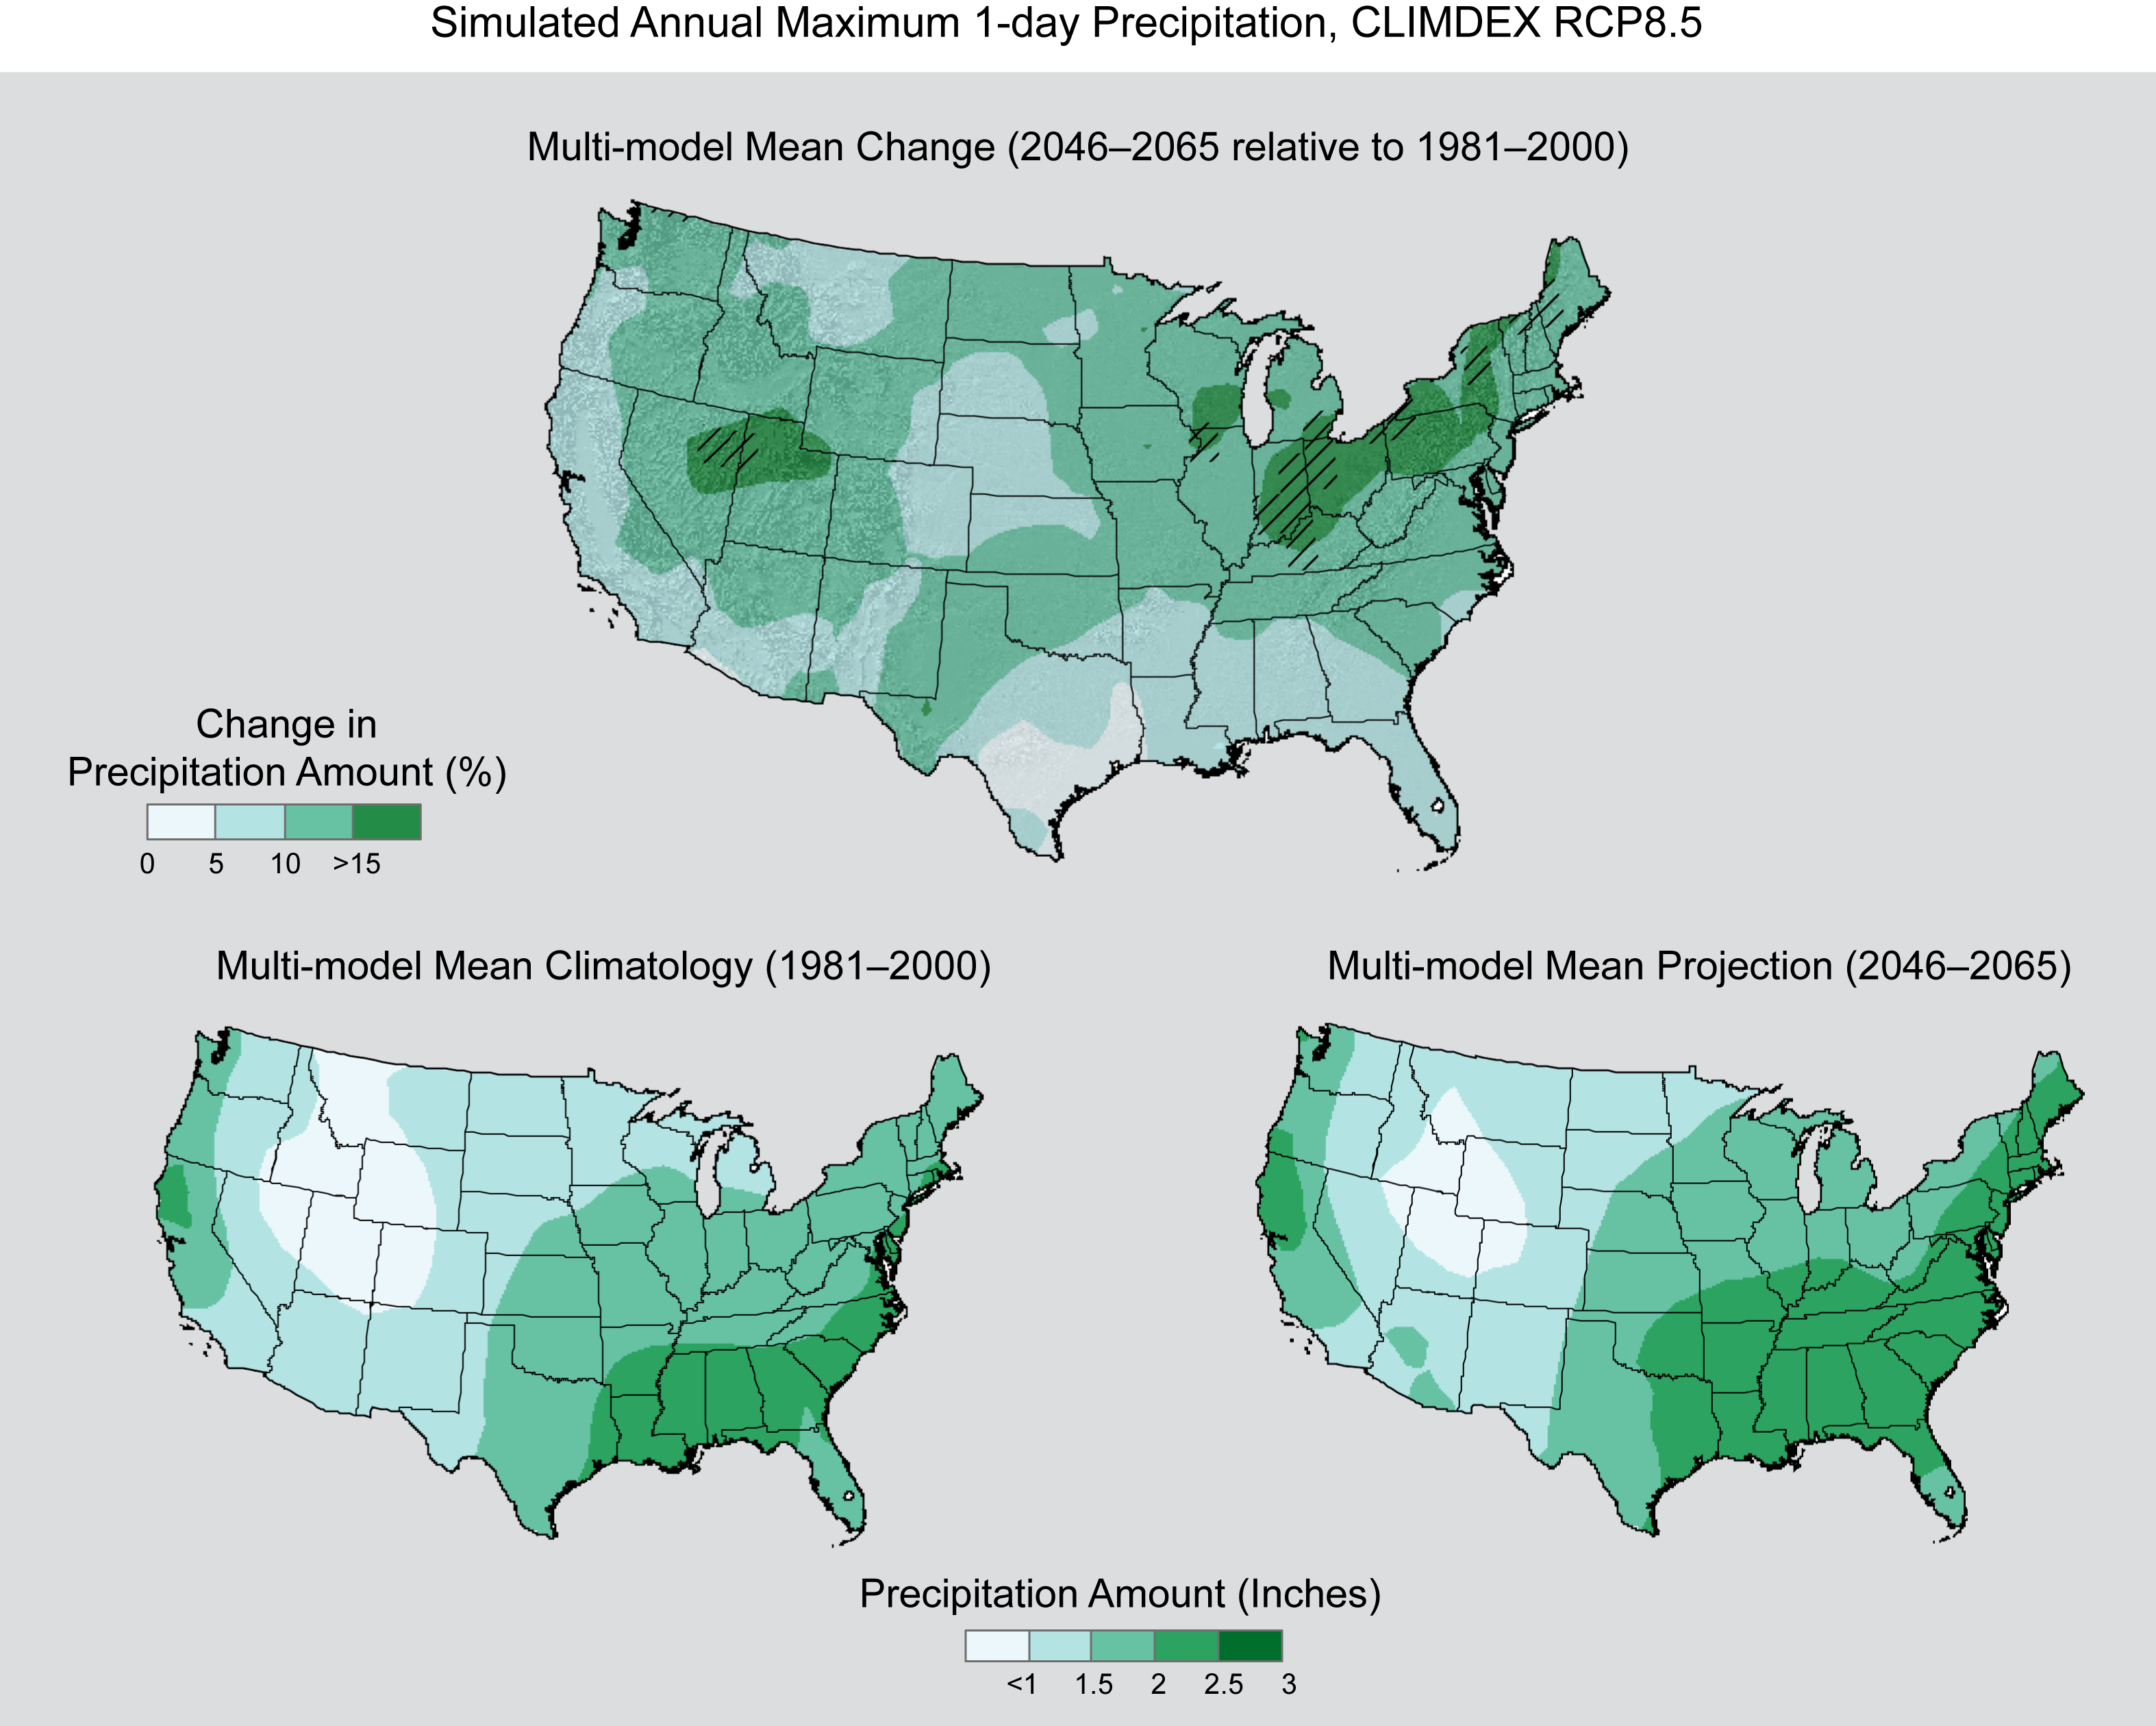
Simulated Annual Maximum 1-day Precipitation, CLIMDEX RCP8.5
Simulated multi-model mean change in annual maximum 1-day precipitation (Rx1day) for the contiguous United States, for 2046–2065 with respect to the reference period of 1981–2000, using the CLIMDEX RCP8.5 scenario (top). Color only (category 1) indicates that less than 50% of the models show a statistically significant change. Color with hatching (category 3) indicates that more than 50% of the models show a statistically significant change, and more than 67% agree on the sign of the change (see Section 3). Multi-model mean climatology indicating the Rx1day for 1981–2000 (bottom left). Multi-model mean projection indicating the Rx1day for 2046–2065 (bottom right).
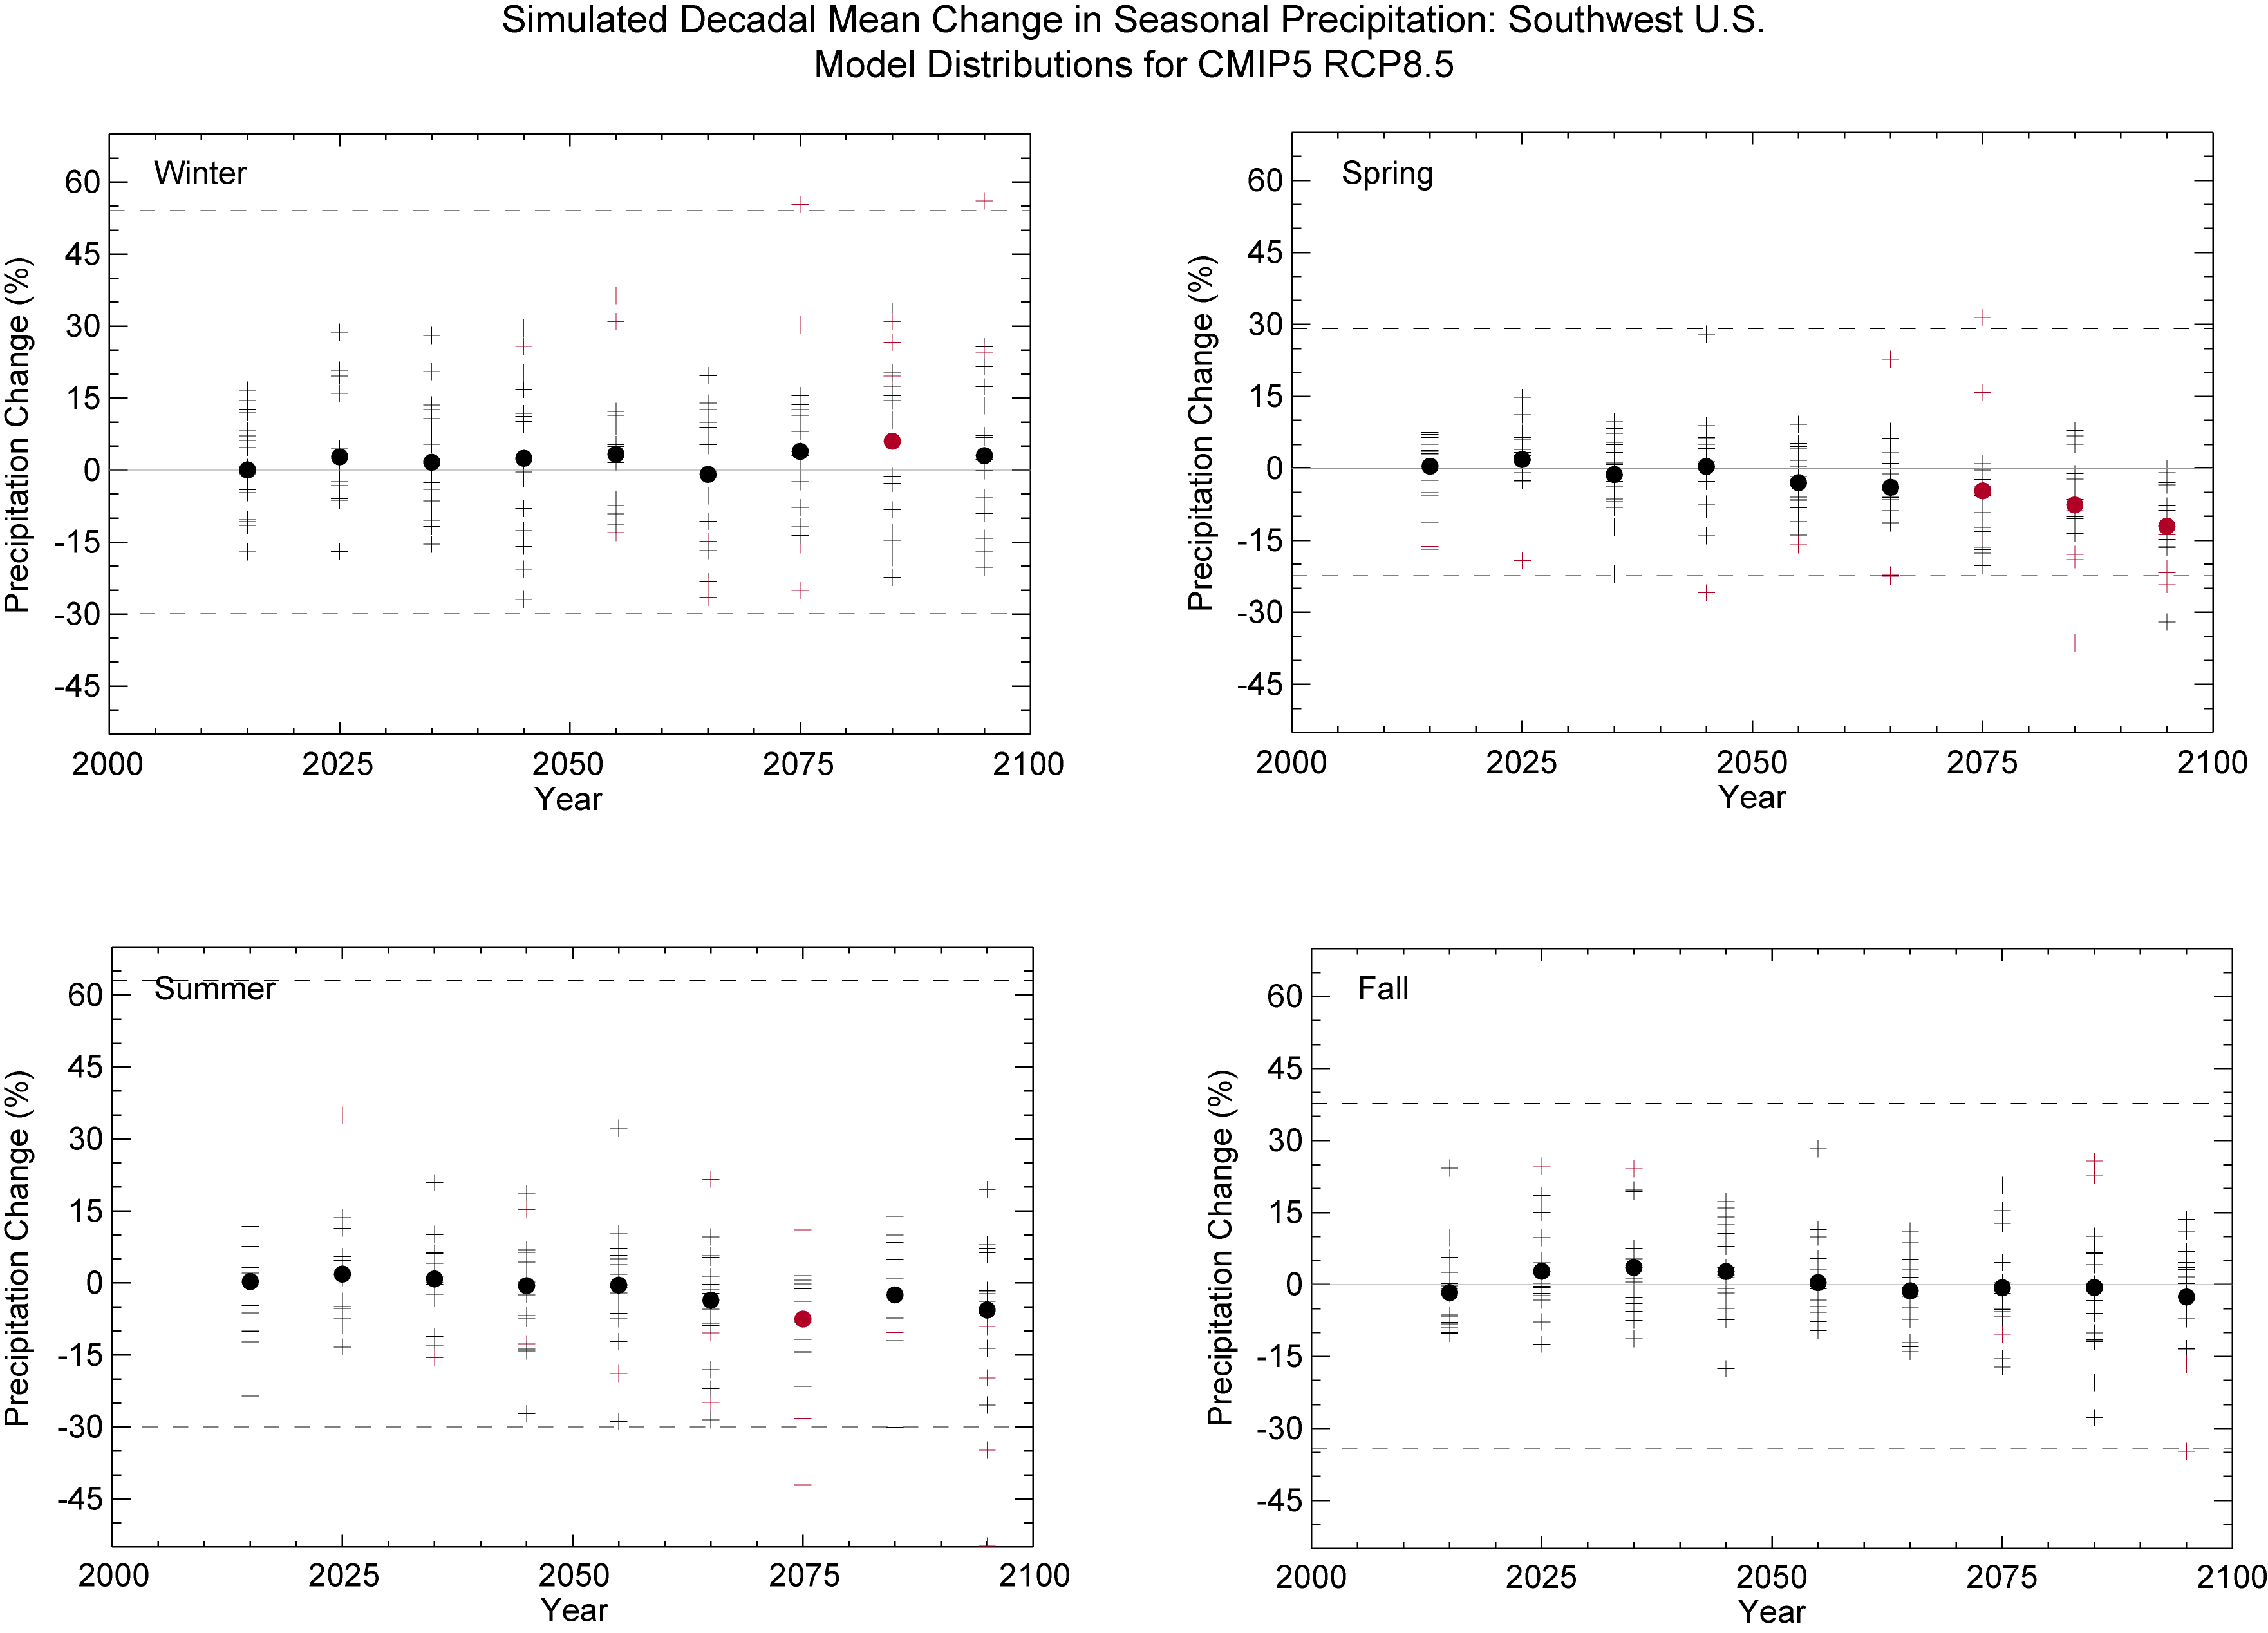
Simulated Decadal Mean Change in Seasonal Precipitation: Southwest U.S.
Model Distributions for CMIP5 RCP8.5
Model distributions of simulated decadal mean change in seasonal precipitation (%) for the Southwest United States, for each future decadal time period (represented by their approximate midpoints, e.g., 2015 = 2011–2020), with respect to the reference period of 2001–2010. Values are given for each of the CMIP5 RCP scenario. Each individual model is represented by a plus sign (+), with circles depicting the multi-model means. These symbols are shown in color if the value is statistically significant at the 95% confidence level. Dashed lines indicate the 10th and 90th percentiles of observed precipitation anomaly values from 1981–2010.

Simulated Decadal Mean Change in Seasonal Precipitation: Southwest U.S. Model Distributions for CMIP3 SRES A2
Model distributions of simulated decadal mean change in seasonal precipitation (%) for the Southwest United States, for each future decadal time period (represented by their approximate midpoints, e.g., 2015 = 2011–2020), with respect to the reference period of 2001–2010. Values are given for each of the CMIP3 SRES A2 emissions scenario. Each individual model is represented by a plus sign (+), with circles depicting the multi-model means. These symbols are shown in color if the value is statistically significant at the 95% confidence level. Dashed lines indicate the 10th and 90th percentiles of observed precipitation anomaly values from 1981–2010.
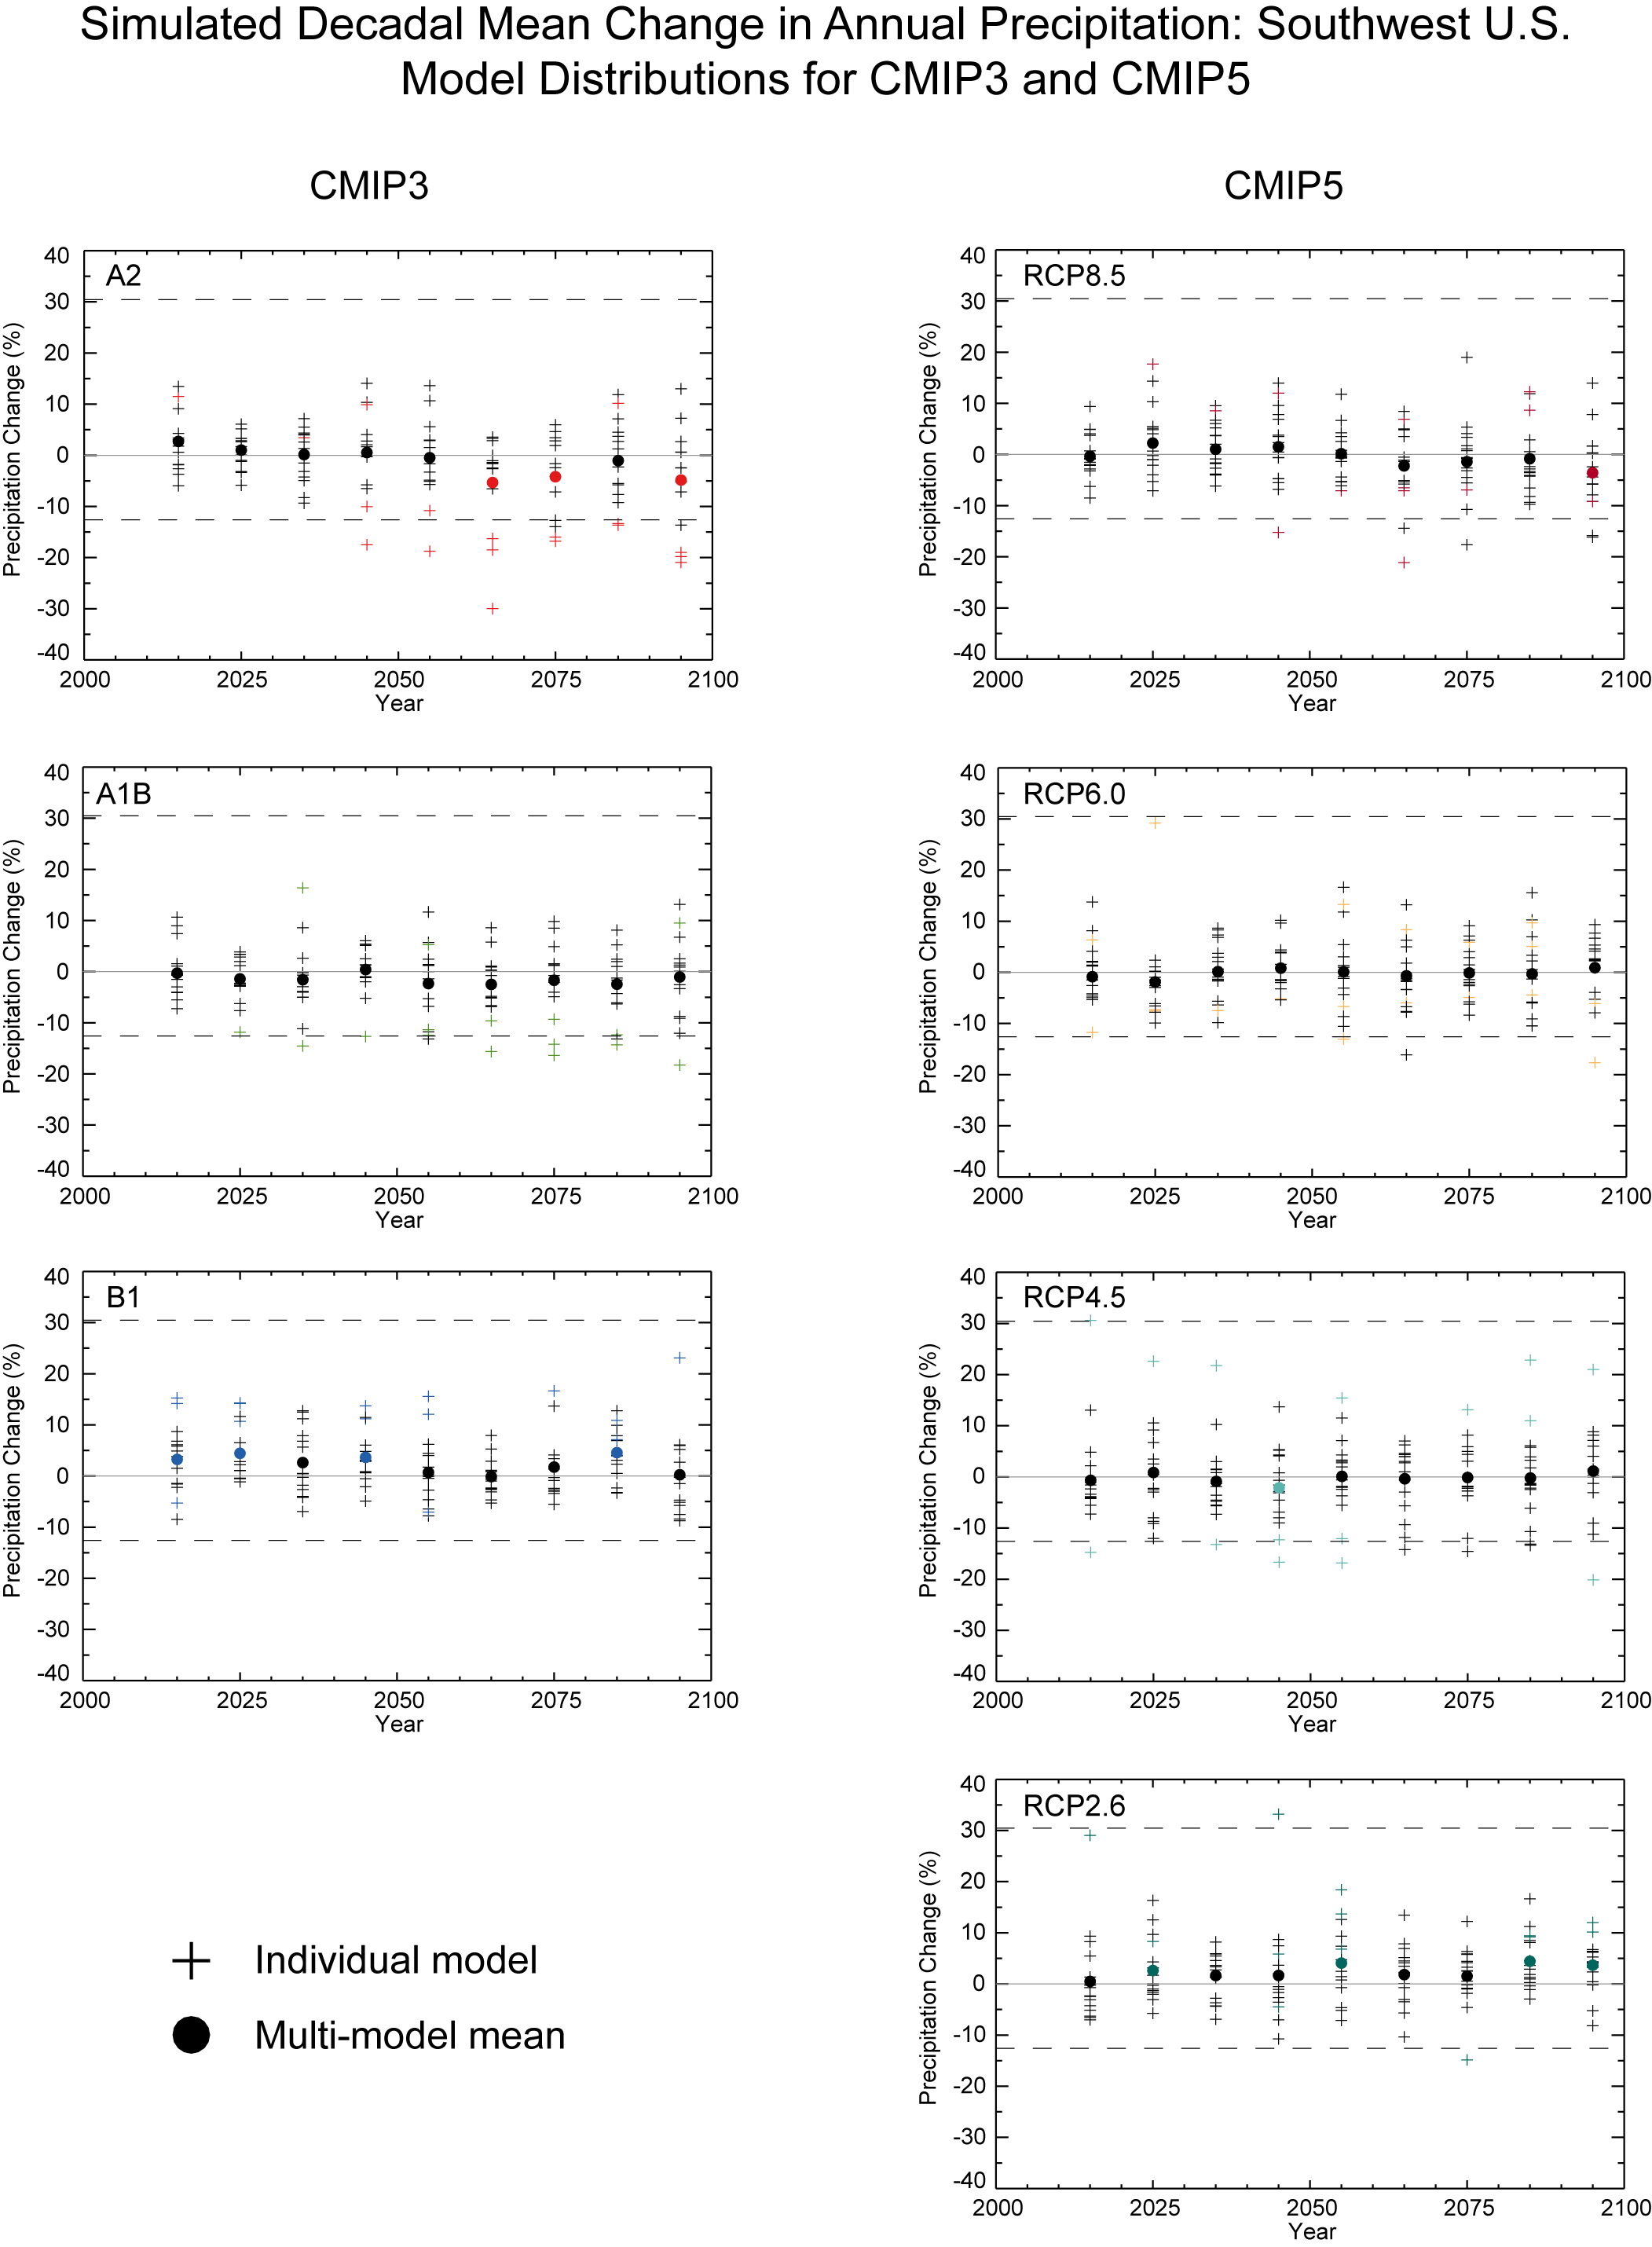
Simulated Decadal Mean Change in Annual Precipitation: Southwest U.S. Model Distributions for CMIP3 and CMIP5
Model distributions of simulated decadal mean change in annual precipitation (%) for the Southwest United States, for each future decadal time period (represented by their approximate midpoints, e.g., 2015 = 2011–2020), with respect to the reference period of 2001–2010. The upper panel shows values for the CMIP3 SRES B1 (blue), A1B (green), and A2 (red) scenarios. The lower panel shows values for the CMIP5 RCP2.6 (light teal), 4.5 (dark teal), 6.0 (yellow), and 8.5 (dark red) scenarios. Each individual model is represented by a plus sign (+), with circles depicting the multi-model means. These symbols are shown in color if the value is statistically significant at the 95% confidence level. Dashed lines indicate the 10th and 90th percentiles of observed precipitation anomaly values from 1981–2010.
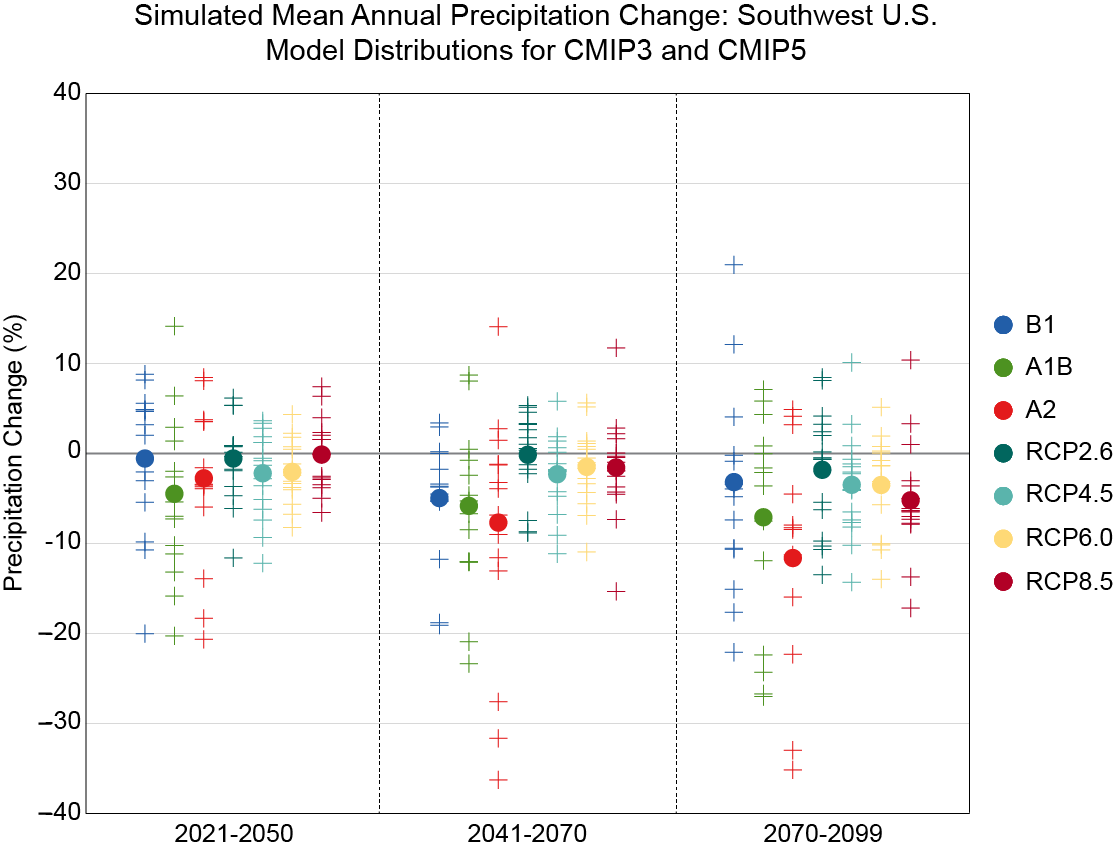
Simulated Mean Annual Precipitation Change: Southwest U.S.; Model Distributions for CMIP3 and CMIP5
Model distributions of simulated mean annual precipitation change (%) for the southwest United States, for each future time period (2021–2050, 2041–2070, and 2070–2099) with respect to the reference period of 1971–2000 for each CMIP3 and CMIP5 scenario. The small plus signs (+) indicate each individual model and the circles depict the multi-model means.
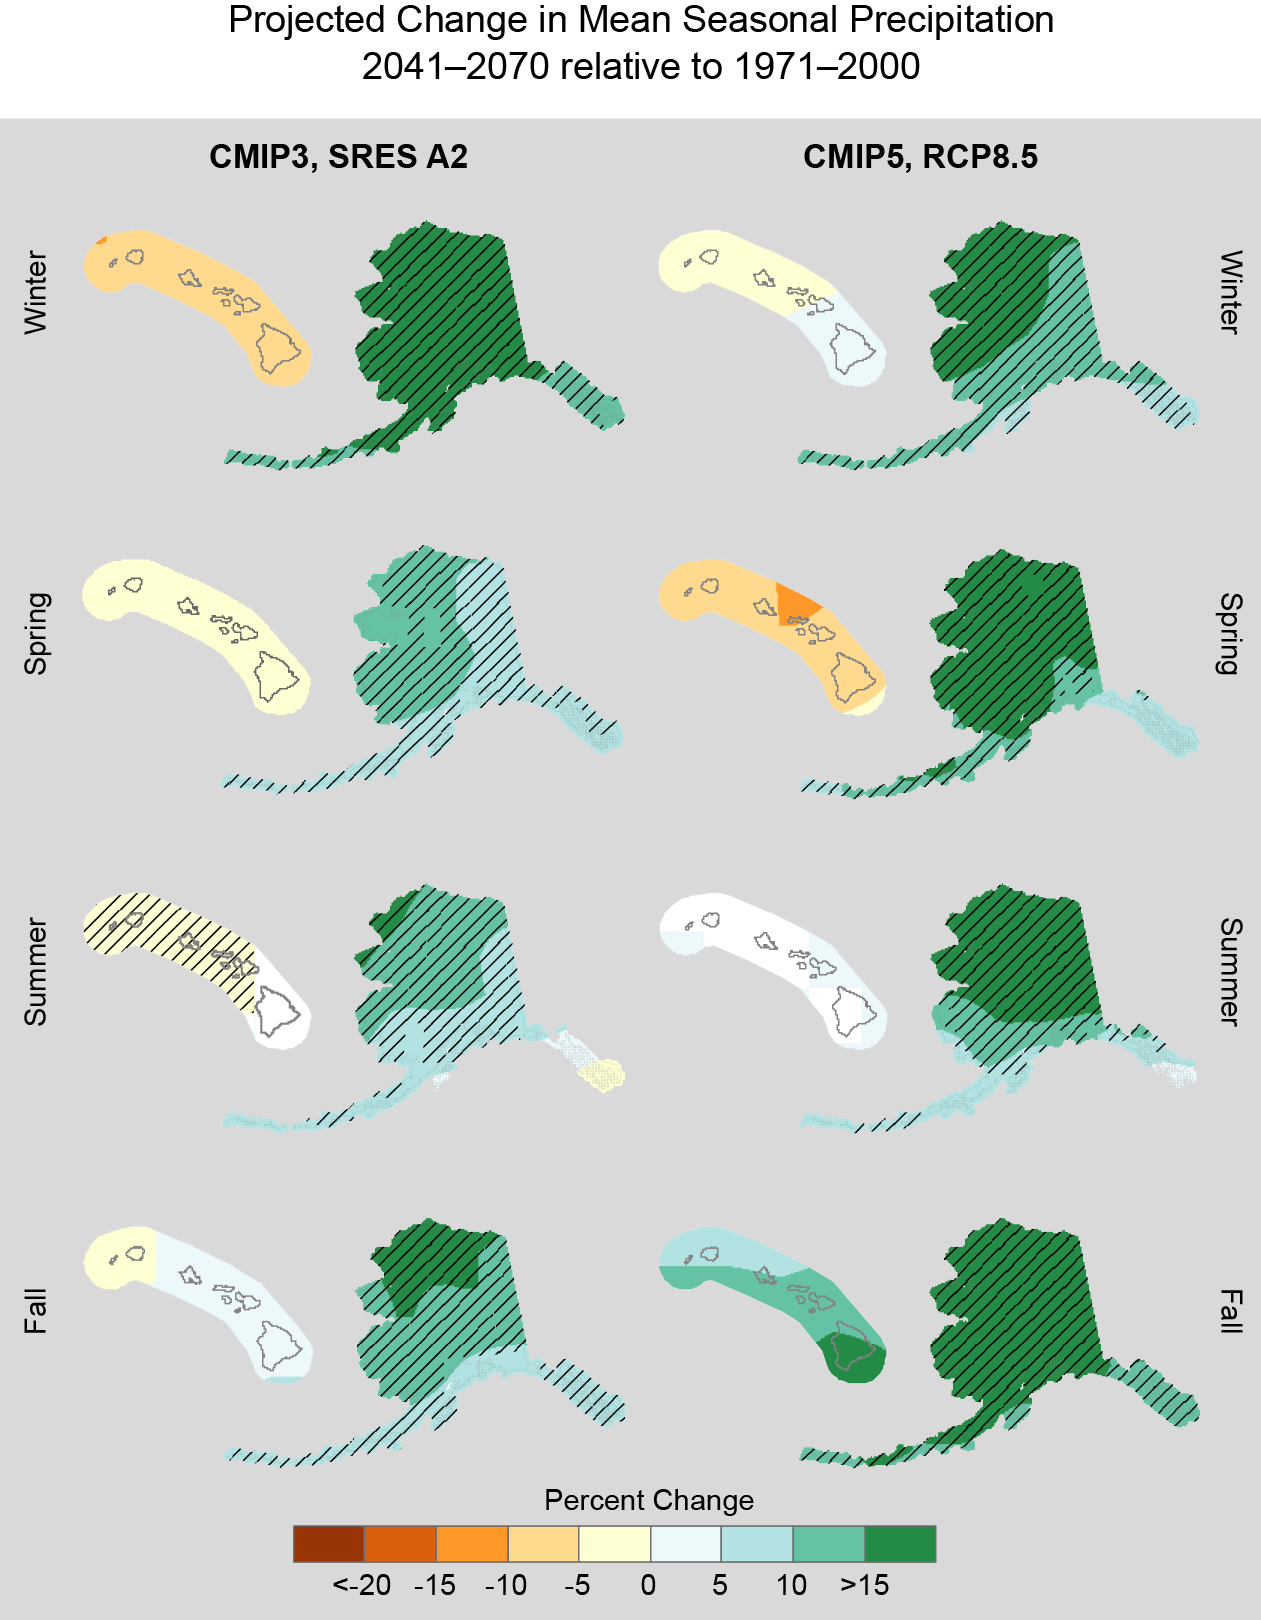
Projected Change in Mean Seasonal Precipitation; 2041-2070 relative to 1971-2000 (Alaska and Hawaii
Projected change in mean seasonal precipitation (%) for Alaska and Hawai‘i, for 2041–2070 with respect to the reference period of 1971–2000. These are multi-model means using CMIP3 SRES A2 (left column), and CMIP5 RCP8.5 (right column). Color only (category 1) indicates that less than 50% of the models show a statistically significant change. Whited out areas (category 2) indicate that more than 50% of the models show a statistically significant change, but less than 67% agree of the sign of the change. Color with hatching (category 3) indicates that more than 50% of the models show a statistically significant change, and more than 67% agree on the sign of the change (see Section 3).
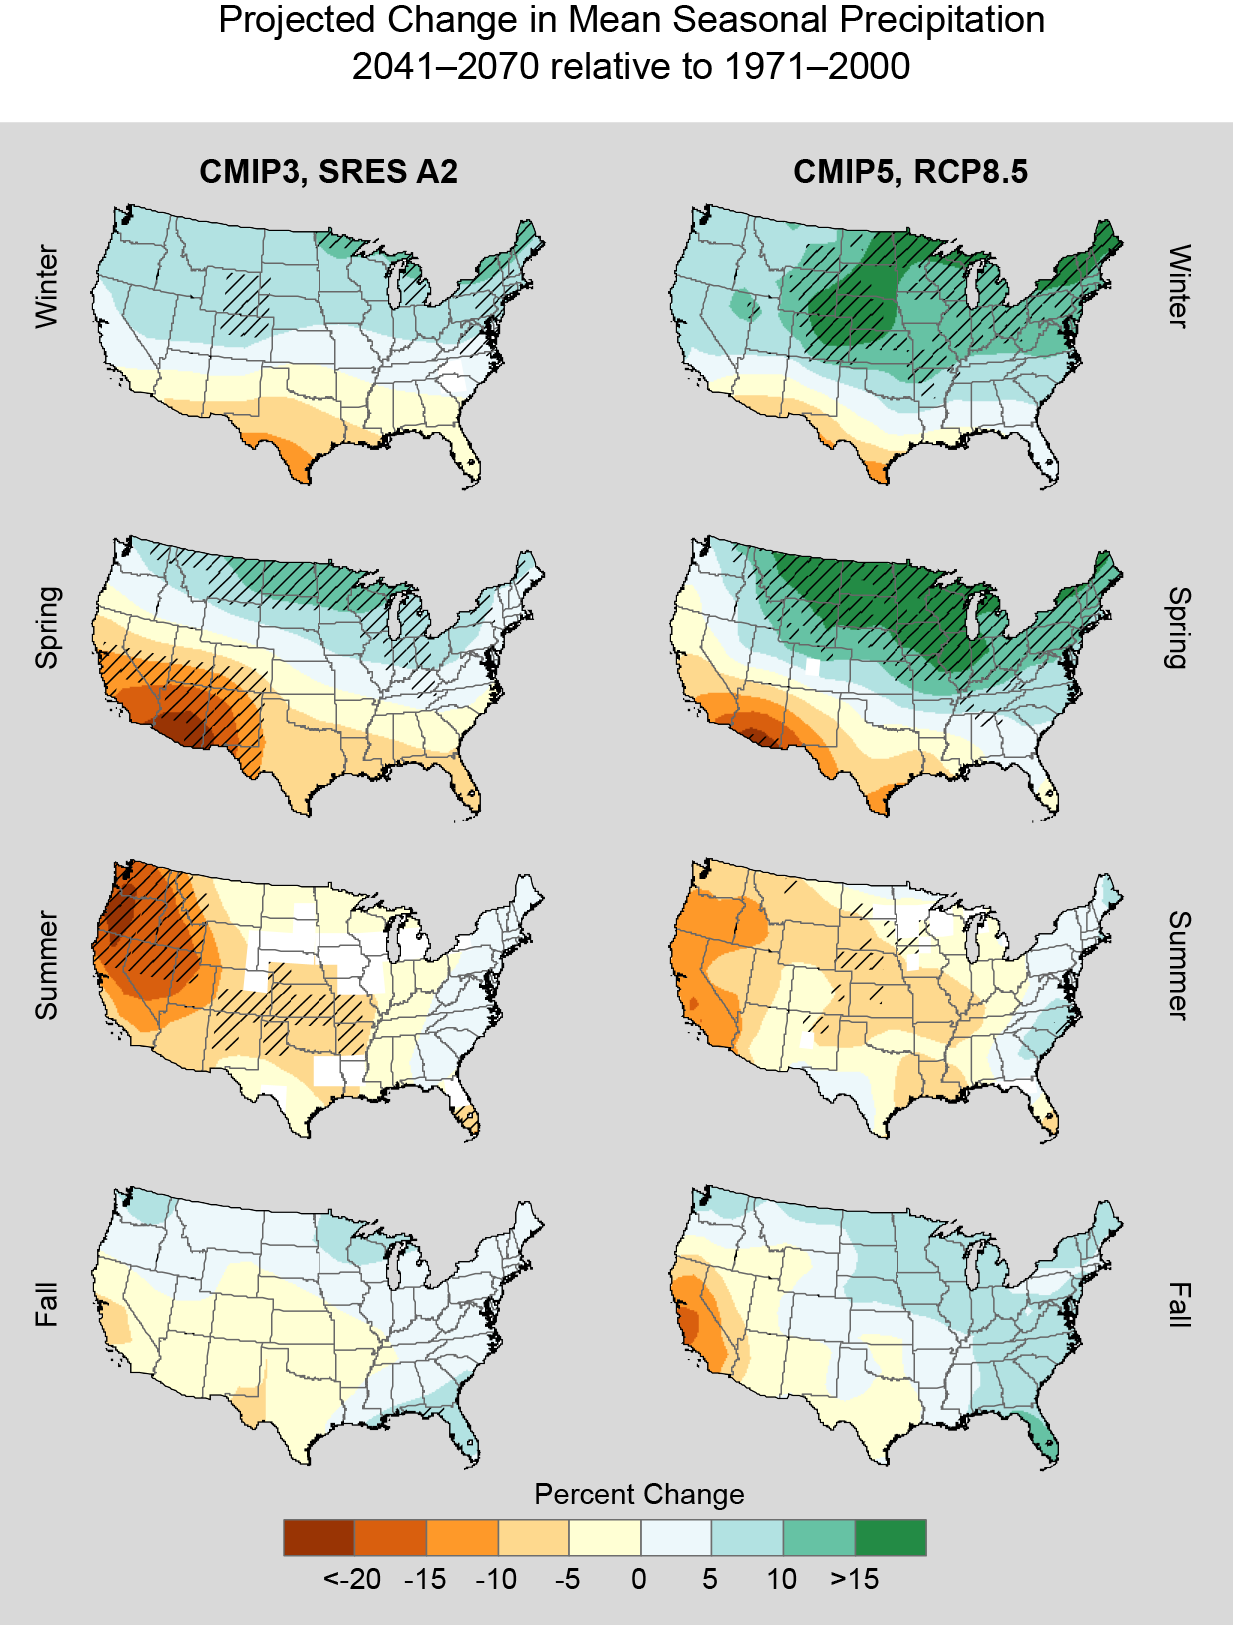
Projected Change in Mean Seasonal Precipitation; 2041-2070 relative to 1971-2000
Projected change in mean seasonal precipitation (%) for the contiguous United States, for 2041–2070 with respect to the reference period of 1971–2000. These are multi-model means using CMIP3 SRES A2 (left column), and CMIP5 RCP8.5 (right column). Color only (category 1) indicates that less than 50% of the models show a statistically significant change. Whited out areas (category 2) indicate that more than 50% of the models show a statistically significant change, but less than 67% agree of the sign of the change. Color with hatching (category 3) indicates that more than 50% of the models show a statistically significant change, and more than 67% agree on the sign of the change (see Section 3).
Projected Change in Mean Seasonal Precipitation; 2041-2070 relative to 1971-2000 (Alaska and Hawaii
Projected change in mean seasonal precipitation (%) for Alaska and Hawai‘i, for 2041–2070 with respect to the reference period of 1971–2000. These are multi-model means using CMIP3 SRES A2 (left column), and CMIP5 RCP8.5 (right column). Color only (category 1) indicates that less than 50% of the models show a statistically significant change. Whited out areas (category 2) indicate that more than 50% of the models show a statistically significant change, but less than 67% agree of the sign of the change. Color with hatching (category 3) indicates that more than 50% of the models show a statistically significant change, and more than 67% agree on the sign of the change (see Section 3).
Projected Change in Mean Seasonal Precipitation; 2041-2070 relative to 1971-2000
Projected change in mean seasonal precipitation (%) for the contiguous United States, for 2041–2070 with respect to the reference period of 1971–2000. These are multi-model means using CMIP3 SRES A2 (left column), and CMIP5 RCP8.5 (right column). Color only (category 1) indicates that less than 50% of the models show a statistically significant change. Whited out areas (category 2) indicate that more than 50% of the models show a statistically significant change, but less than 67% agree of the sign of the change. Color with hatching (category 3) indicates that more than 50% of the models show a statistically significant change, and more than 67% agree on the sign of the change (see Section 3).

Projected Change in Mean Annual Precipitation; 2070-2099 relative to 1971-2000 (Alaska and Hawaii)
Projected change in mean annual precipitation (%) for Alaska and Hawai‘i, for 2070–2099 with respect to the reference period of 1971–2000. These are multi-model means using CMIP3 SRES A2, A1B, and B1 scenarios (left column), and CMIP5 RCP8.5, 6.0, 4.5, and 2.6 scenarios (right column). Color only (category 1) indicates that less than 50% of the models show a statistically significant change. Whited out areas (category 2) indicate that more than 50% of the models show a statistically significant change, but less than 67% agree of the sign of the change. Color with hatching (category 3) indicates that more than 50% of the models show a statistically significant change, and more than 67% agree on the sign of the change (see Section 3).

Projected Change in Mean Annual Precipitation; 2070-2099 relative to 1971-2000
Projected change in mean annual precipitation (%) for the contiguous United States, for 2070–2099 with respect to the reference period of 1971–2000. These are multi-model means using CMIP3 SRES A2, A1B, and B1 scenarios (left column), and CMIP5 RCP8.5, 6.0, 4.5, and 2.6 scenarios (right column). Color only (category 1) indicates that less than 50% of the models show a statistically significant change. Whited out areas (category 2) indicate that more than 50% of the models show a statistically significant change, but less than 67% agree of the sign of the change. Color with hatching (category 3) indicates that more than 50% of the models show a statistically significant change, and more than 67% agree on the sign of the change (see Section 3).
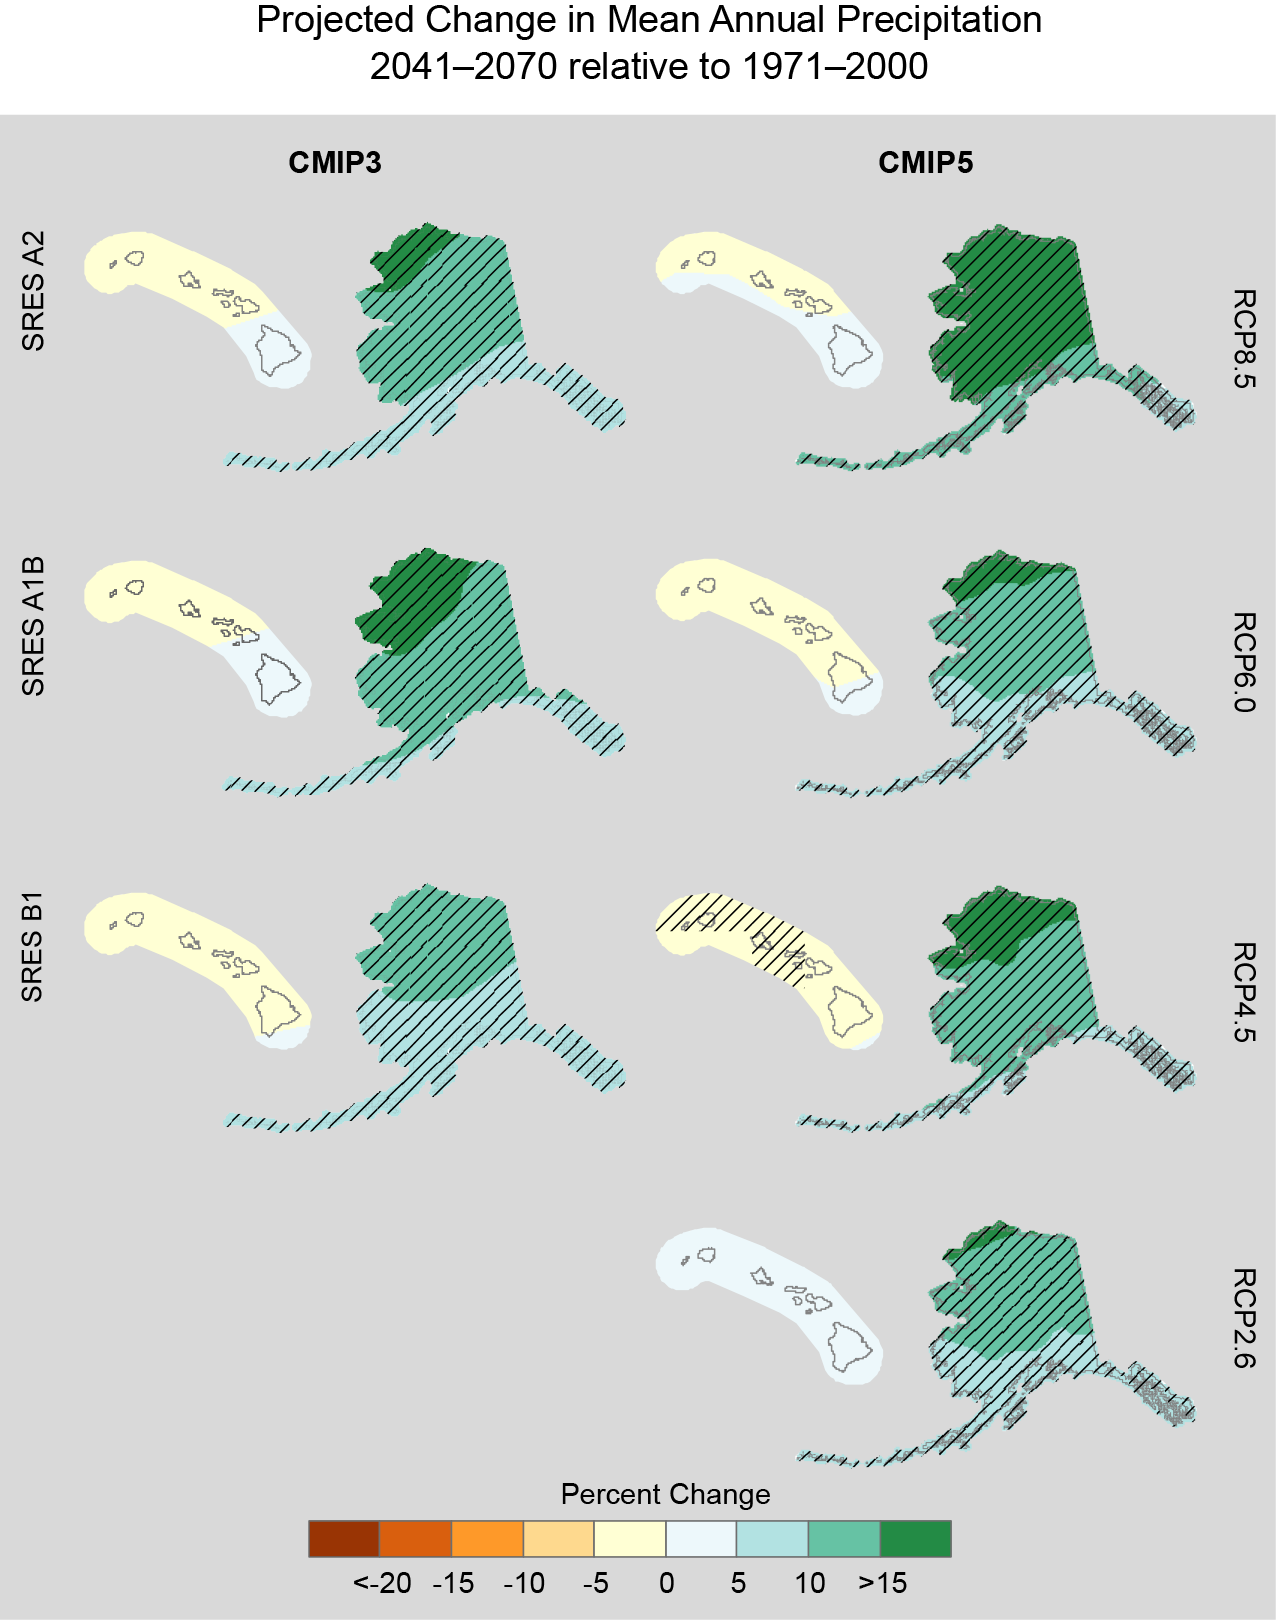
Projected Change in Mean Annual Precipitation; 2041-2070 relative to 1971-2000 (Alaska and Hawaii)
Projected change in mean annual precipitation (%) for Alaska and Hawai‘i, for 2041–2070 with respect to the reference period of 1971–2000. These are multi-model means using CMIP3 SRES A2, A1B, and B1 scenarios (left column), and CMIP5 RCP8.5, 6.0, 4.5, and 2.6 scenarios (right column). Color only (category 1) indicates that less than 50% of the models show a statistically significant change. Color with hatching (category 3) indicates that more than 50% of the models show a statistically significant change, and more than 67% agree on the sign of the change (see Section 3).

Projected Change in Mean Annual Precipitation; 2041-2070 relative to 1971-2000
Projected change in mean annual precipitation (%) for the contiguous United States, for 2041–2070 with respect to the reference period of 1971–2000. These are multi-model means using CMIP3 SRES A2, A1B, and B1 scenarios (left column), and CMIP5 RCP8.5, 6.0, 4.5, and 2.6 scenarios (right column). Color only (category 1) indicates that less than 50% of the models show a statistically significant change. Whited out areas (category 2) indicate that more than 50% of the models show a statistically significant change, but less than 67% agree of the sign of the change. Color with hatching (category 3) indicates that more than 50% of the models show a statistically significant change, and more than 67% agree on the sign of the change (see Section 3).
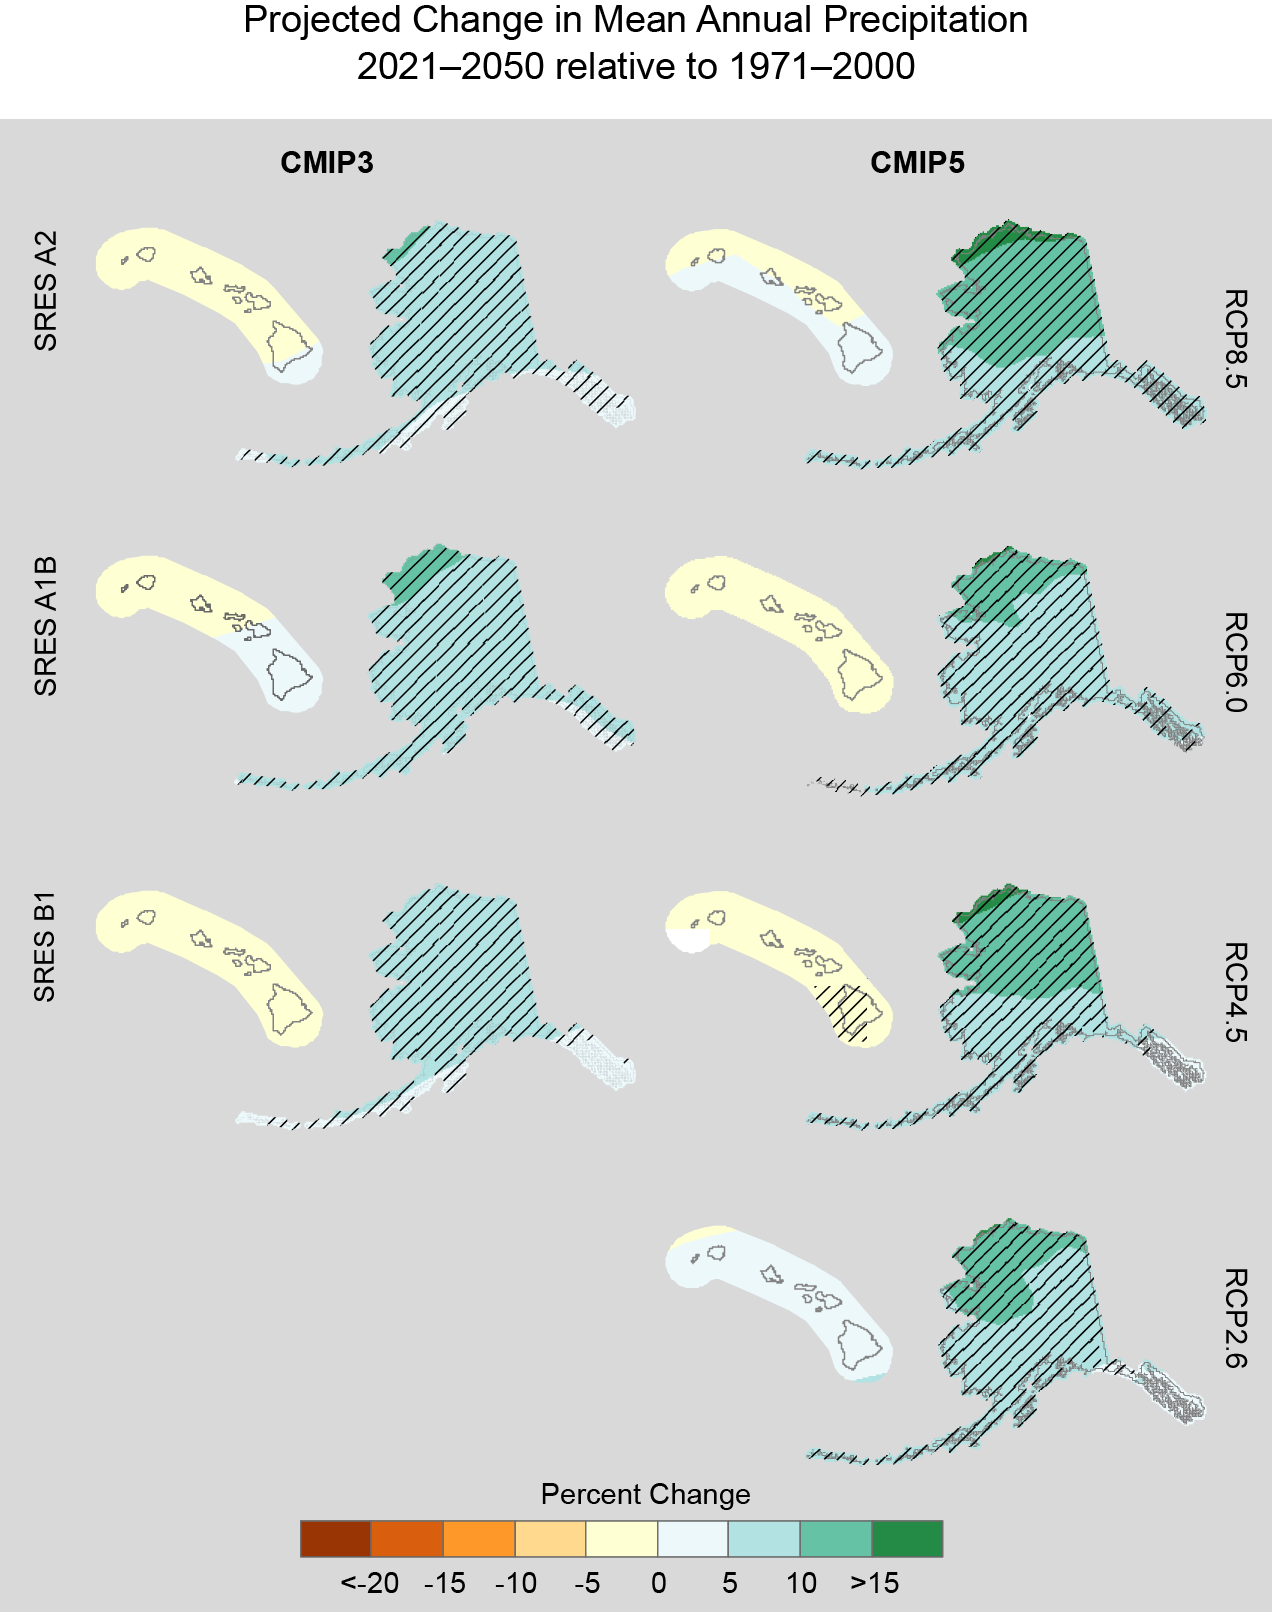
Projected Change in Mean Annual Precipitation; 2021-2050 relative to 1971-2000 (Alaska and Hawaii)
Projected change in mean annual precipitation (%) for Alaska and Hawai‘i, for 2021–2050 with respect to the reference period of 1971–2000. These are multi-model means using CMIP3 SRES A2, A1B, and B1 scenarios (left column), and CMIP5 RCP8.5, 6.0, 4.5, and 2.6 scenarios (right column). Color only (category 1) indicates that less than 50% of the models show a statistically significant change. Whited out areas (category 2) indicate that more than 50% of the models show a statistically significant change, but less than 67% agree of the sign of the change. Color with hatching (category 3) indicates that more than 50% of the models show a statistically significant change, and more than 67% agree on the sign of the change (see Section 3).
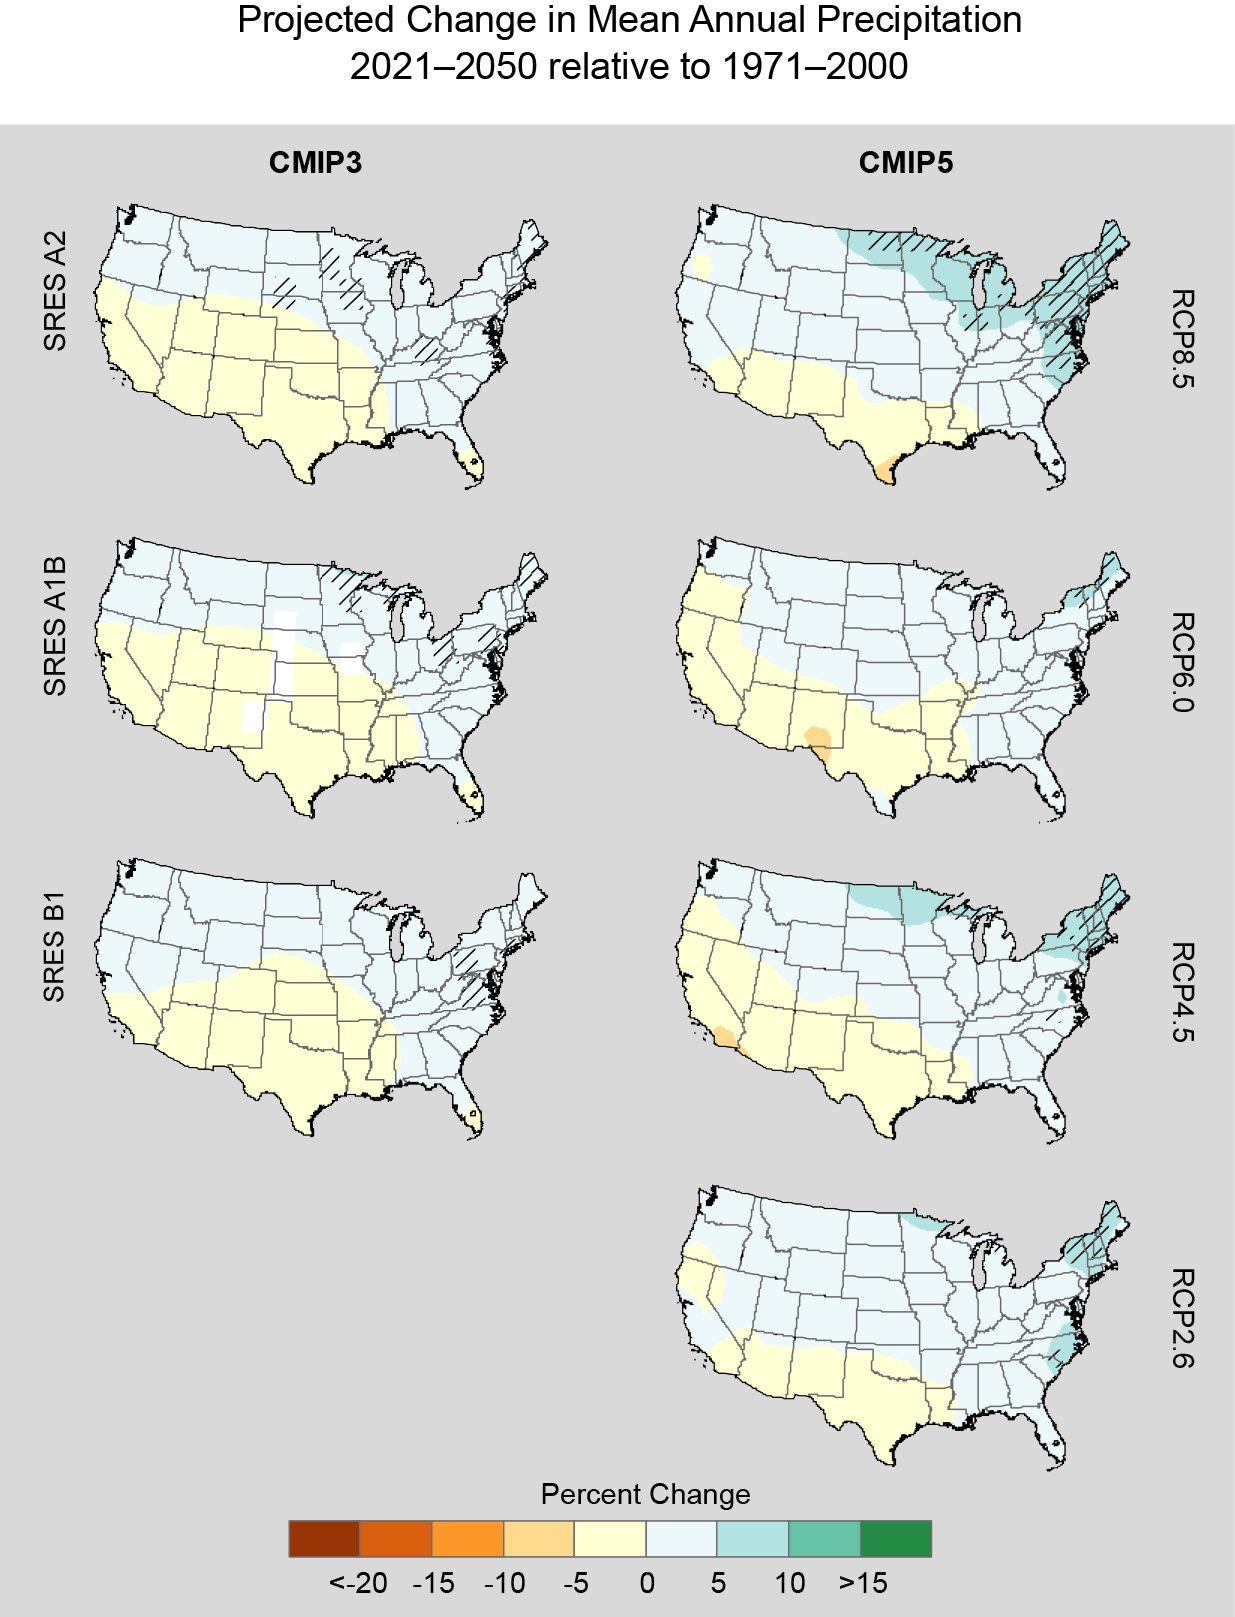
Projected Change in Mean Annual Precipitation; 2021-2050 relative to 1971-2000
Projected change in mean annual precipitation (%) for the contiguous United States, for 2021–2050 with respect to the reference period of 1971–2000. These are multi-model means using CMIP3 SRES A2, A1B, and B1 scenarios (left column), and CMIP5 RCP8.5, 6.0, 4.5, and 2.6 scenarios (right column). Color only (category 1) indicates that less than 50% of the models show a statistically significant change. Whited out areas (category 2) indicate that more than 50% of the models show a statistically significant change, but less than 67% agree of the sign of the change. Color with hatching (category 3) indicates that more than 50% of the models show a statistically significant change, and more than 67% agree on the sign of the change (see Section 3).
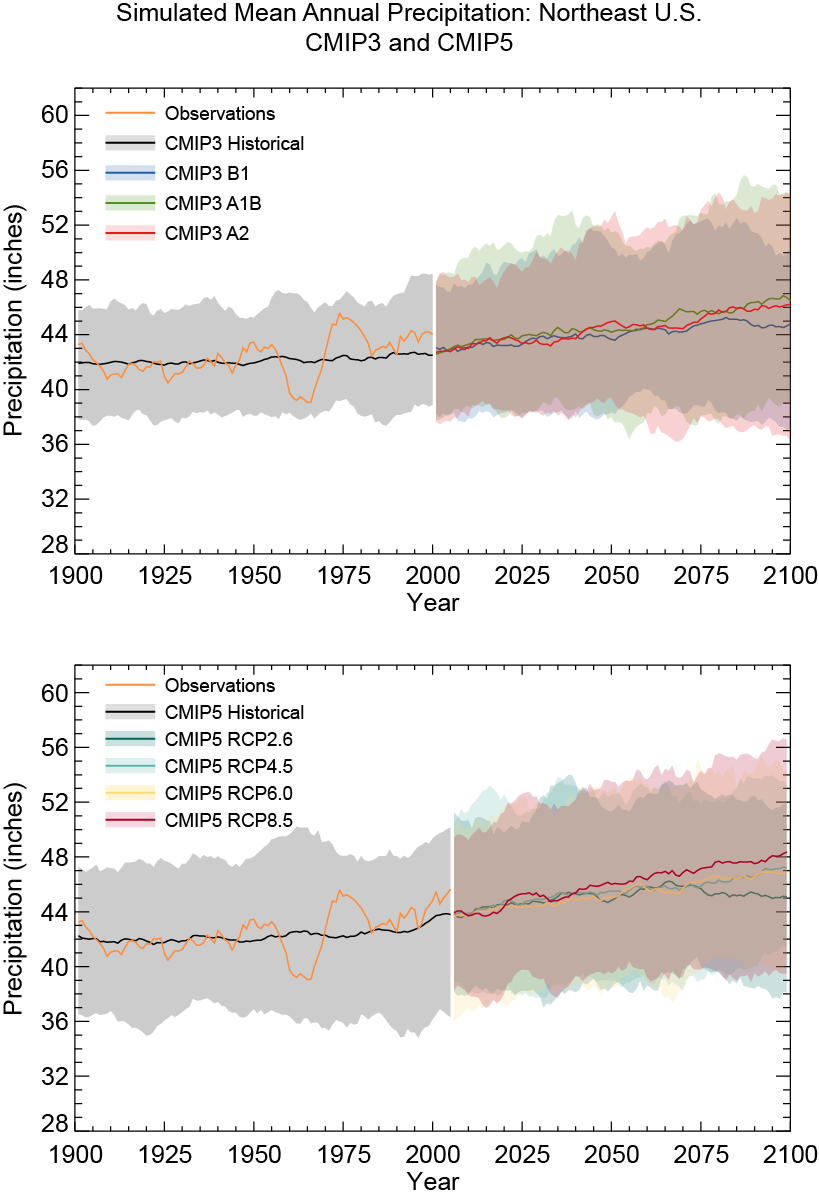
Simulated Mean Annual Precipitation: Northeast U.S.; CMIP3 and CMIP5
Simulated mean annual precipitation (inches) for the northeast U.S. for 1900–2100. The upper panel shows observations from NCEI’s Climate Divisional Dataset (nClimDiv, orange), multi-model mean simulations from CMIP3 for the historical period (black), and under the SRES B1 (blue), A1B (green), and A2 (red) scenarios. The lower panel shows observations from NCEI’s Climate Divisional Dataset (nClimDiv, orange), multi-model mean simulations from CMIP5 for the historical period (black), and under the RCP2.6 (dark teal), 4.5 (light teal), 6.0 (yellow), and 8.5 (dark red) scenarios. Shaded areas represent the 5th–95th percentile range of the model simulations. Data are smoothed with a 10-year moving boxcar average.
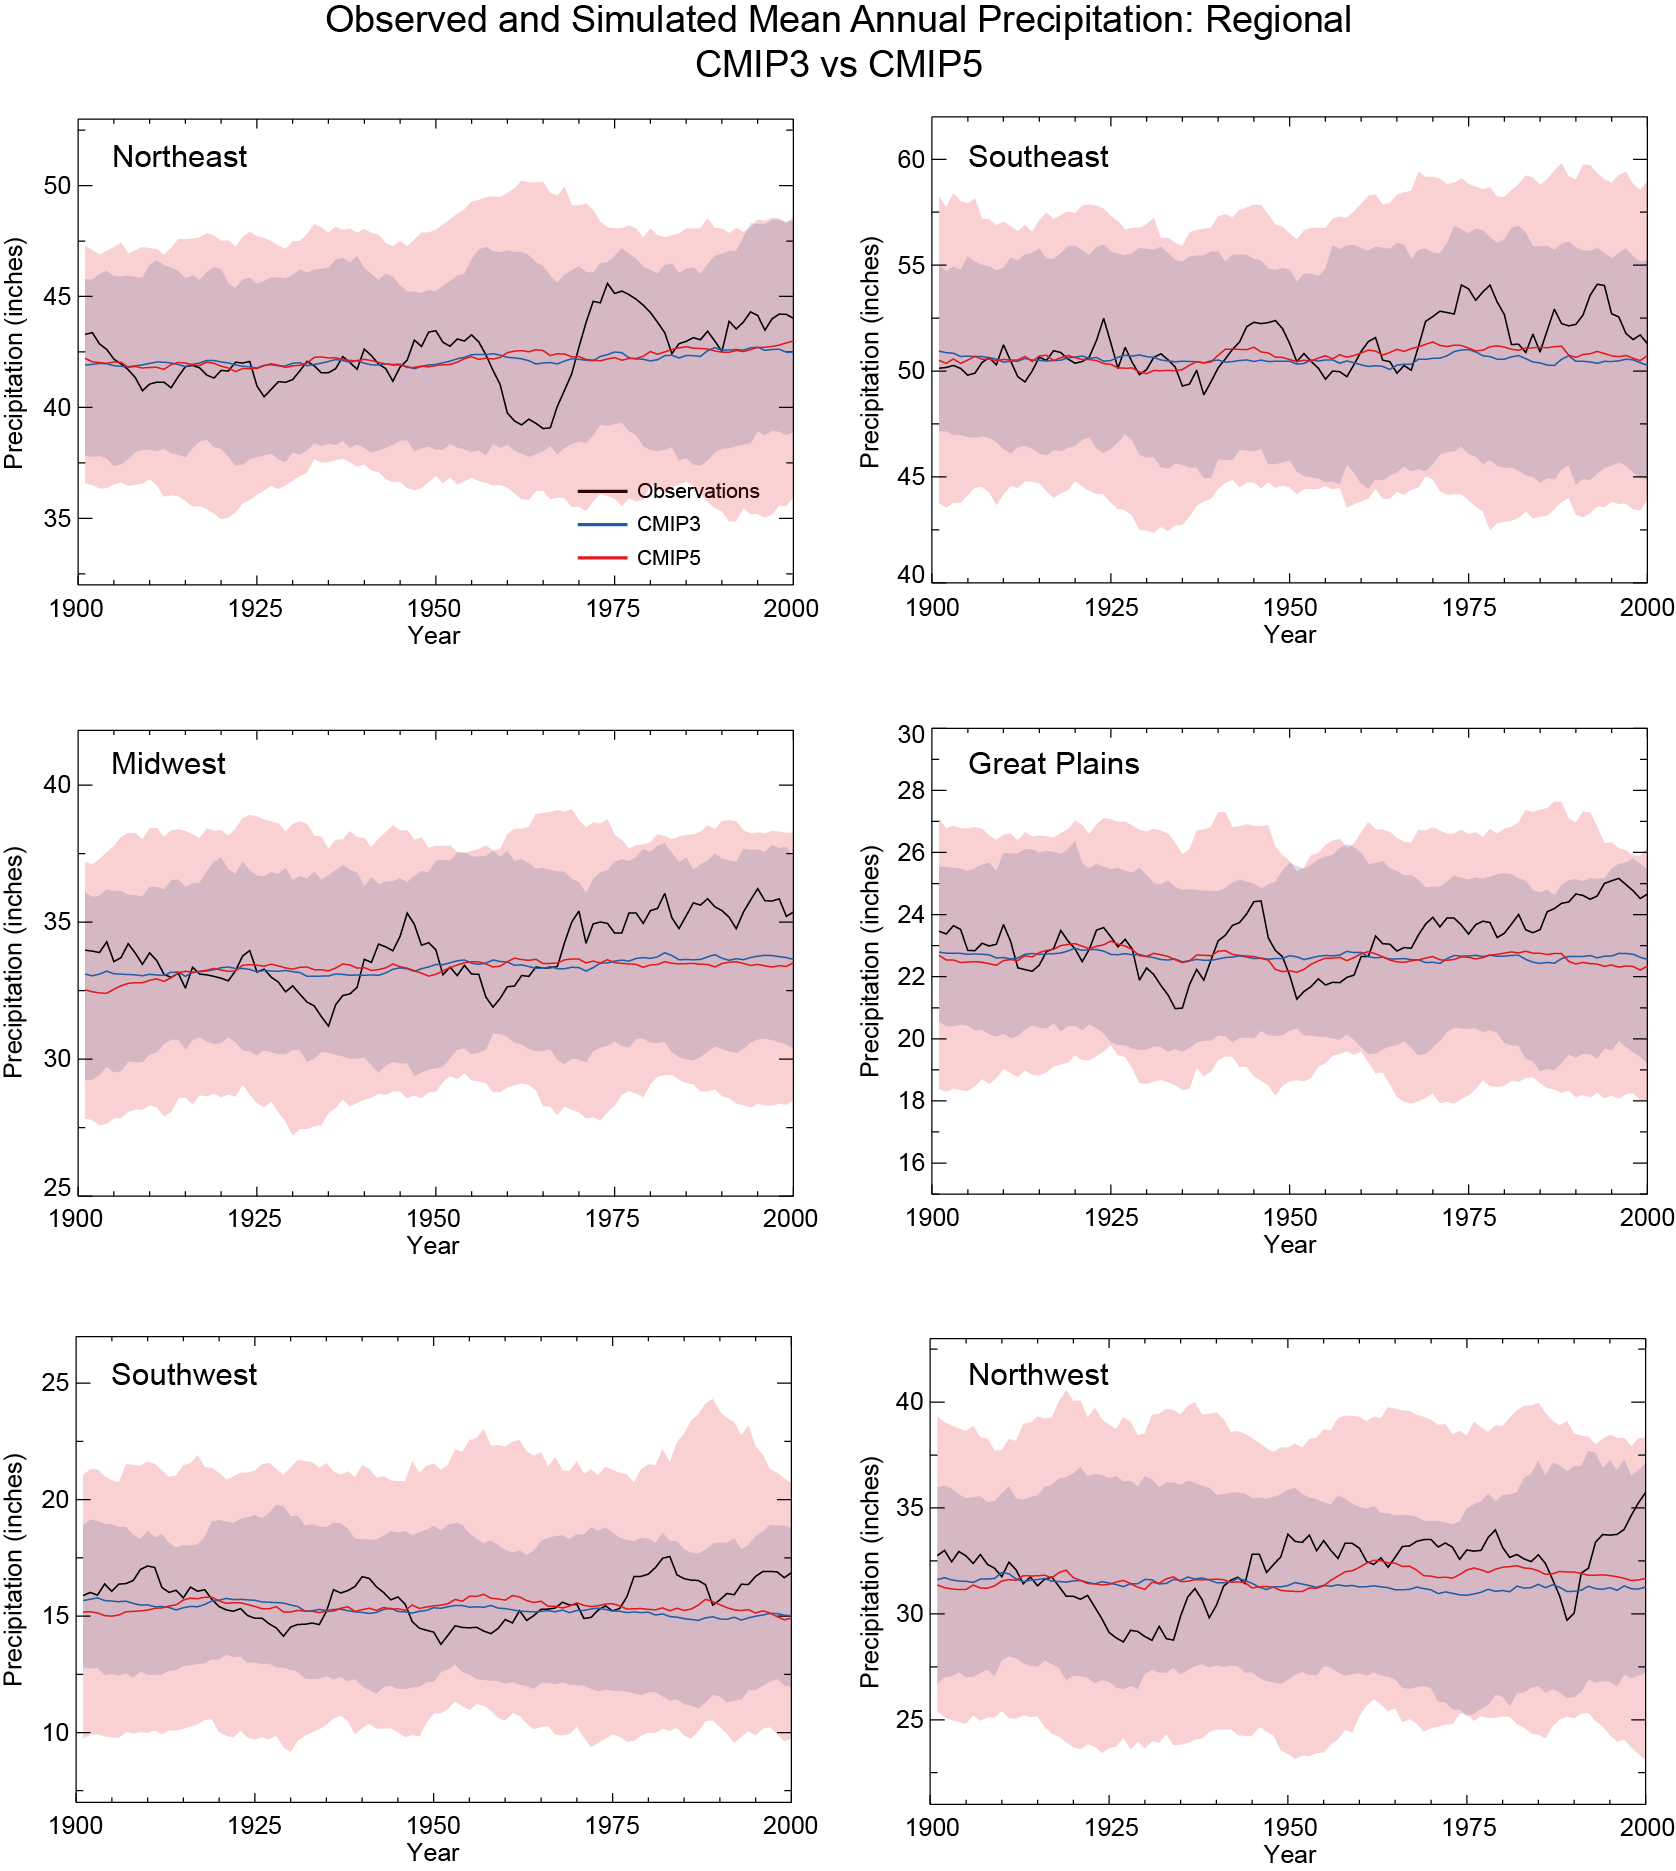
Observed and Simulated Mean Annual Precipitation: Regional; CMIP3 vs CMIP5
Observed and simulated mean annual precipitation (inches) for the six contiguous U.S. NCA regions for 1901–2000. Observational data are from NCEI’s Climate Divisional Dataset (nClimDiv, black); simulations are multi-model means from CMIP3 (blue) and CMIP5 (red). Shaded areas represent the 5–95th percentile range of the model simulations. Data are smoothed with a 10-year moving boxcar average. Note: these time series are on unique scales for each region.
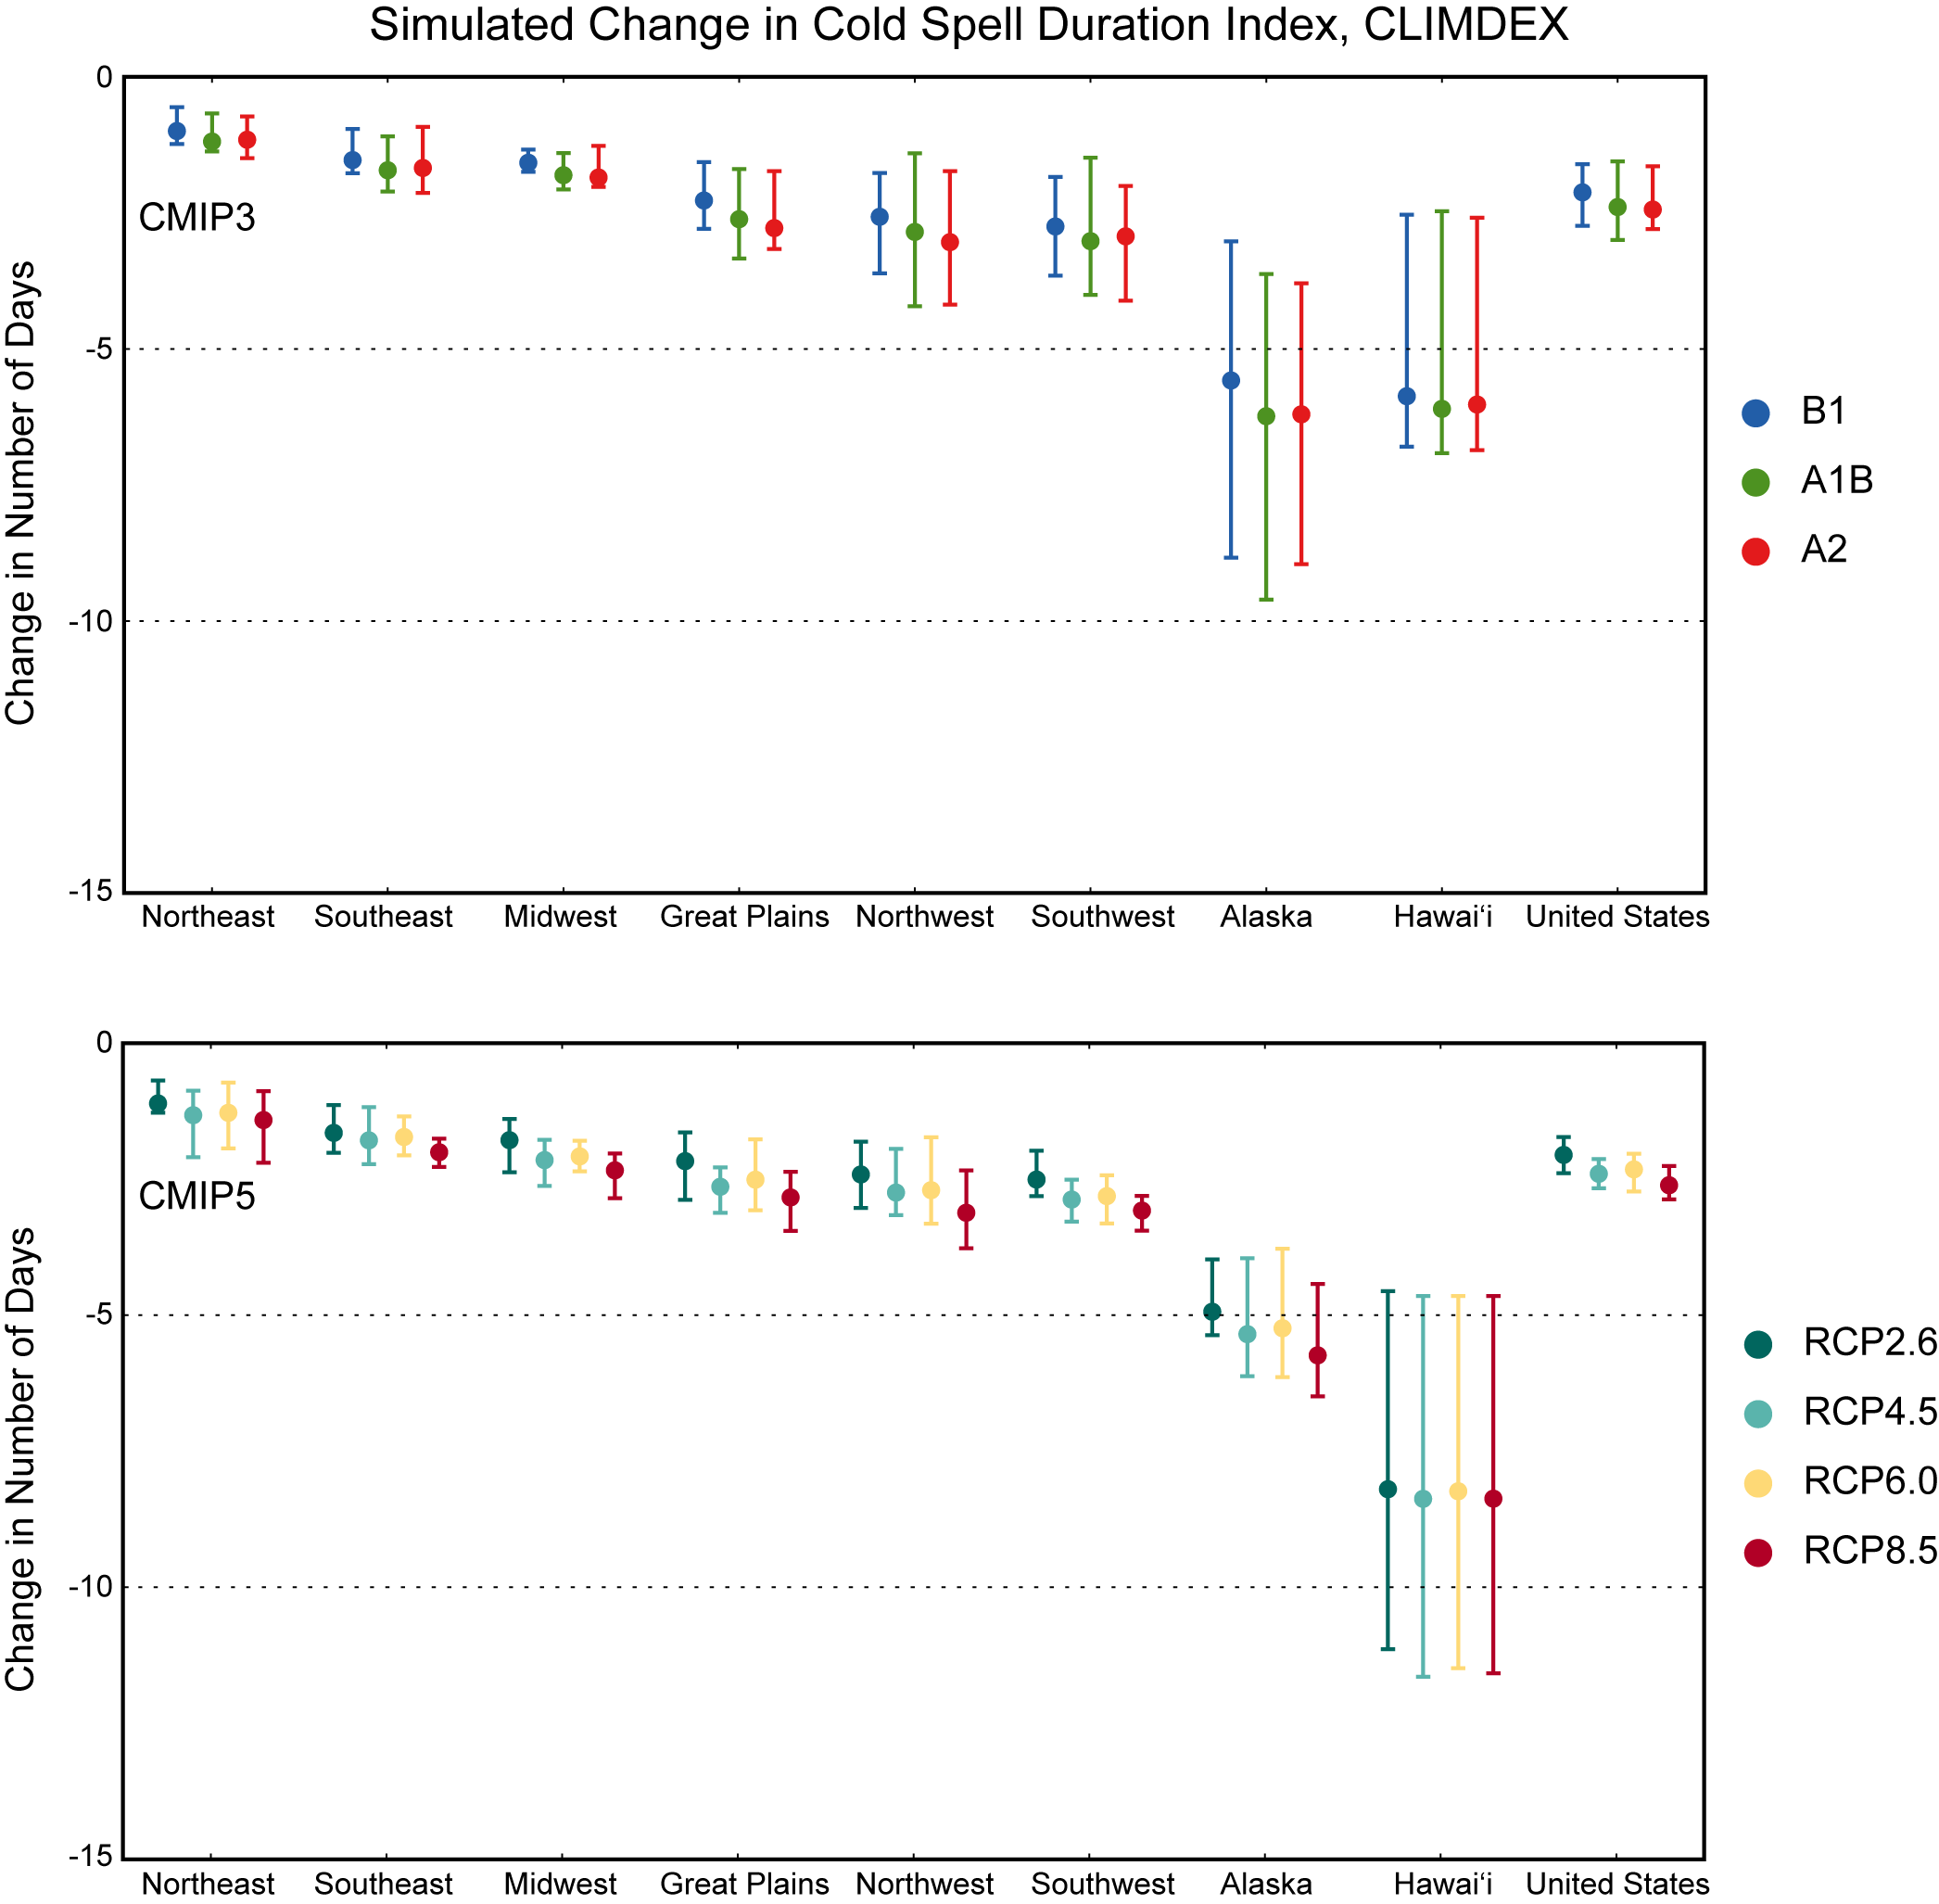
Simulated Change in Cold Spell Duration Index, CLIMDEX
Simulated change in cold spell duration index (CSDI) for each region and the contiguous United States, for 2046–2065 with respect to the reference period of 1981–2000. The upper panel shows values for the CLIMDEX SRES B1 (blue), A1B (green), and A2 (red) scenarios. The lower panel shows values for the CLIMDEX RCP2.6 (dark teal), 4.5 (light teal), 6.0 (yellow), and 8.5 (dark red) scenarios. Bars indicate the interquartile ranges of model values and circles depict the multi-model means.
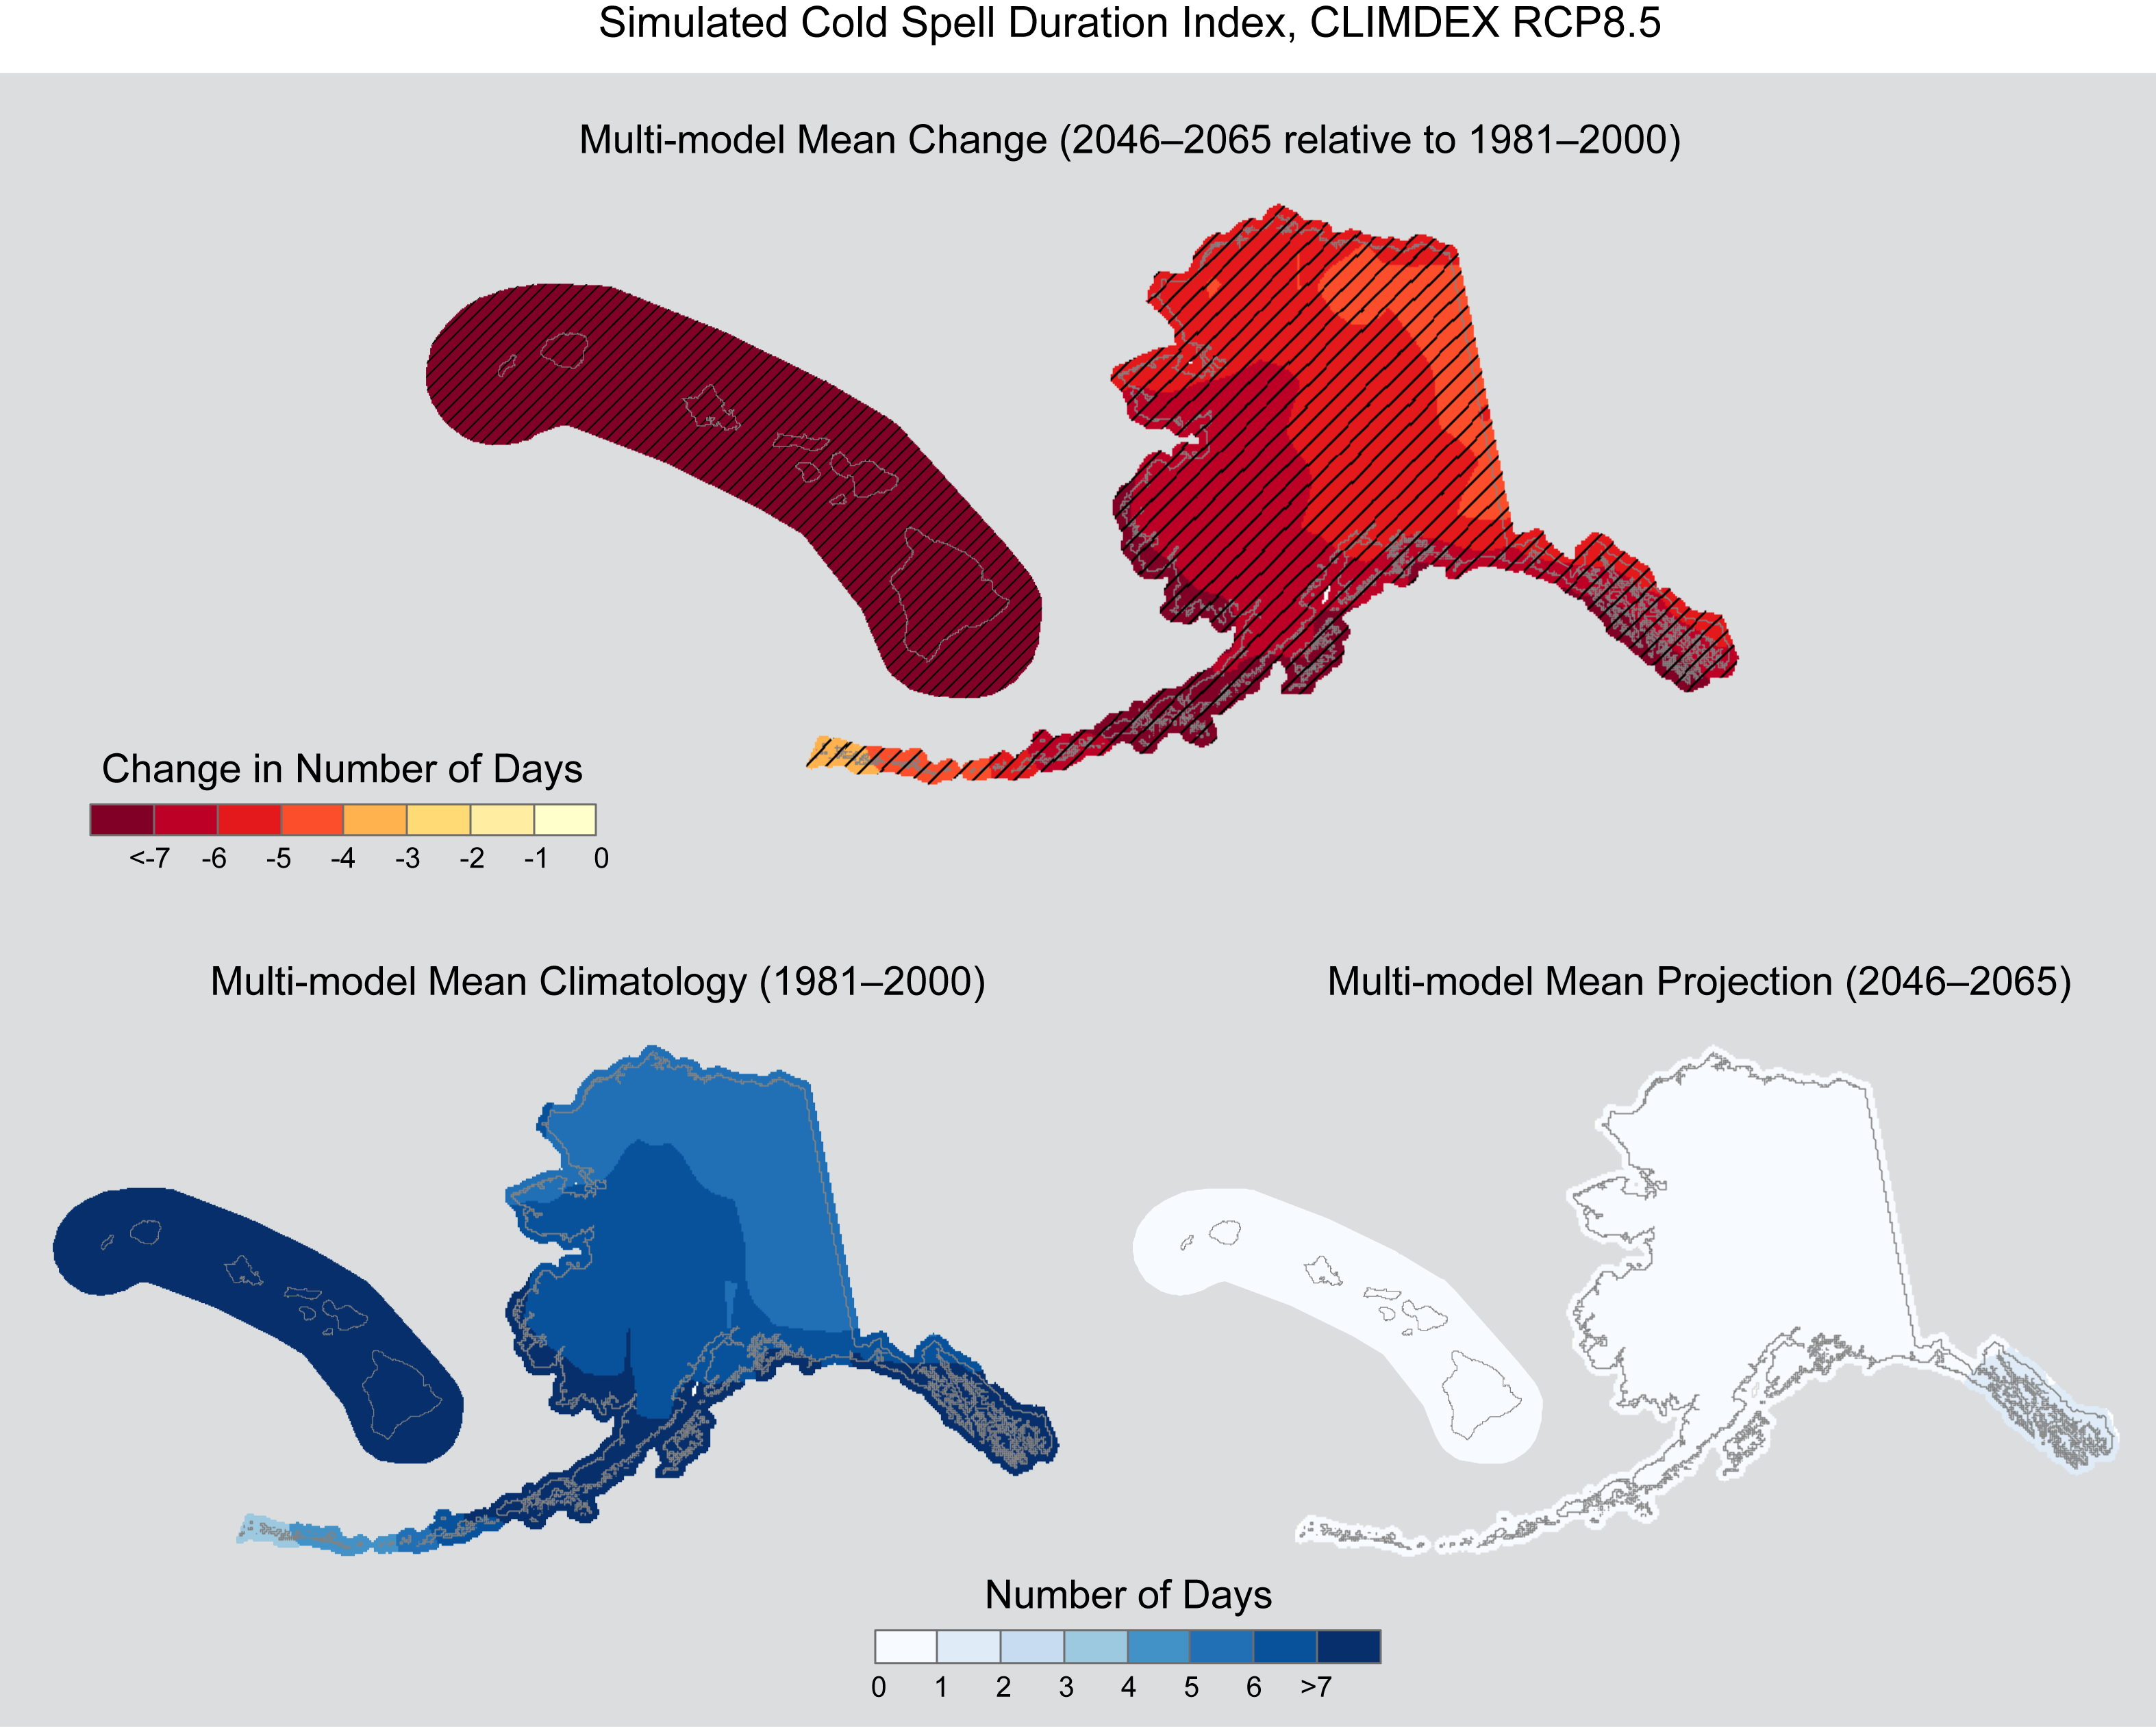
Simulated Cold Spell Duration Index, CLIMDEX RCP8.5 (Alaska and Hawaii)
Simulated multi-model mean change in cold spell duration index (CSDI) for Alaska and Hawai‘i, for 2046–2065 with respect to the reference period of 1981–2000, using the CLIMDEX RCP8.5 scenario (top). Color with hatching (category 3) indicates that more than 50% of the models show a statistically significant change, and more than 67% agree on the sign of the change (see Section 3). Multi- model mean climatology indicating the CSDI for 1981–2000 (bottom left). Multi-model mean projection indicating the CSDI for 2046–2065 (bottom right).
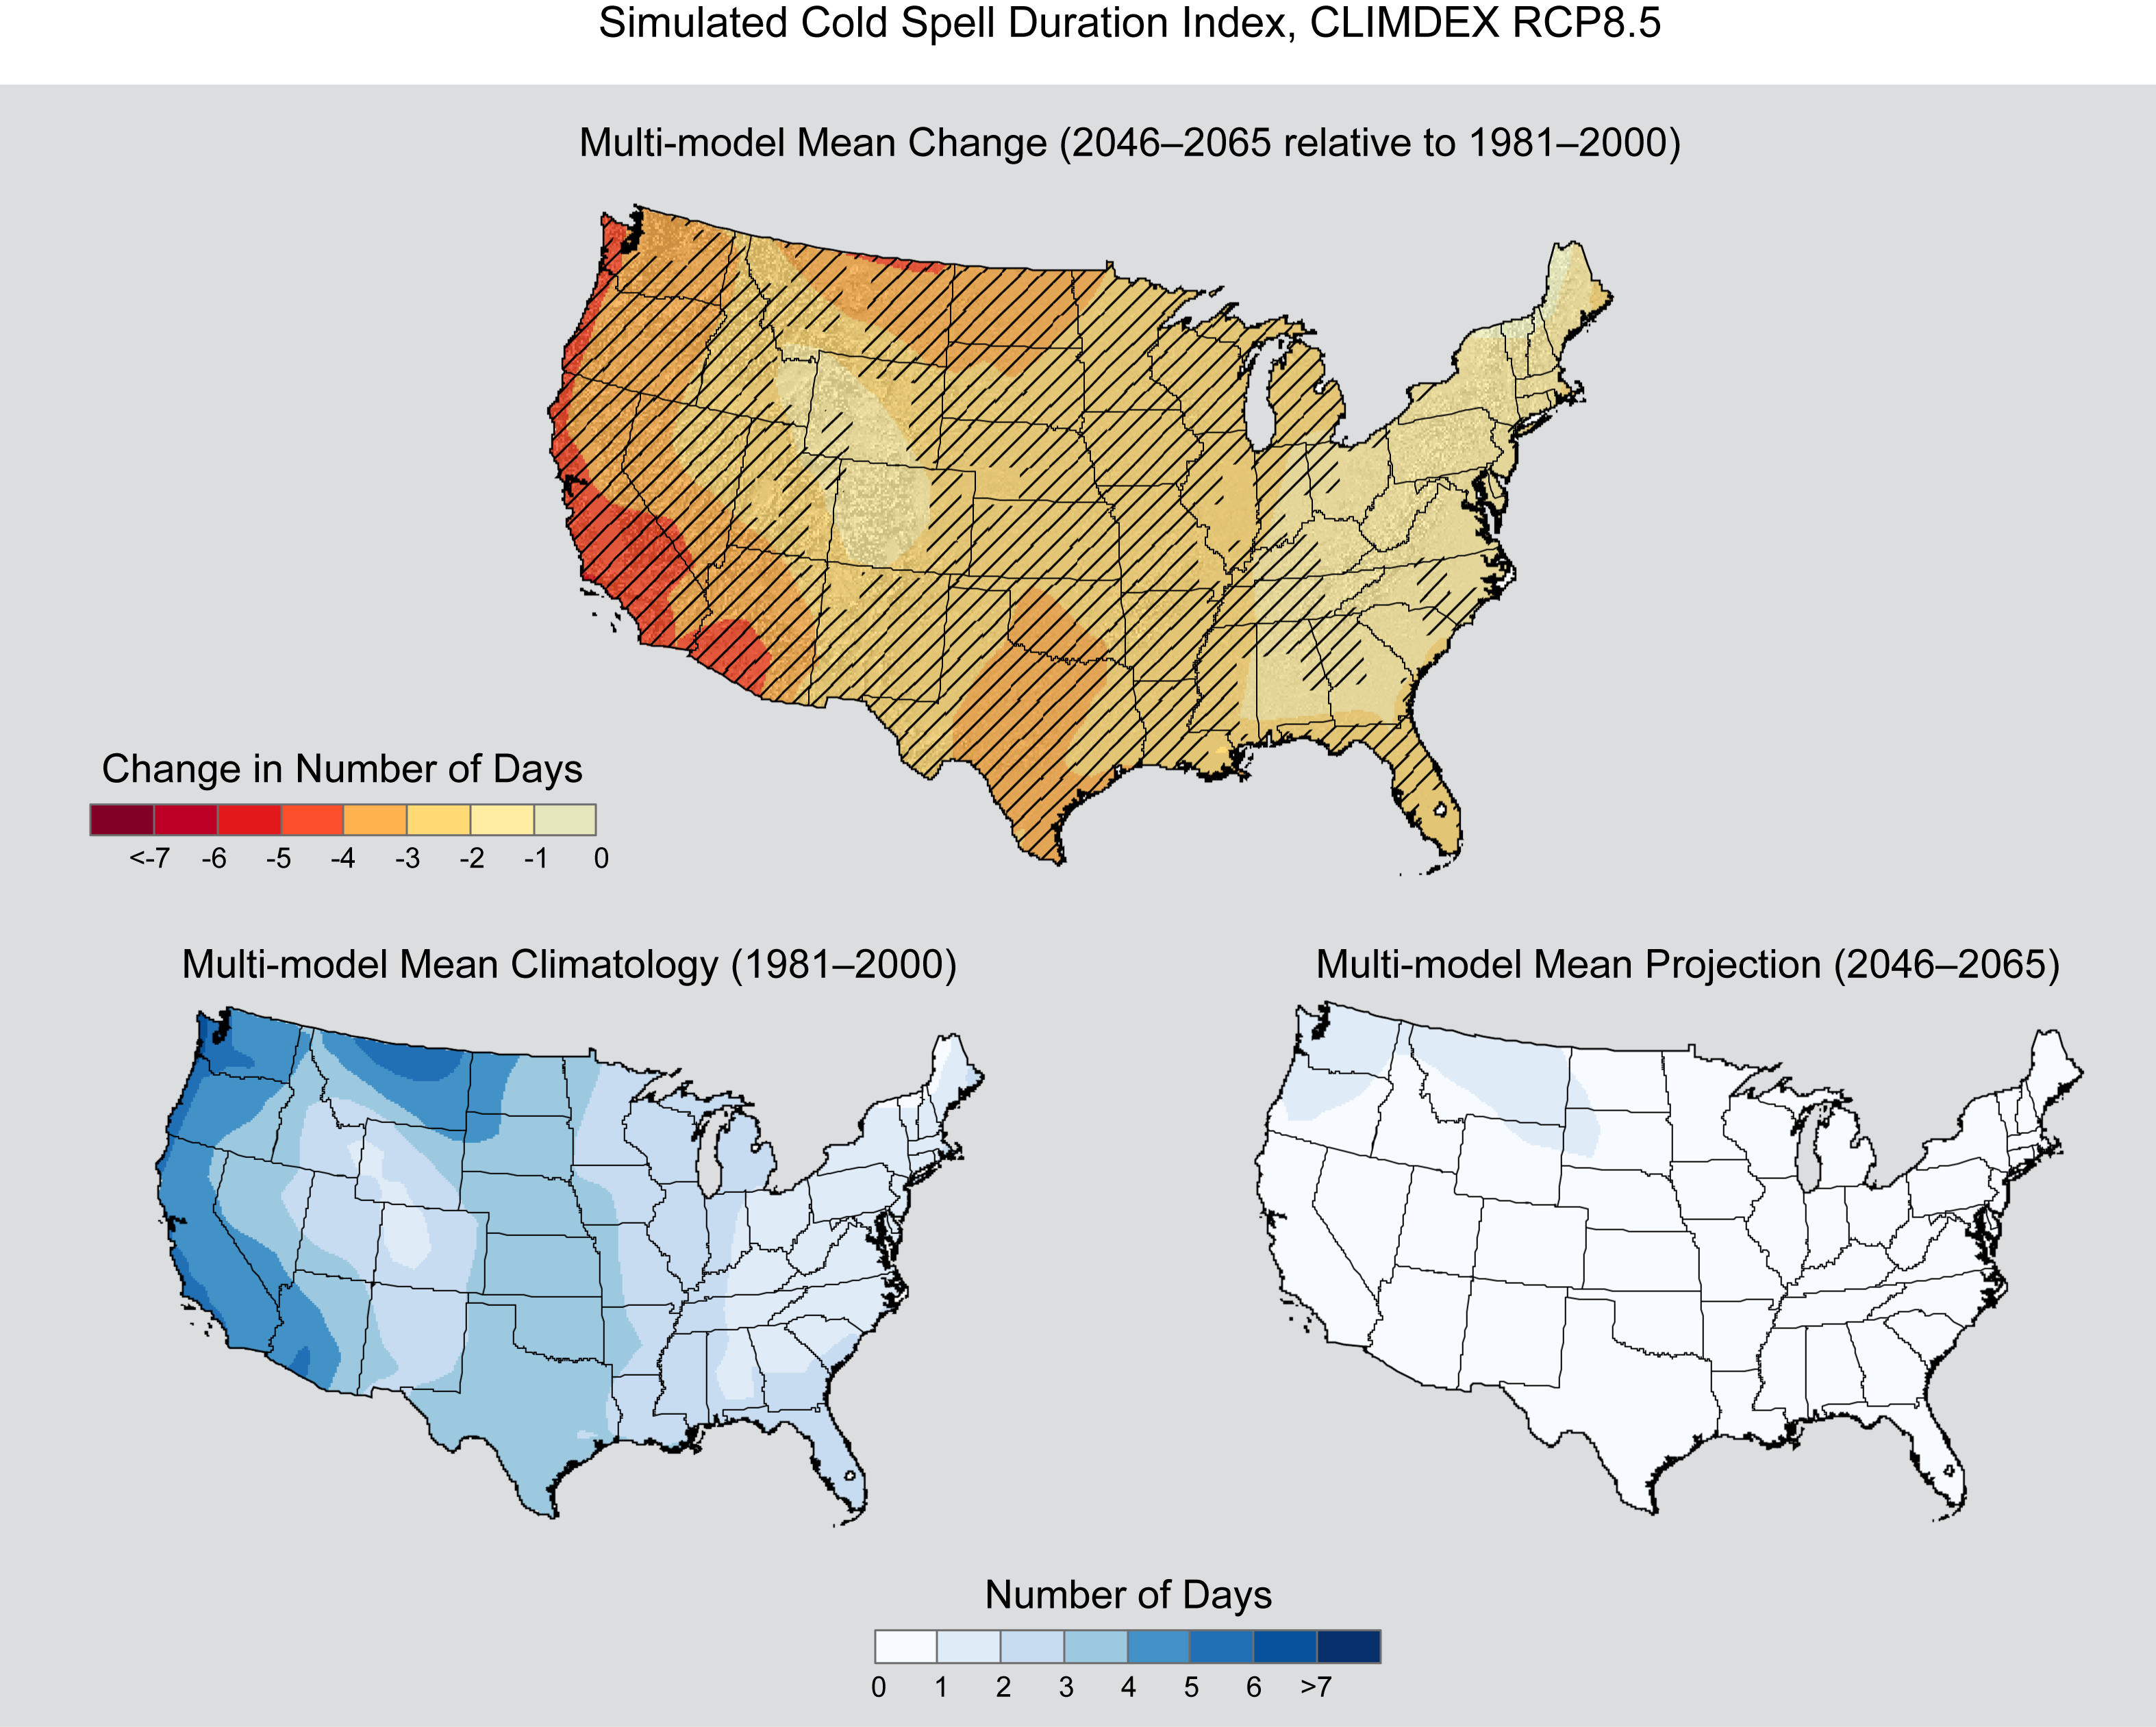
Simulated Cold Spell Duration Index, CLIMDEX RCP8.5
Simulated multi-model mean change in cold spell duration index (CSDI) for the contiguous United States, for 2046–2065 with respect to the reference period of 1981–2000, using the CLIMDEX RCP8.5 scenario (top). Color only (category 1) indicates that less than 50% of the models show a statistically significant change. Color with hatching (category 3) indicates that more than 50% of the models show a statistically significant change, and more than 67% agree on the sign of the change (see Section 3). Multi-model mean climatology indicating the CSDI for 1981–2000 (bottom left). Multi-model mean projection indicating the CSDI for 2046–2065 (bottom right).
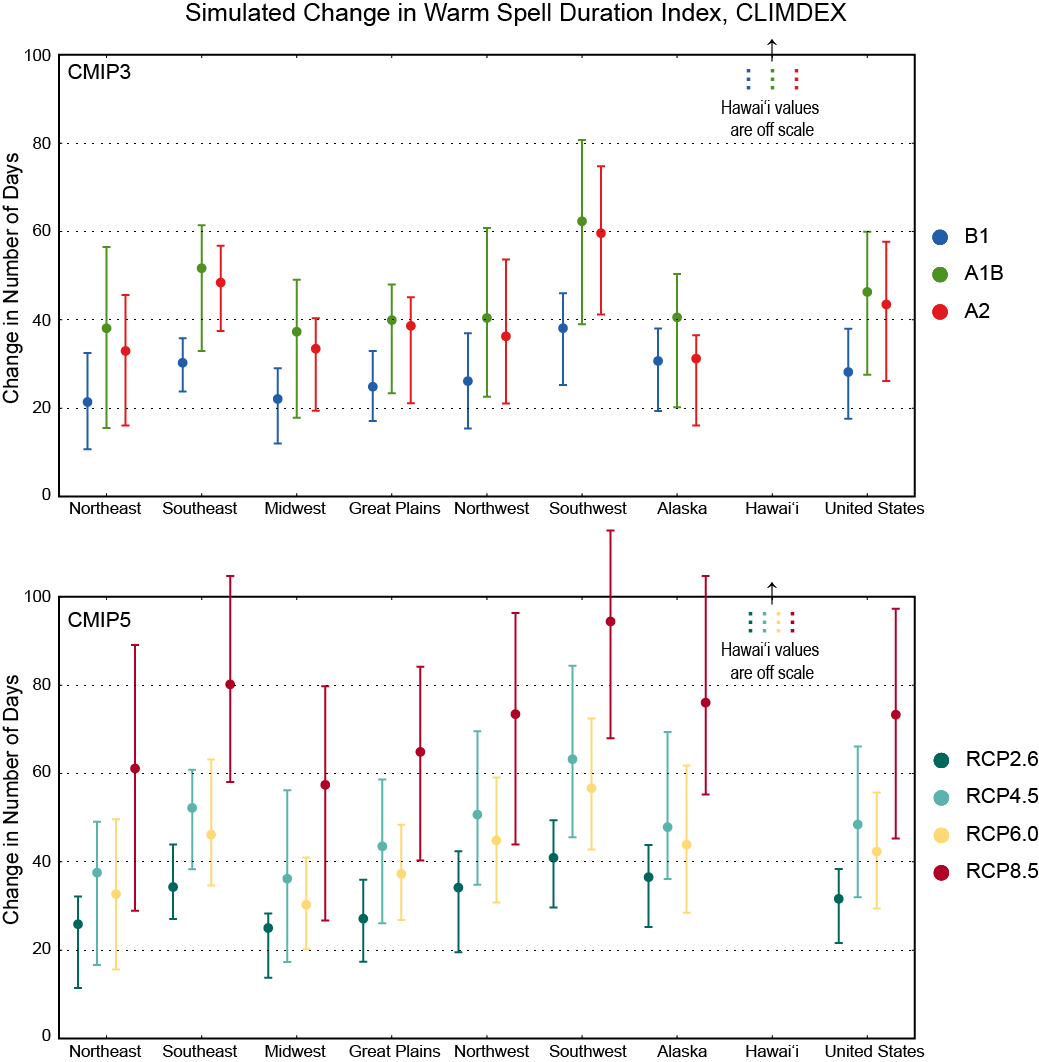
Simulated Change in Warm Spell Duration Index, CLIMDEX
Simulated change in warm spell duration index (WSDI) for each region and the contiguous United States, for 2046–2065 with respect to the reference period of 1981–2000. The upper panel shows values for the CLIMDEX SRES B1 (blue), A1B (green), and A2 (red) scenarios. The lower panel shows values for the CLIMDEX RCP2.6 (dark teal), 4.5 (light teal), 6.0 (yellow), and 8.5 (dark red) scenarios. Bars indicate the interquartile ranges of model values and circles depict the multi-model means. Note: values for Hawai‘i lie off the scale, with multi-model means ranging from 184.4 days for the RCP2.6 scenario, to 271.3 days for RCP8.5.

Simulated Warm Spell Duration Index, CLIMDEX RCP8.5 (Alaska and Hawaii)
Simulated multi-model mean change in warm spell duration index (WSDI) for Alaska and Hawai‘i, for 2046–2065 with respect to the reference period of 1981–2000, using the CLIMDEX RCP8.5 scenario (top). Color with hatching (category 3) indicates that more than 50% of the models show a statistically significant change, and more than 67% agree on the sign of the change (see Section 3). Multi- model mean climatology indicating the WSDI for 1981–2000 (bottom left). Multi-model mean projection indicating the WSDI for 2046–2065 (bottom right).
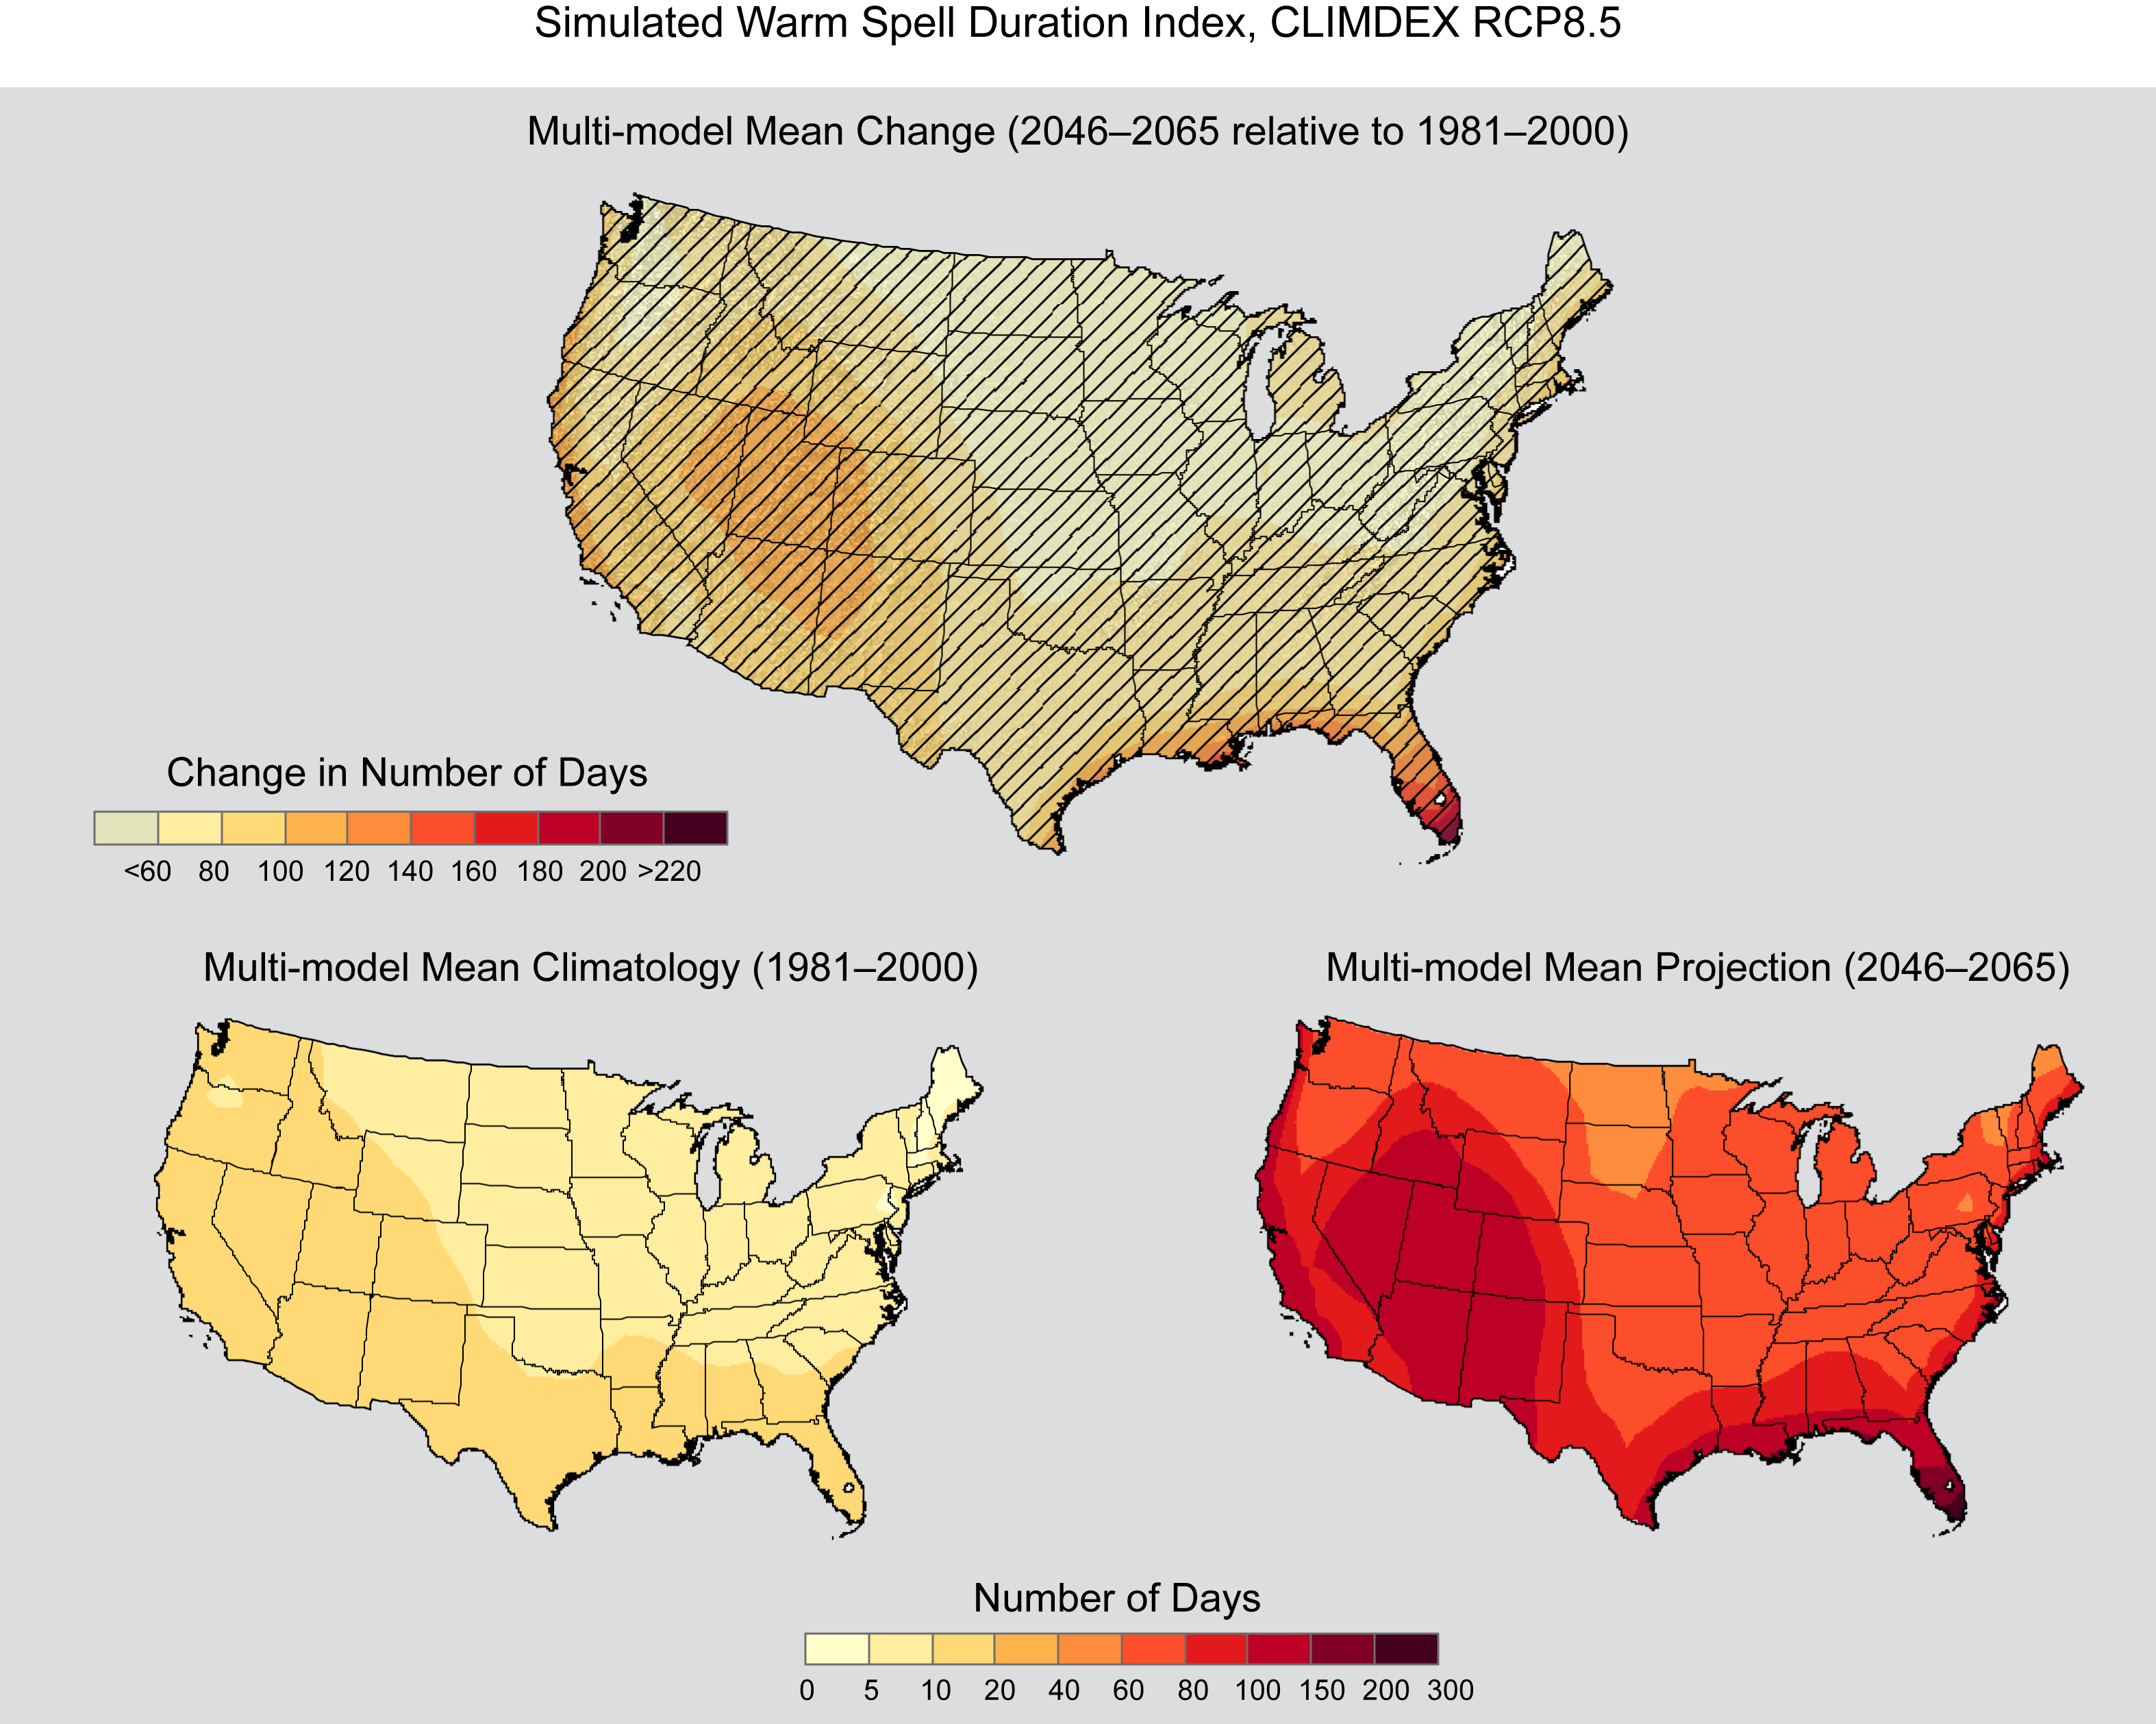
Simulated Warm Spell Duration Index, CLIMDEX RCP8.5
Simulated multi-model mean change in warm spell duration index (WSDI) for the contiguous United States, for 2046–2065 with respect to the reference period of 1981–2000, using the CLIMDEX RCP8.5 scenario (top). Color with hatching (category 3) indicates that more than 50% of the models show a statistically significant change, and more than 67% agree on the sign of the change (see Section 3). Multi- model mean climatology indicating the WSDI for 1981–2000 (bottom left). Multi-model mean projection indicating the WSDI for 2046–2065 (bottom right).
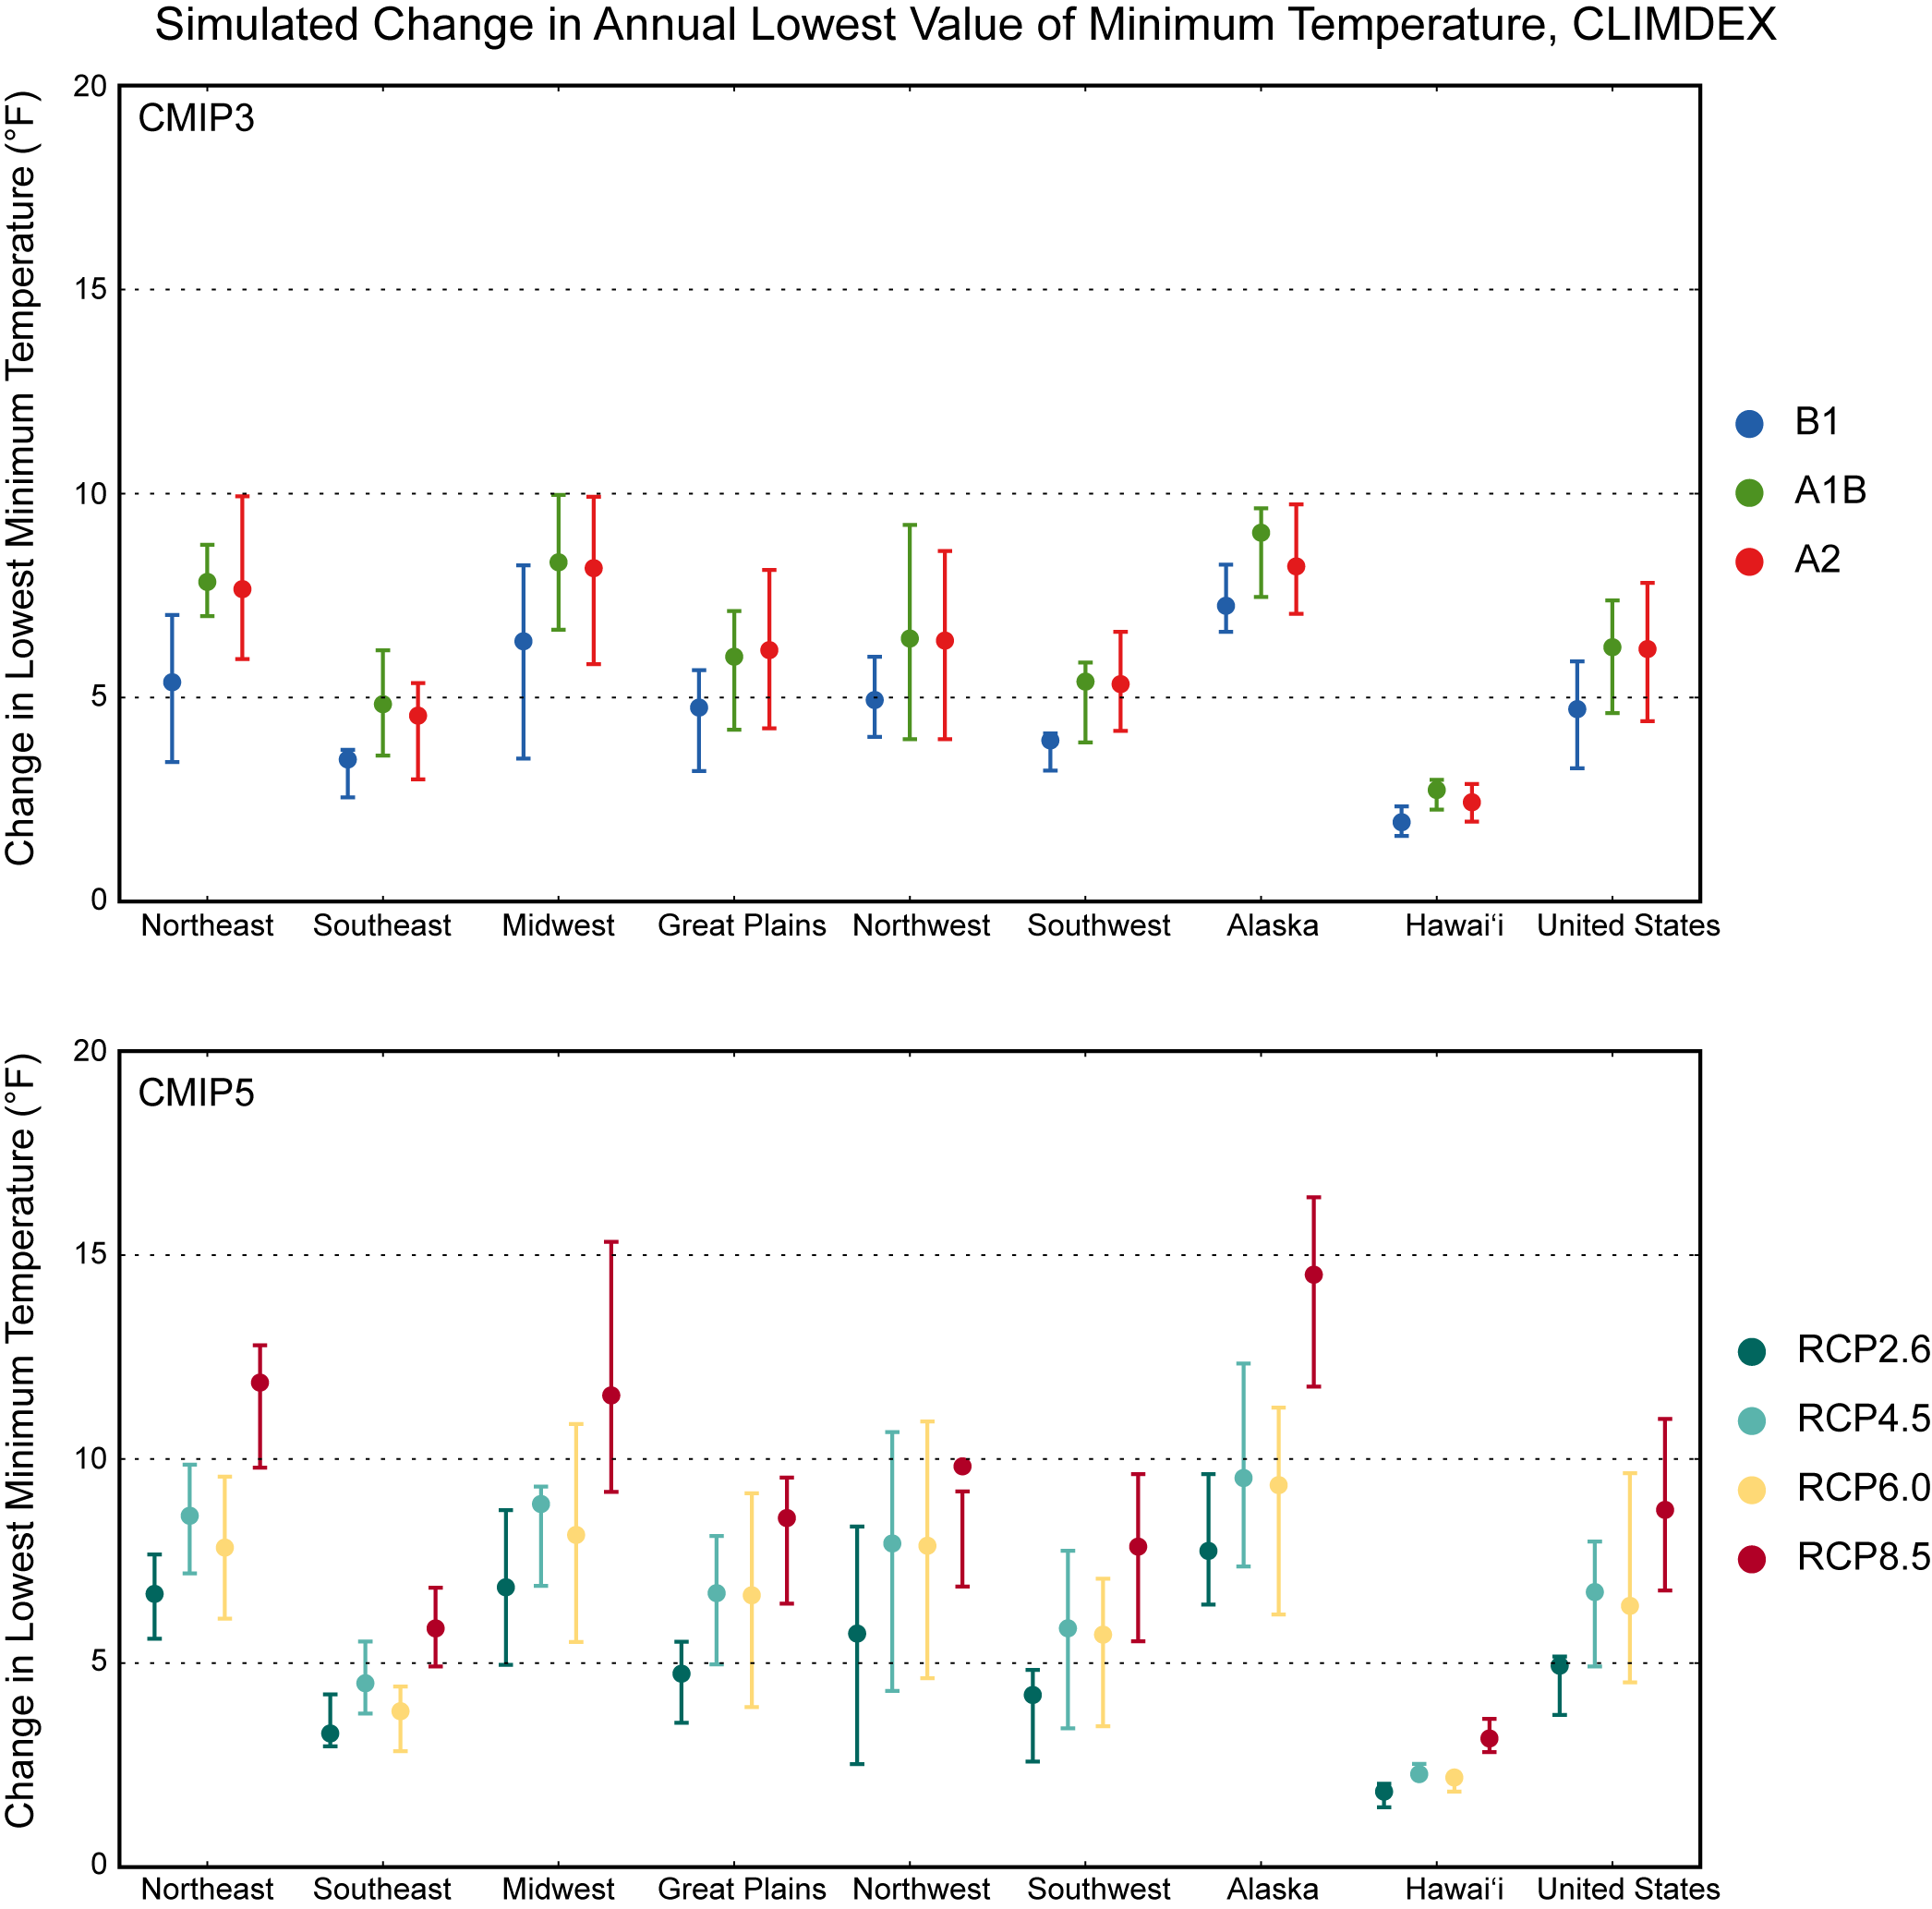
Simulated Change in Annual Lowest Value of Minimum Temperature, CLIMDEX
Simulated change in the annual lowest value of daily minimum temperature (TNn) for each region and the contiguous United States, for 2046–2065 with respect to the reference period of 1981–2000. The upper panel shows values for the CLIMDEX SRES B1 (blue), A1B (green), and A2 (red) scenarios. The lower panel shows values for the CLIMDEX RCP2.6 (dark teal), 4.5 (light teal), 6.0 (yellow), and 8.5 (dark red) scenarios. Bars indicate the interquartile ranges of model values and circles depict the multi-model means.
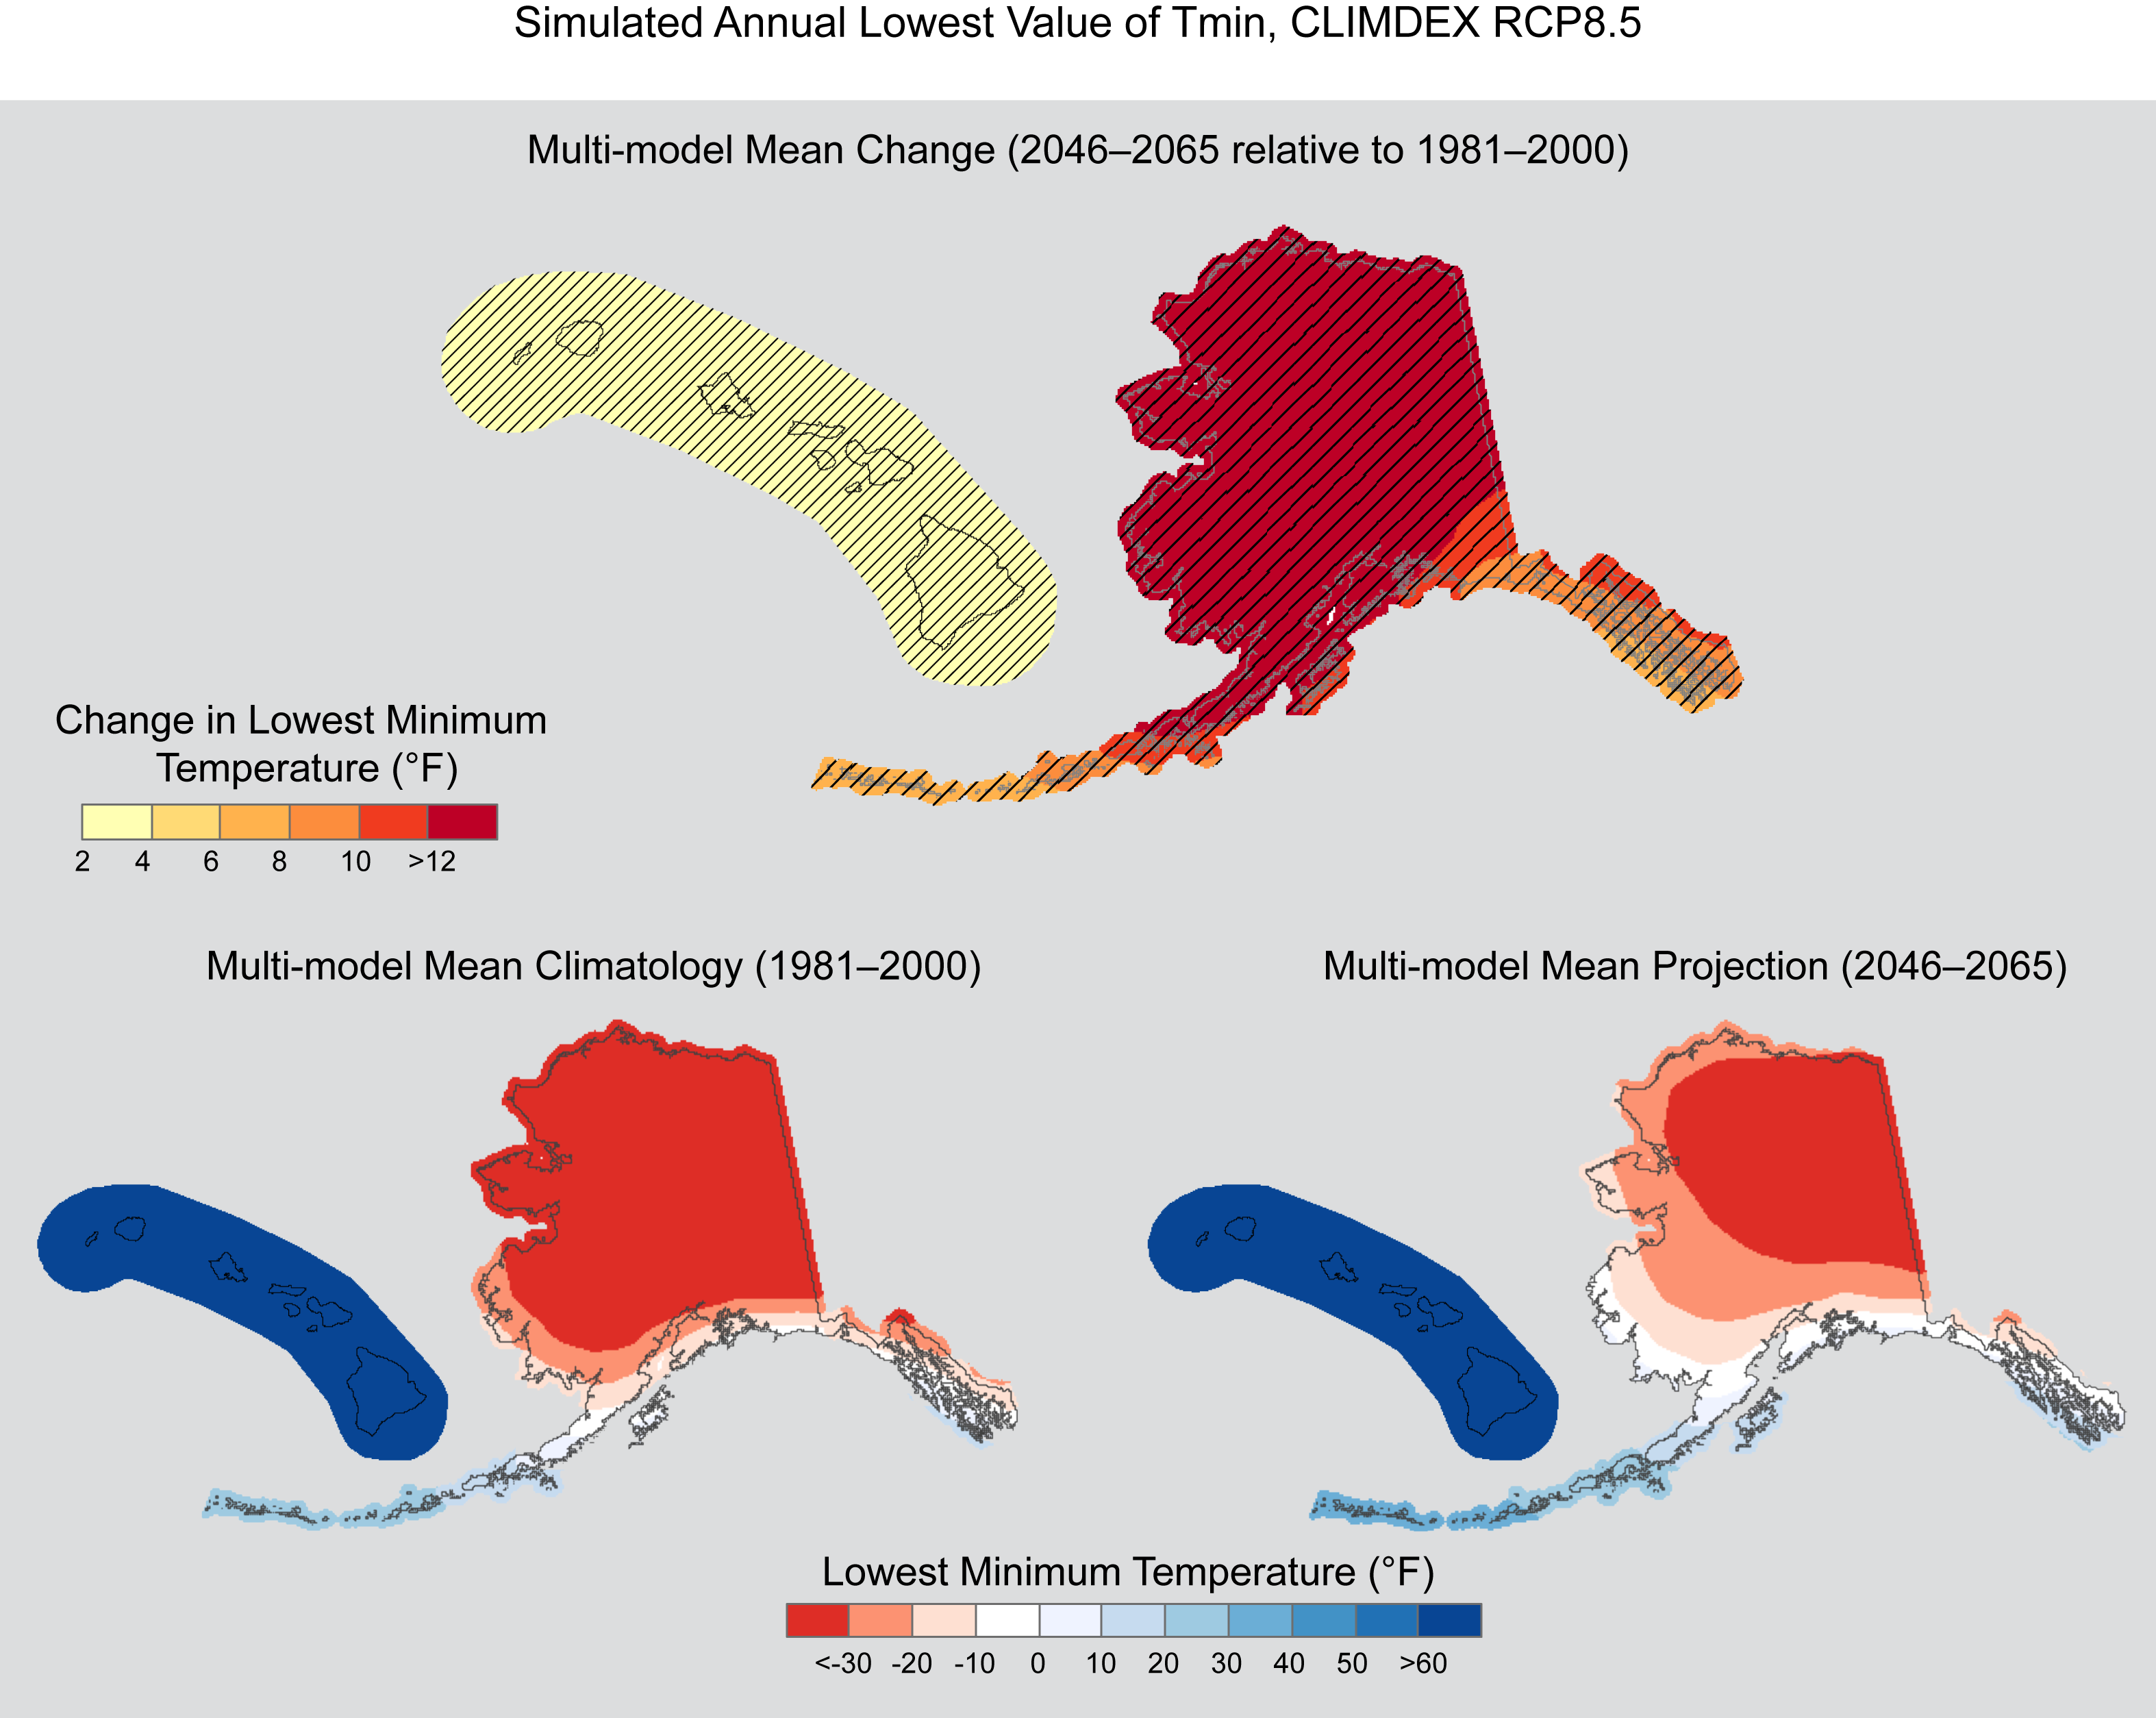
Simulated Annual Lowest Value of Tmin, CLIMDEX RCP8.5 (Alaska and Hawaii)
Simulated multi-model mean change in the annual lowest value of daily minimum temperature (TNn) for Alaska and Hawai‘i, for 2046–2065 with respect to the reference period of 1981–2000, using the CLIMDEX RCP8.5 scenario (top). Color with hatching (category 3) indicates that more than 50% of the models show a statistically significant change, and more than 67% agree on the sign of the change (see Section 3). Multi-model mean climatology indicating the TNn for 1981–2000 (bottom left). Multi-model mean projection indicating the TNn for 2046–2065 (bottom right).
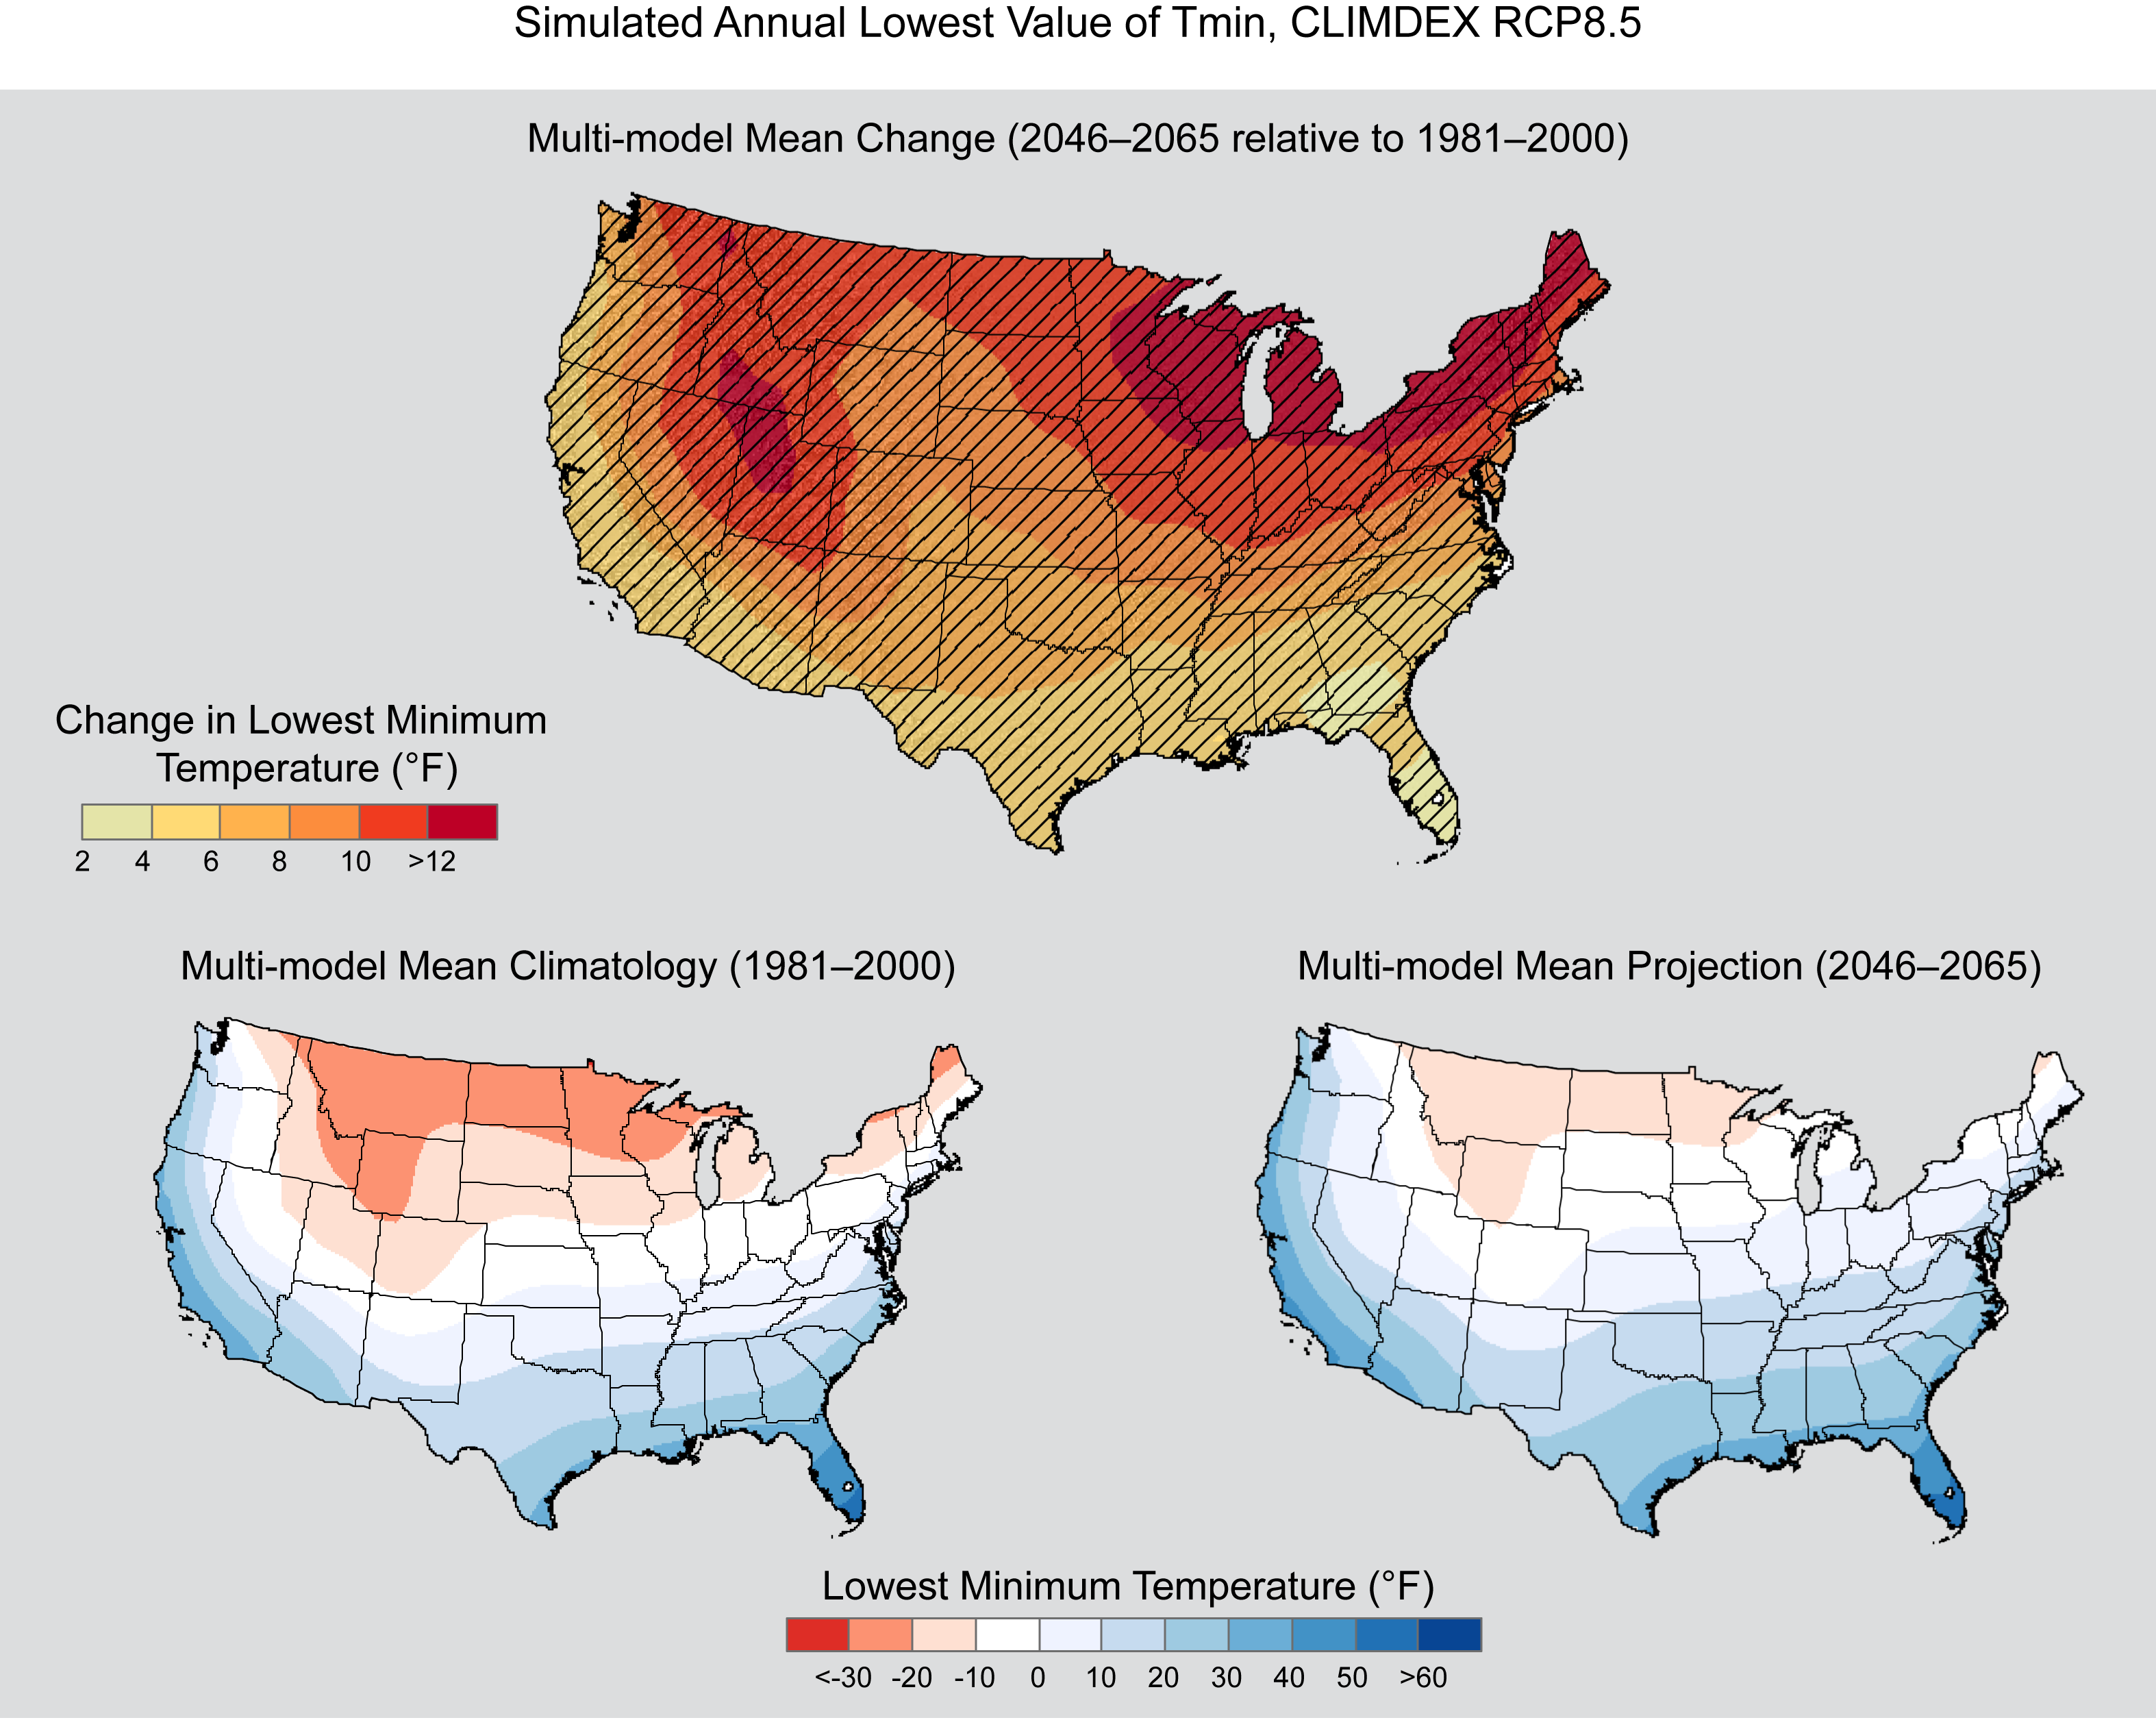
Simulated Annual Lowest Value of Tmin, CLIMDEX RCP8.5
Simulated multi-model mean change in the annual lowest value of daily minimum temperature (TNn) for the contiguous United States, for 2046–2065 with respect to the reference period of 1981–2000, using the CLIMDEX RCP8.5 scenario (top). Color with hatching (category 3) indicates that more than 50% of the models show a statistically significant change, and more than 67% agree on the sign of the change (see Section 3). Multi-model mean climatology indicating the TNn for 1981–2000 (bottom left). Multi-model mean projection indicating the TNn for 2046–2065 (bottom right).

Simulated Change in Annual Lowest Value of Maximum Temperature, CLIMDEX
Simulated change in the annual lowest value of daily maximum temperature (TXn) for each region and the contiguous United States, for 2046–2065 with respect to the reference period of 1981–2000. The upper panel shows values for the CLIMDEX SRES B1 (blue), A1B (green), and A2 (red) scenarios. The lower panel shows values for the CLIMDEX RCP2.6 (dark teal), 4.5 (light teal), 6.0 (yellow), and 8.5 (dark red) scenarios. Bars indicate the interquartile ranges of model values and circles depict the multi-model means.
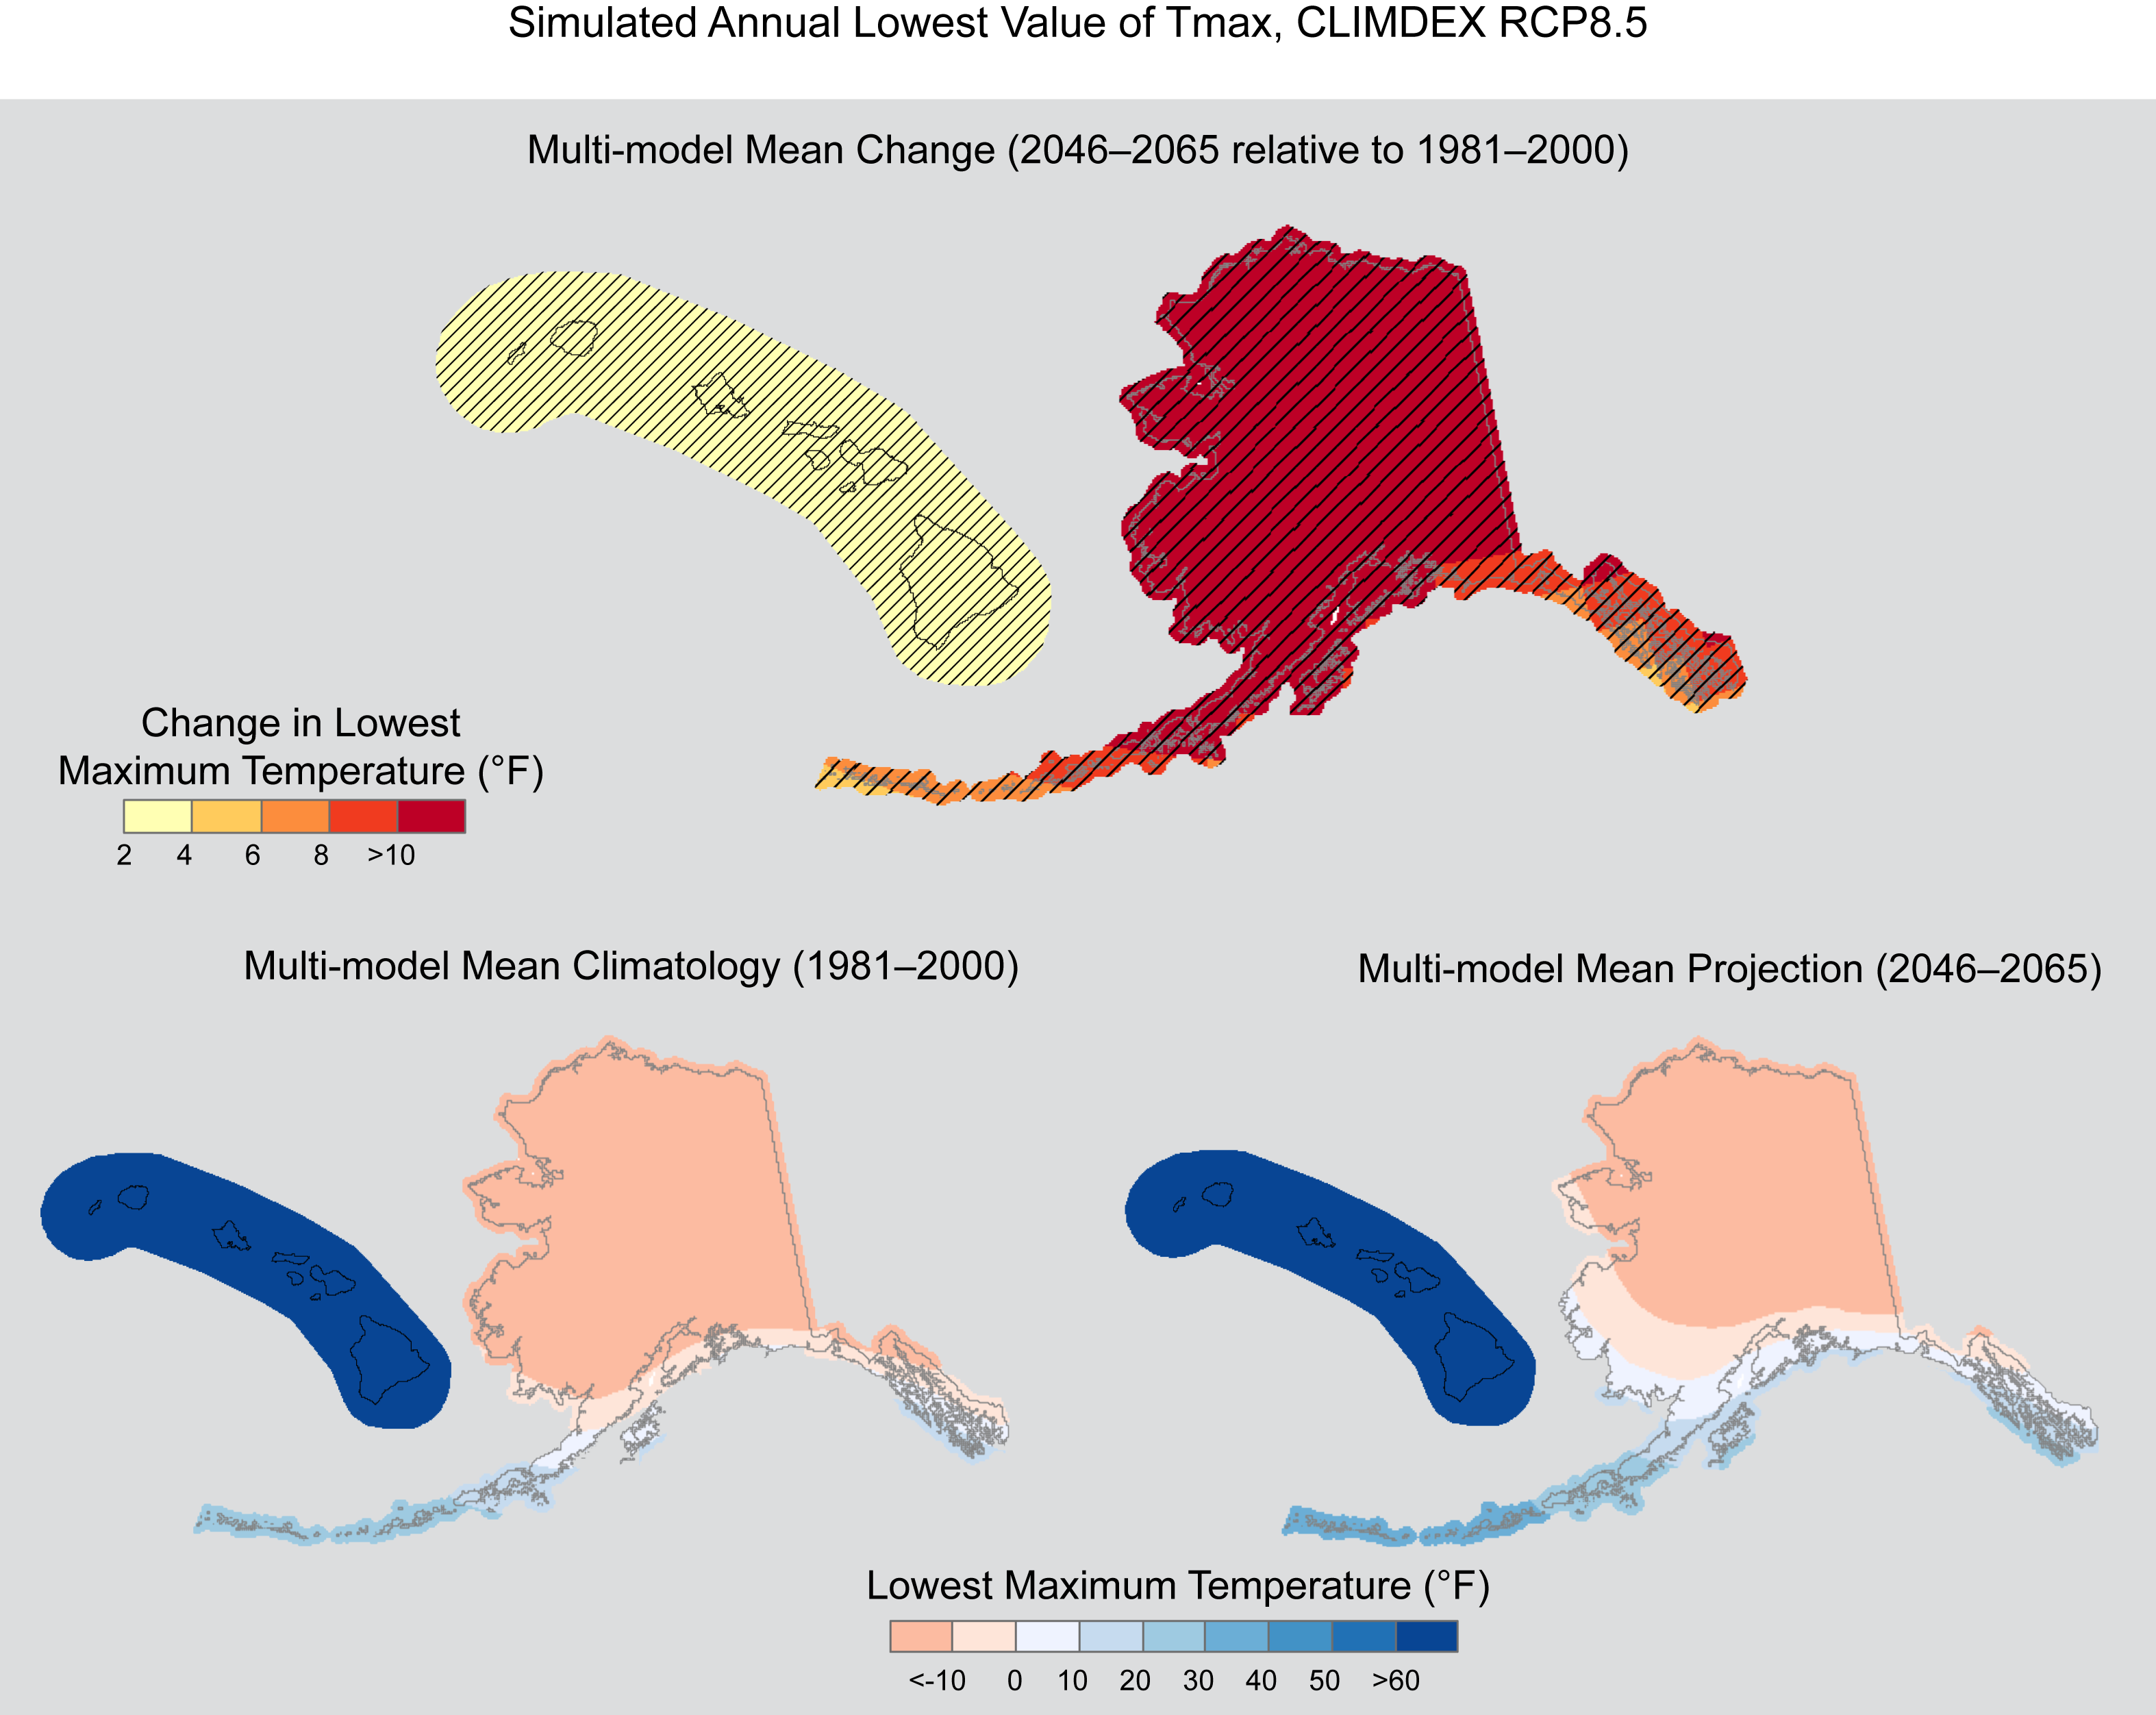
Simulated Annual Lowest Value of Tmax, CLIMDEX RCP8.5 (Alaska and Hawaii)
Simulated multi-model mean change in the annual lowest value of daily maximum temperature (TXn) for Alaska and Hawai‘i, for 2046–2065 with respect to the reference period of 1981–2000, using the CLIMDEX RCP8.5 scenario (top). Color with hatching (category 3) indicates that more than 50% of the models show a statistically significant change, and more than 67% agree on the sign of the change (see Section 3). Multi-model mean climatology indicating the TXn for 1981–2000 (bottom left). Multi-model mean projection indicating the TXn for 2046–2065 (bottom right).

Simulated Annual Lowest Value of Tmax, CLIMDEX RCP8.5
Simulated multi-model mean change in the annual lowest value of daily maximum temperature (TXn) for the contiguous United States, for 2046–2065 with respect to the reference period of 1981–2000, using the CLIMDEX RCP8.5 scenario (top). Color with hatching (category 3) indicates that more than 50% of the models show a statistically significant change, and more than 67% agree on the sign of the change (see Section 3). Multi-model mean climatology indicating the TXn for 1981–2000 (bottom left). Multi-model mean projection indicating the TXn for 2046–2065 (bottom right).

Simulated Change in Annual Highest Value of Maximum Temperature, CLIMDEX
Simulated change in the annual highest value of daily maximum temperature (TXx) for each region and the contiguous United States, for 2046–2065 with respect to the reference period of 1981–2000. The upper panel shows values for the CLIMDEX SRES B1 (blue), A1B (green), and A2 (red) scenarios. The lower panel shows values for the CLIMDEX RCP2.6 (dark teal), 4.5 (light teal), 6.0 (yellow), and 8.5 (dark red) scenarios. Bars indicate the interquartile ranges of model values and circles depict the multi-model means.
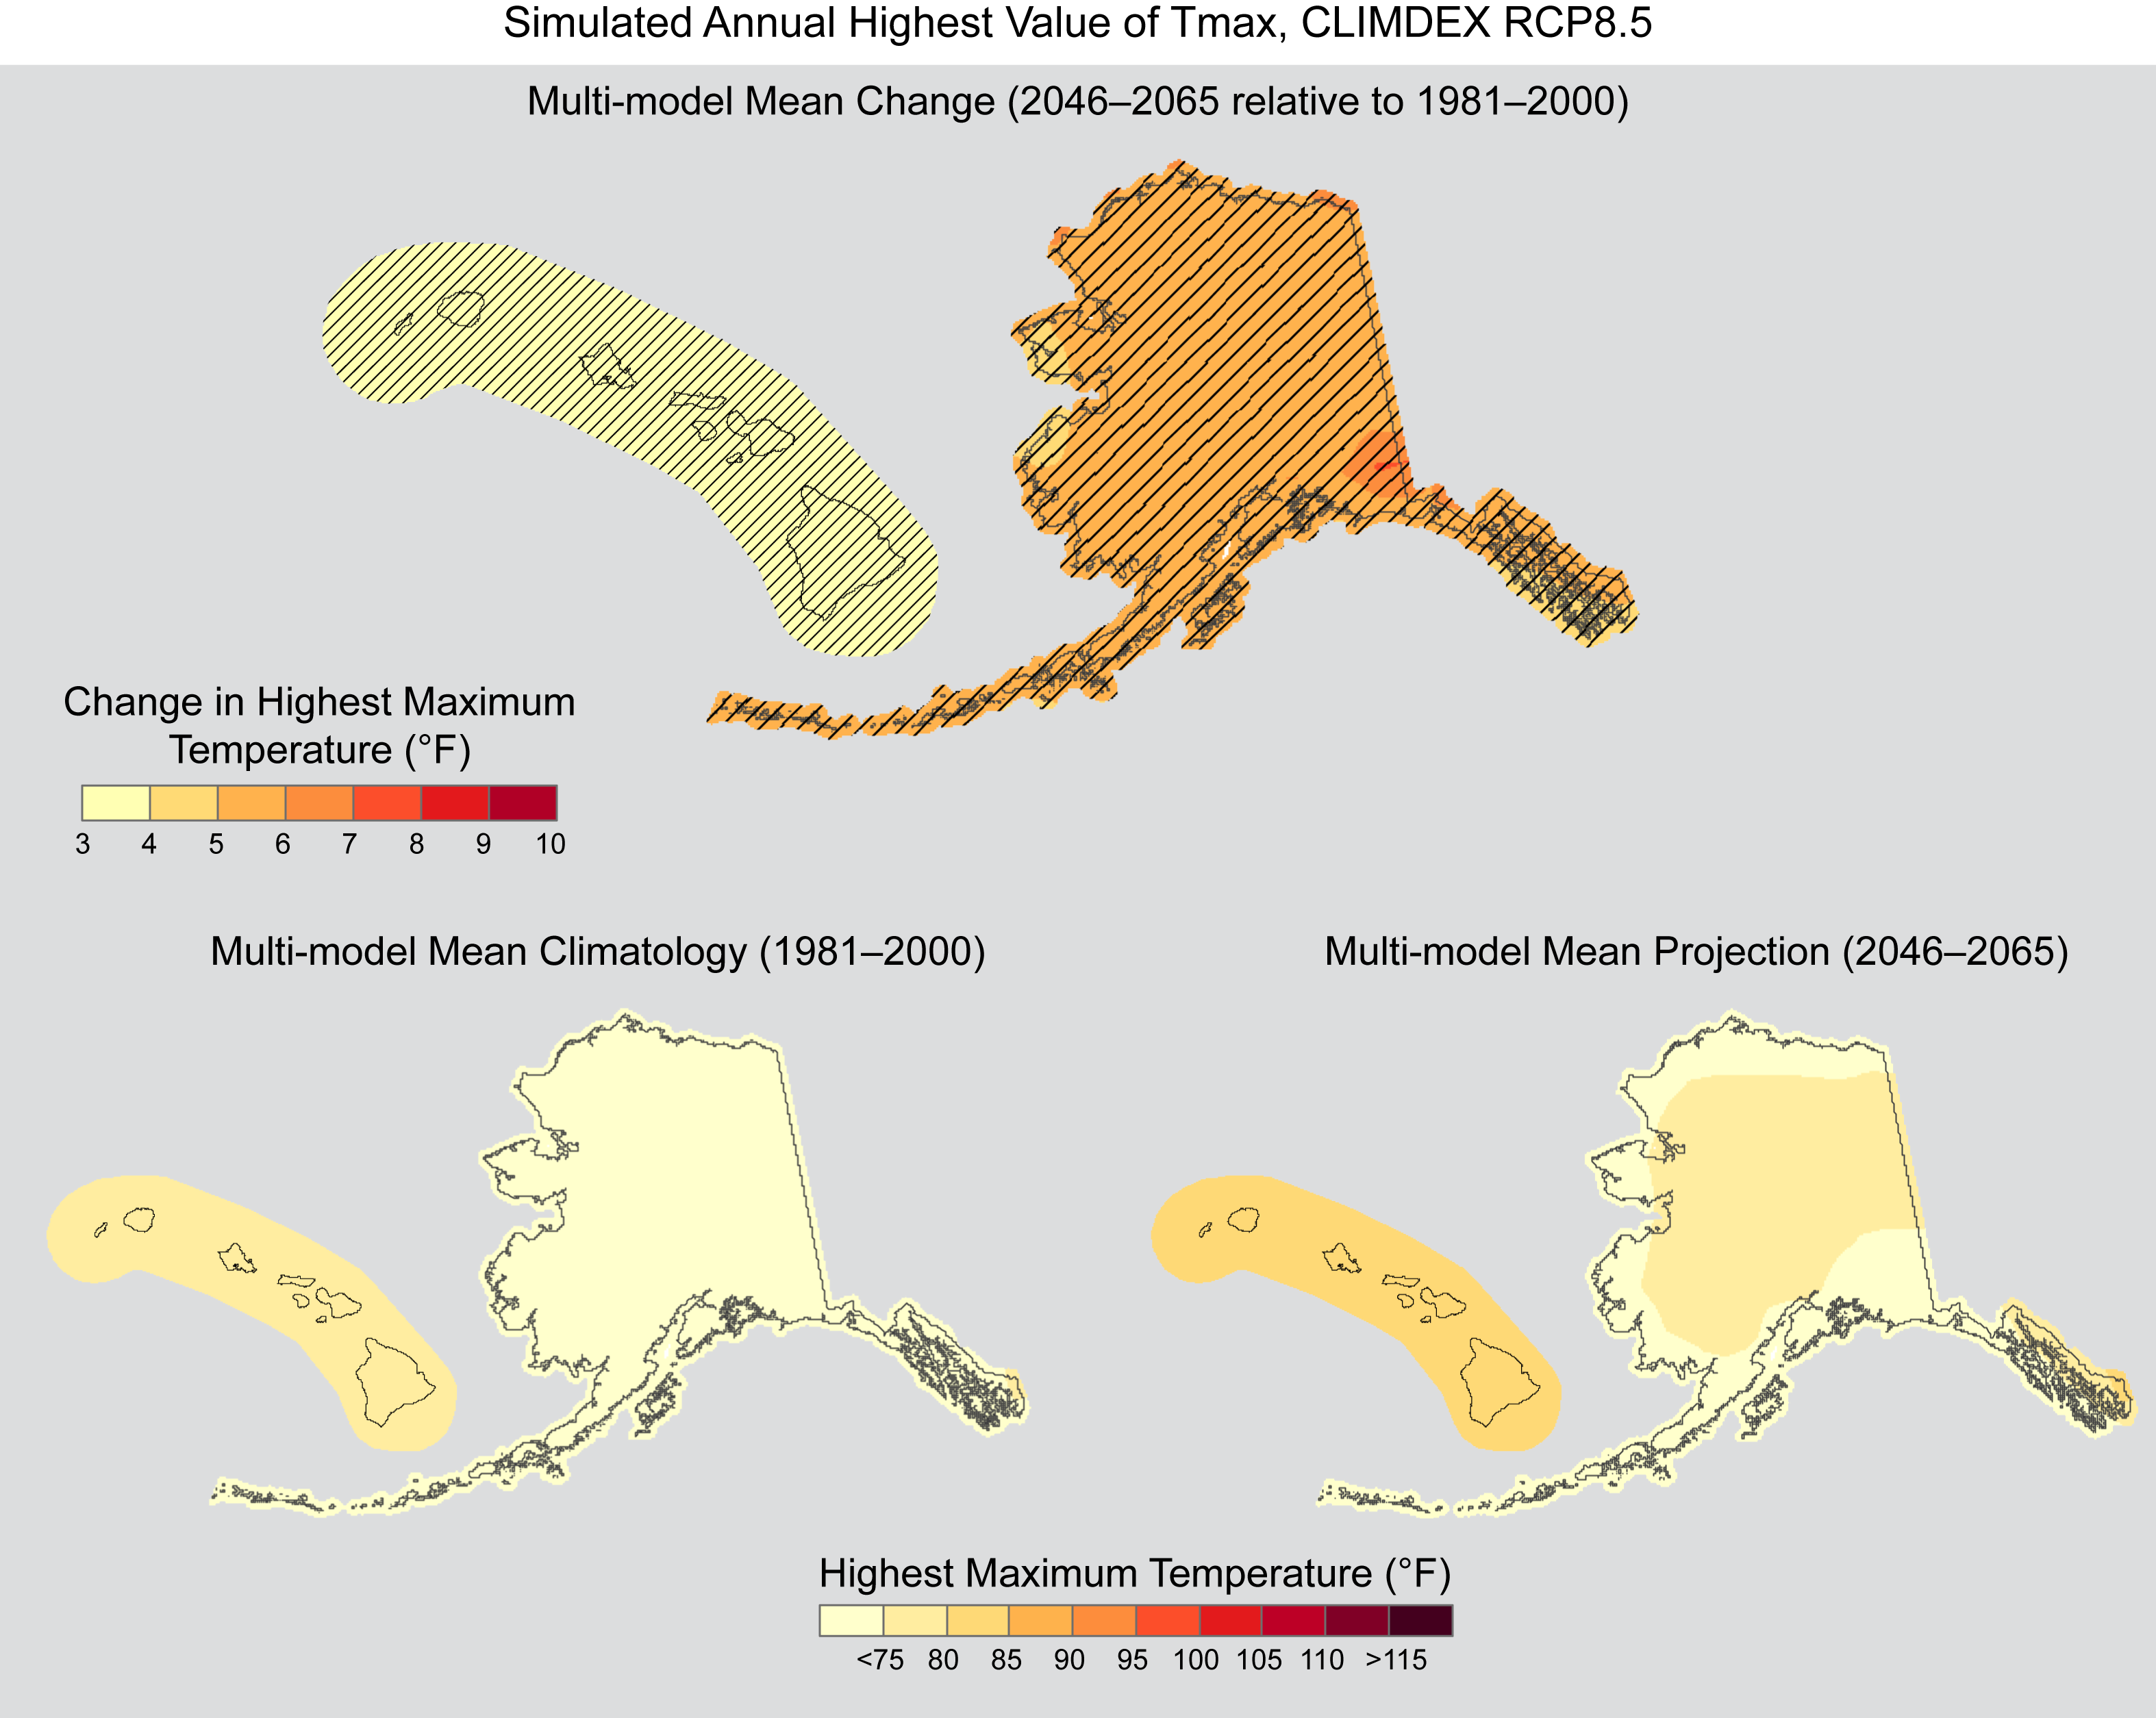
Simulated Annual Highest Value of Tmax, CLIMDEX RCP8.5 (Alaska and Hawaii)
Simulated multi-model mean change in the annual highest value of daily maximum temperature (TXx) for Alaska and Hawai‘i, for 2046–2065 with respect to the reference period of 1981–2000, using the CLIMDEX RCP8.5 scenario (top). Color with hatching (category 3) indicates that more than 50% of the models show a statistically significant change, and more than 67% agree on the sign of the change (see Section 3). Multi-model mean climatology indicating the TXx for 1981–000 (bottom left). Multi-model mean projection indicating the TXx for 2046–2065 (bottom right).
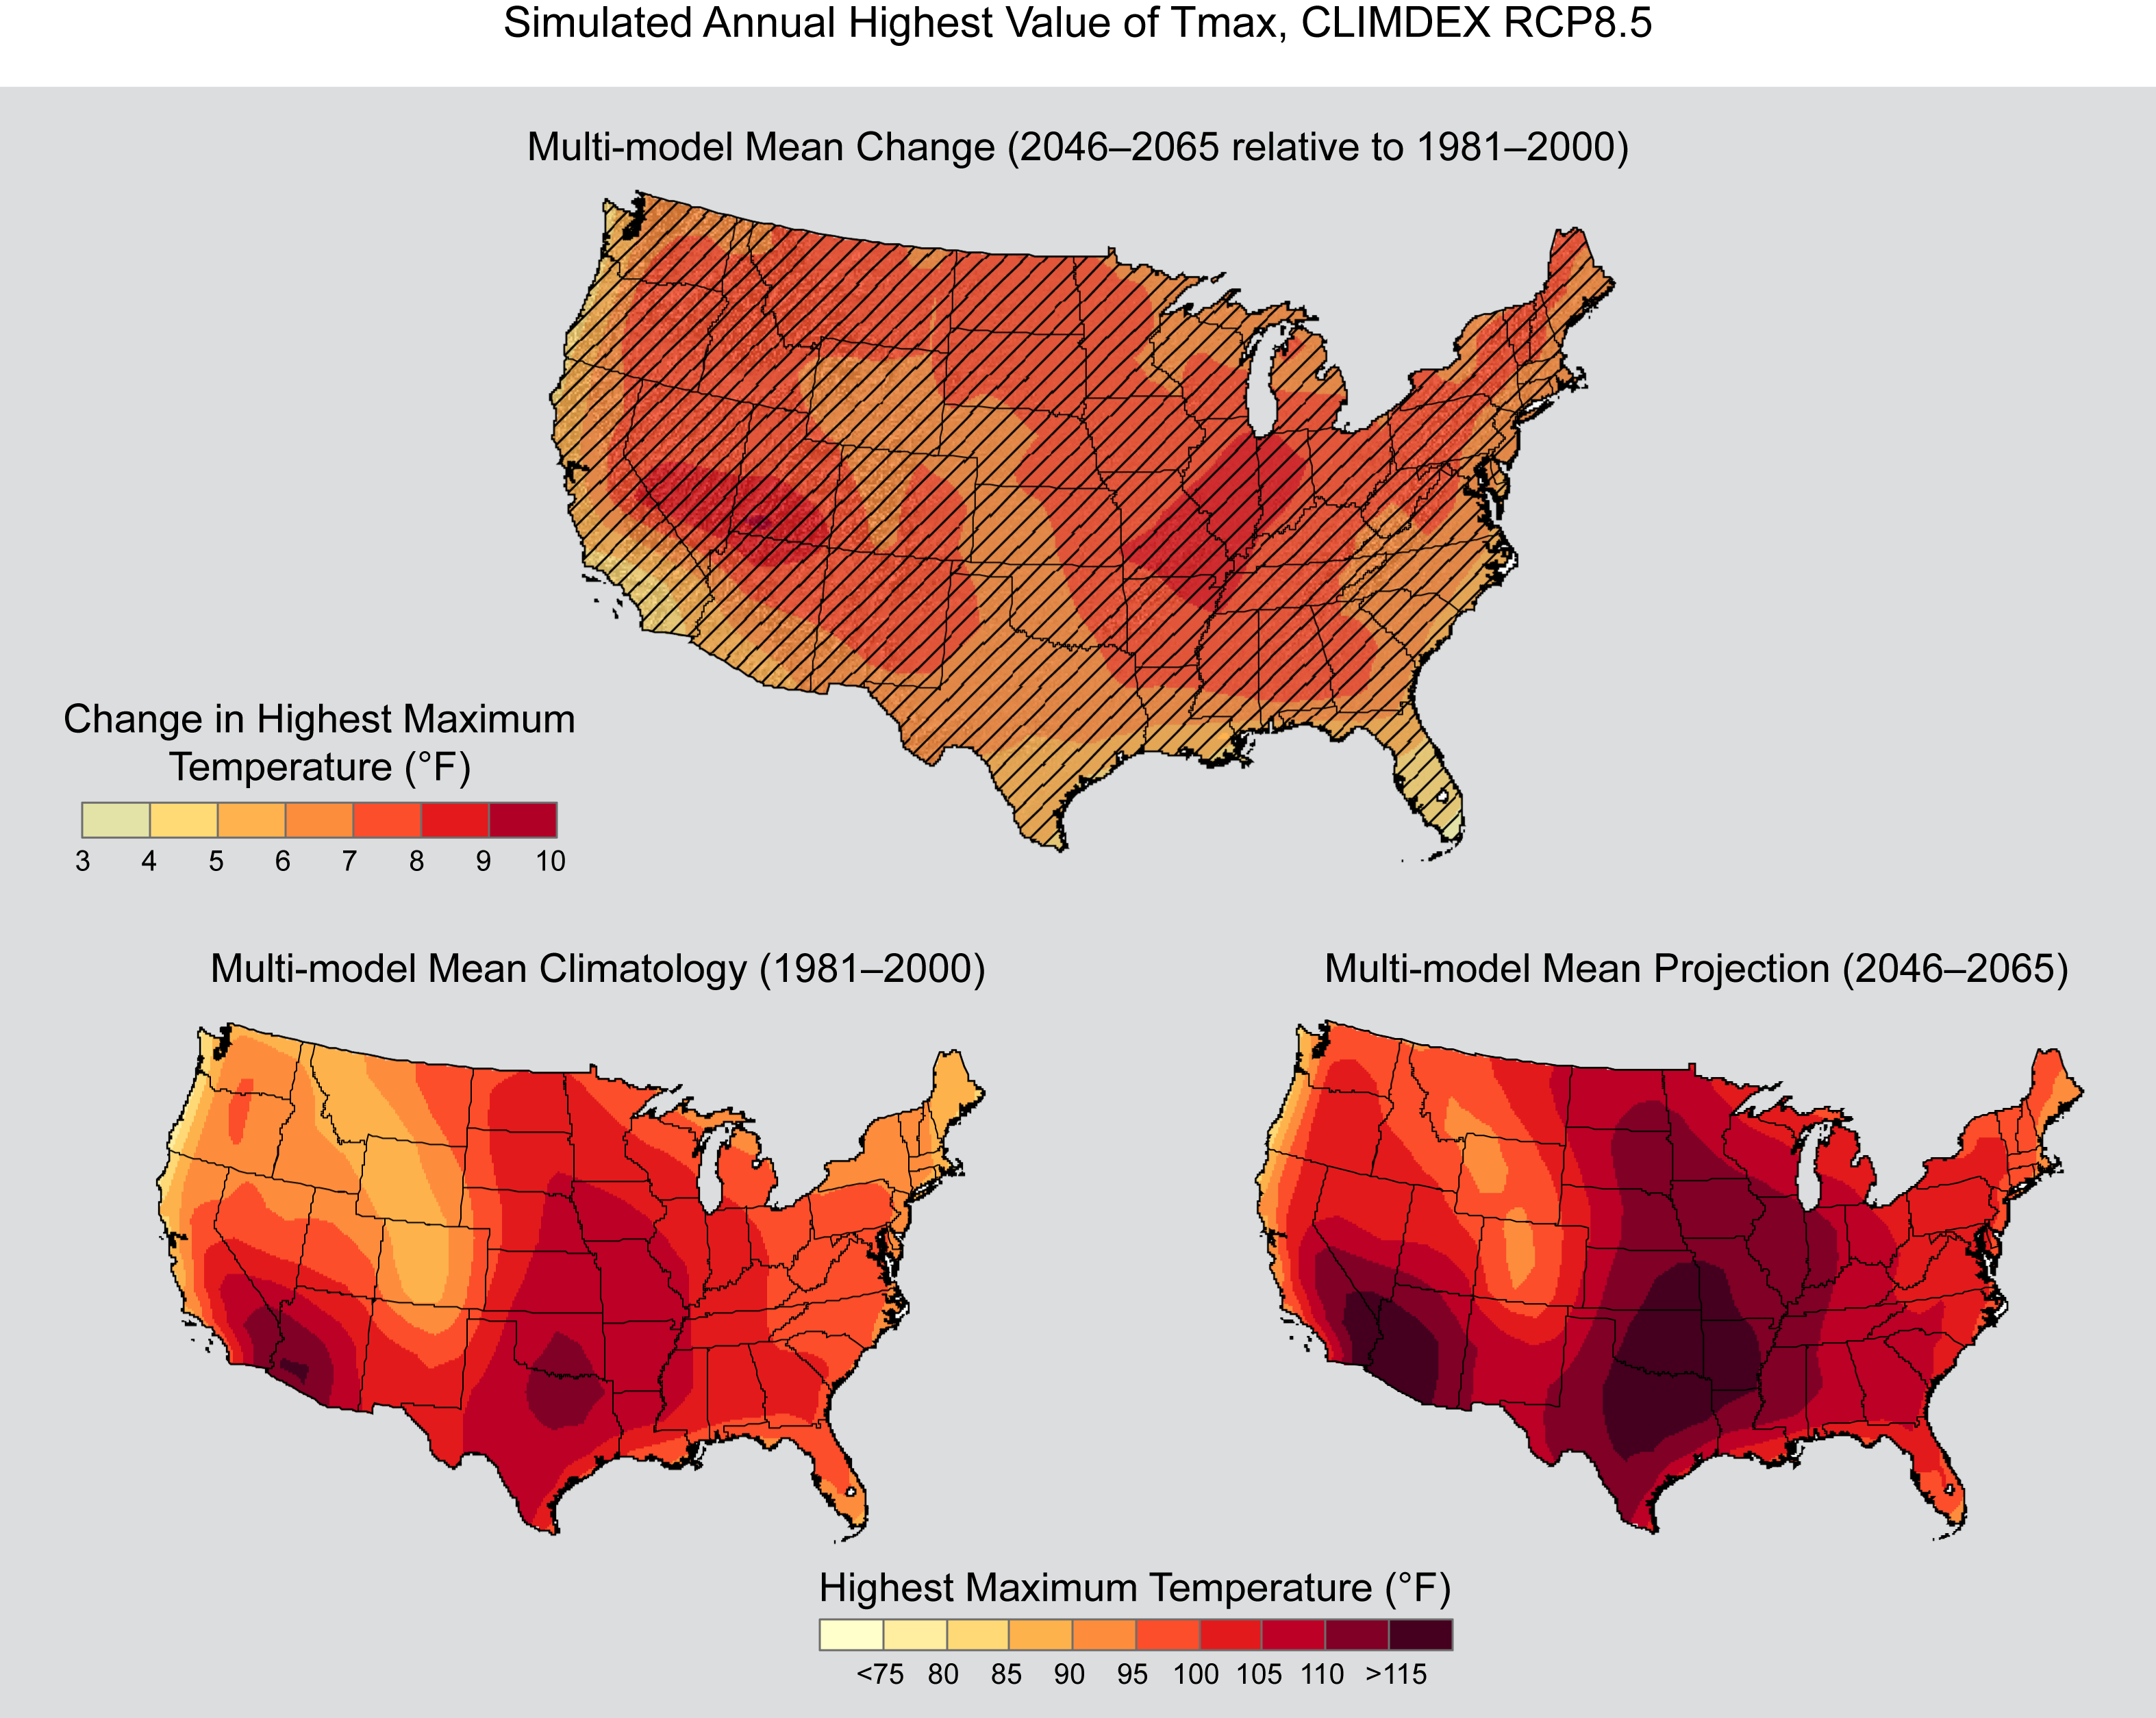
Simulated Annual Highest Value of Tmax, CLIMDEX RCP8.5
Simulated multi-model mean change in the annual highest value of daily maximum temperature (TXx) for the contiguous United States, for 2046–2065 with respect to the reference period of 1981–2000, using the CLIMDEX RCP8.5 scenario (top). Color with hatching (category 3) indicates that more than 50% of the models show a statistically significant change, and more than 67% agree on the sign of the change (see Section 3). Multi-model mean climatology indicating the TXx for 1981–2000 (bottom left). Multi-model mean projection indicating the TXx for 2046–2065 (bottom right).
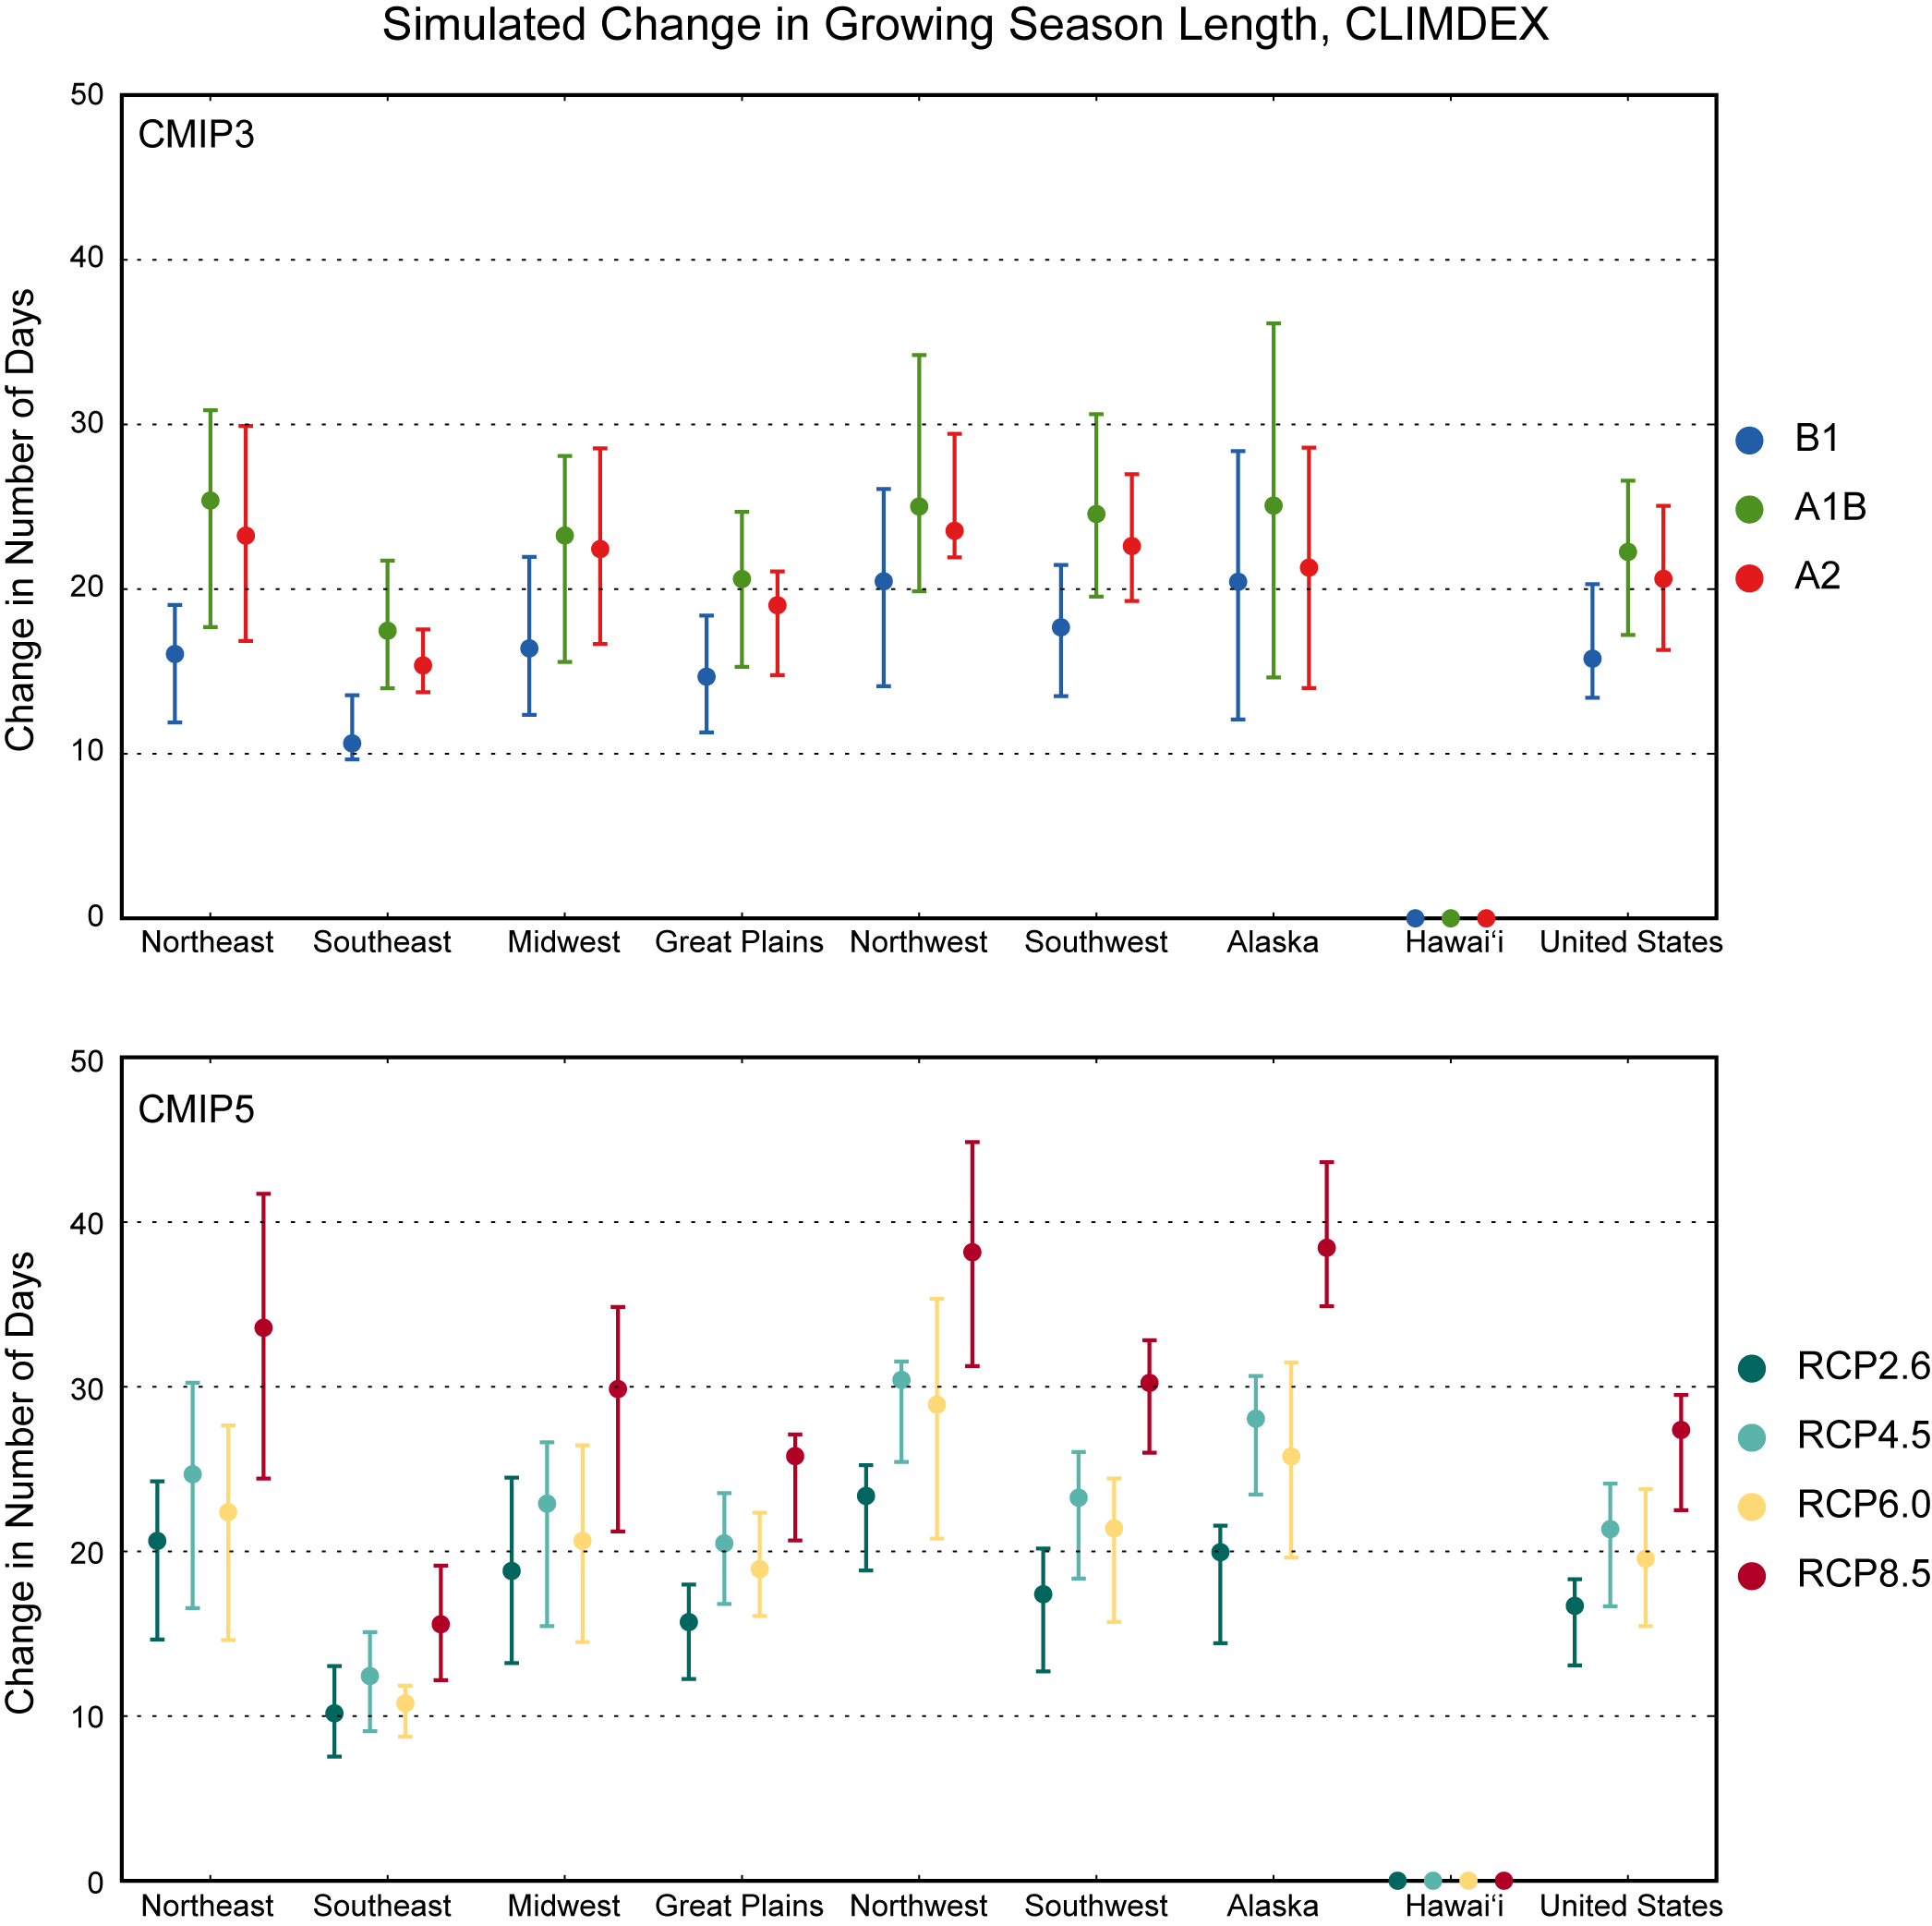
Simulated Change in Growing Season Length, CLIMDEX
Simulated change in the growing season length (GSL) for each region and the contiguous United States, for 2046–2065 with respect to the reference period of 1981–2000. The upper panel shows values for the CLIMDEX SRES B1 (blue), A1B (green), and A2 (red) scenarios. The lower panel shows values for the CLIMDEX RCP2.6 (dark teal), 4.5 (light teal), 6.0 (yellow), and 8.5 (dark red) scenarios. Bars indicate the interquartile ranges of model values and circles depict the multi-model means.

Simulated Growing Season Length, CLIMDEX RCP8.5 (Alaska and Hawaii)
Simulated multi-model mean change in the growing season length (GSL) for Alaska and Hawai‘i, for 2046–2065 with respect to the reference period of 1981–2000, using the CLIMDEX RCP8.5 scenario (top). Color only (category 1) indicates that less than 50% of the models show a statistically significant change. Color with hatching (category 3) indicates that more than 50% of the models show a statistically significant change, and more than 67% agree on the sign of the change (see Section 3). Multi- model mean climatology indicating the GSL for 1981–2000 (bottom left). Multi-model mean projection indicating the GSL for 2046–2065 (bottom right).
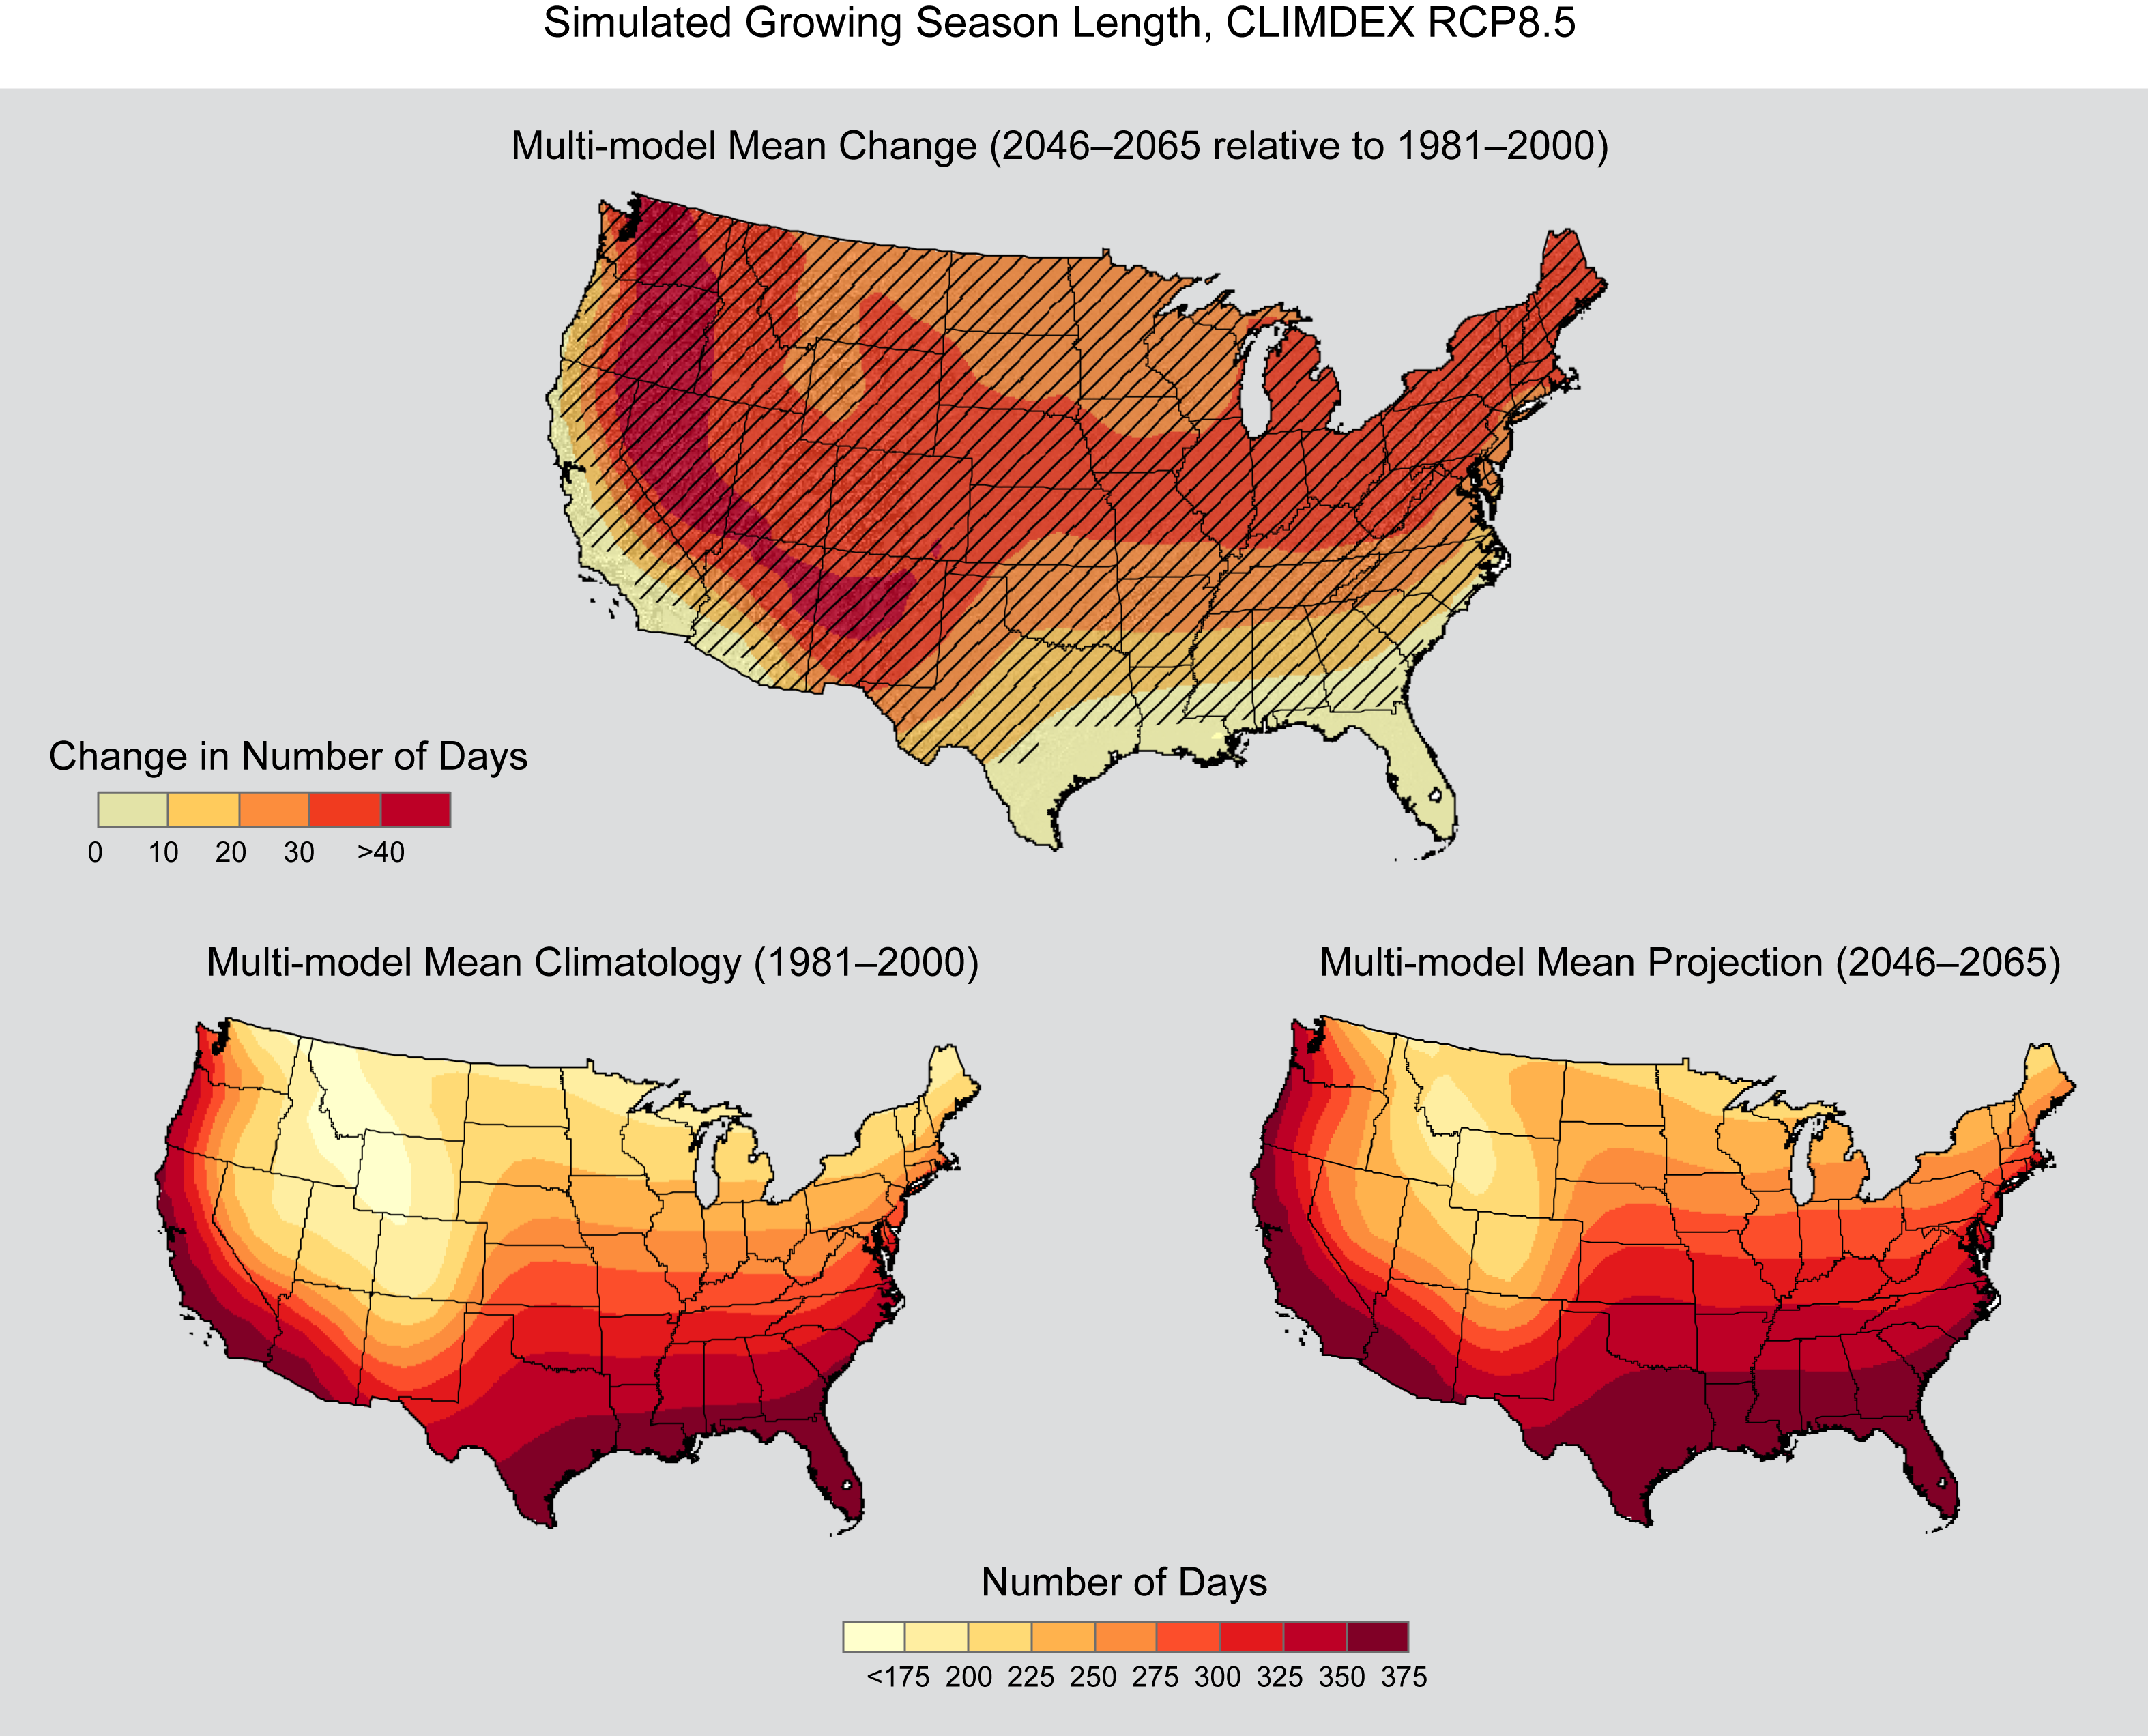
Simulated Growing Season Length, CLIMDEX RCP8.5
Simulated multi-model mean change in the growing season length (GSL) for the contiguous United States, for 2046–2065 with respect to the reference period of 1981–2000, using the CLIMDEX RCP8.5 scenario (top). Color only (category 1) indicates that less than 50% of the models show a statistically significant change. Color with hatching (category 3) indicates that more than 50% of the models show a statistically significant change, and more than 67% agree on the sign of the change (see Section 3). Multi-model mean climatology indicating the GSL for 1981–2000 (bottom left). Multi-model mean projection indicating the GSL for 2046–2065 (bottom right).

Simulated Change in Number of Days with Tmin > 20°C, CLIMDEX
Simulated change in the mean annual number of days with a minimum temperature greater than 20°C for each region and the contiguous United States, for 2046–2065 with respect to the reference period of 1981–2000. The upper panel shows values for the CLIMDEX SRES B1 (blue), A1B (green), and A2 (red) scenarios. The lower panel shows values for the CLIMDEX RCP2.6 (dark teal), 4.5 (light teal), 6.0 (yellow), and 8.5 (dark red) scenarios. Bars indicate the interquartile ranges of model values and circles depict the multi-model means.
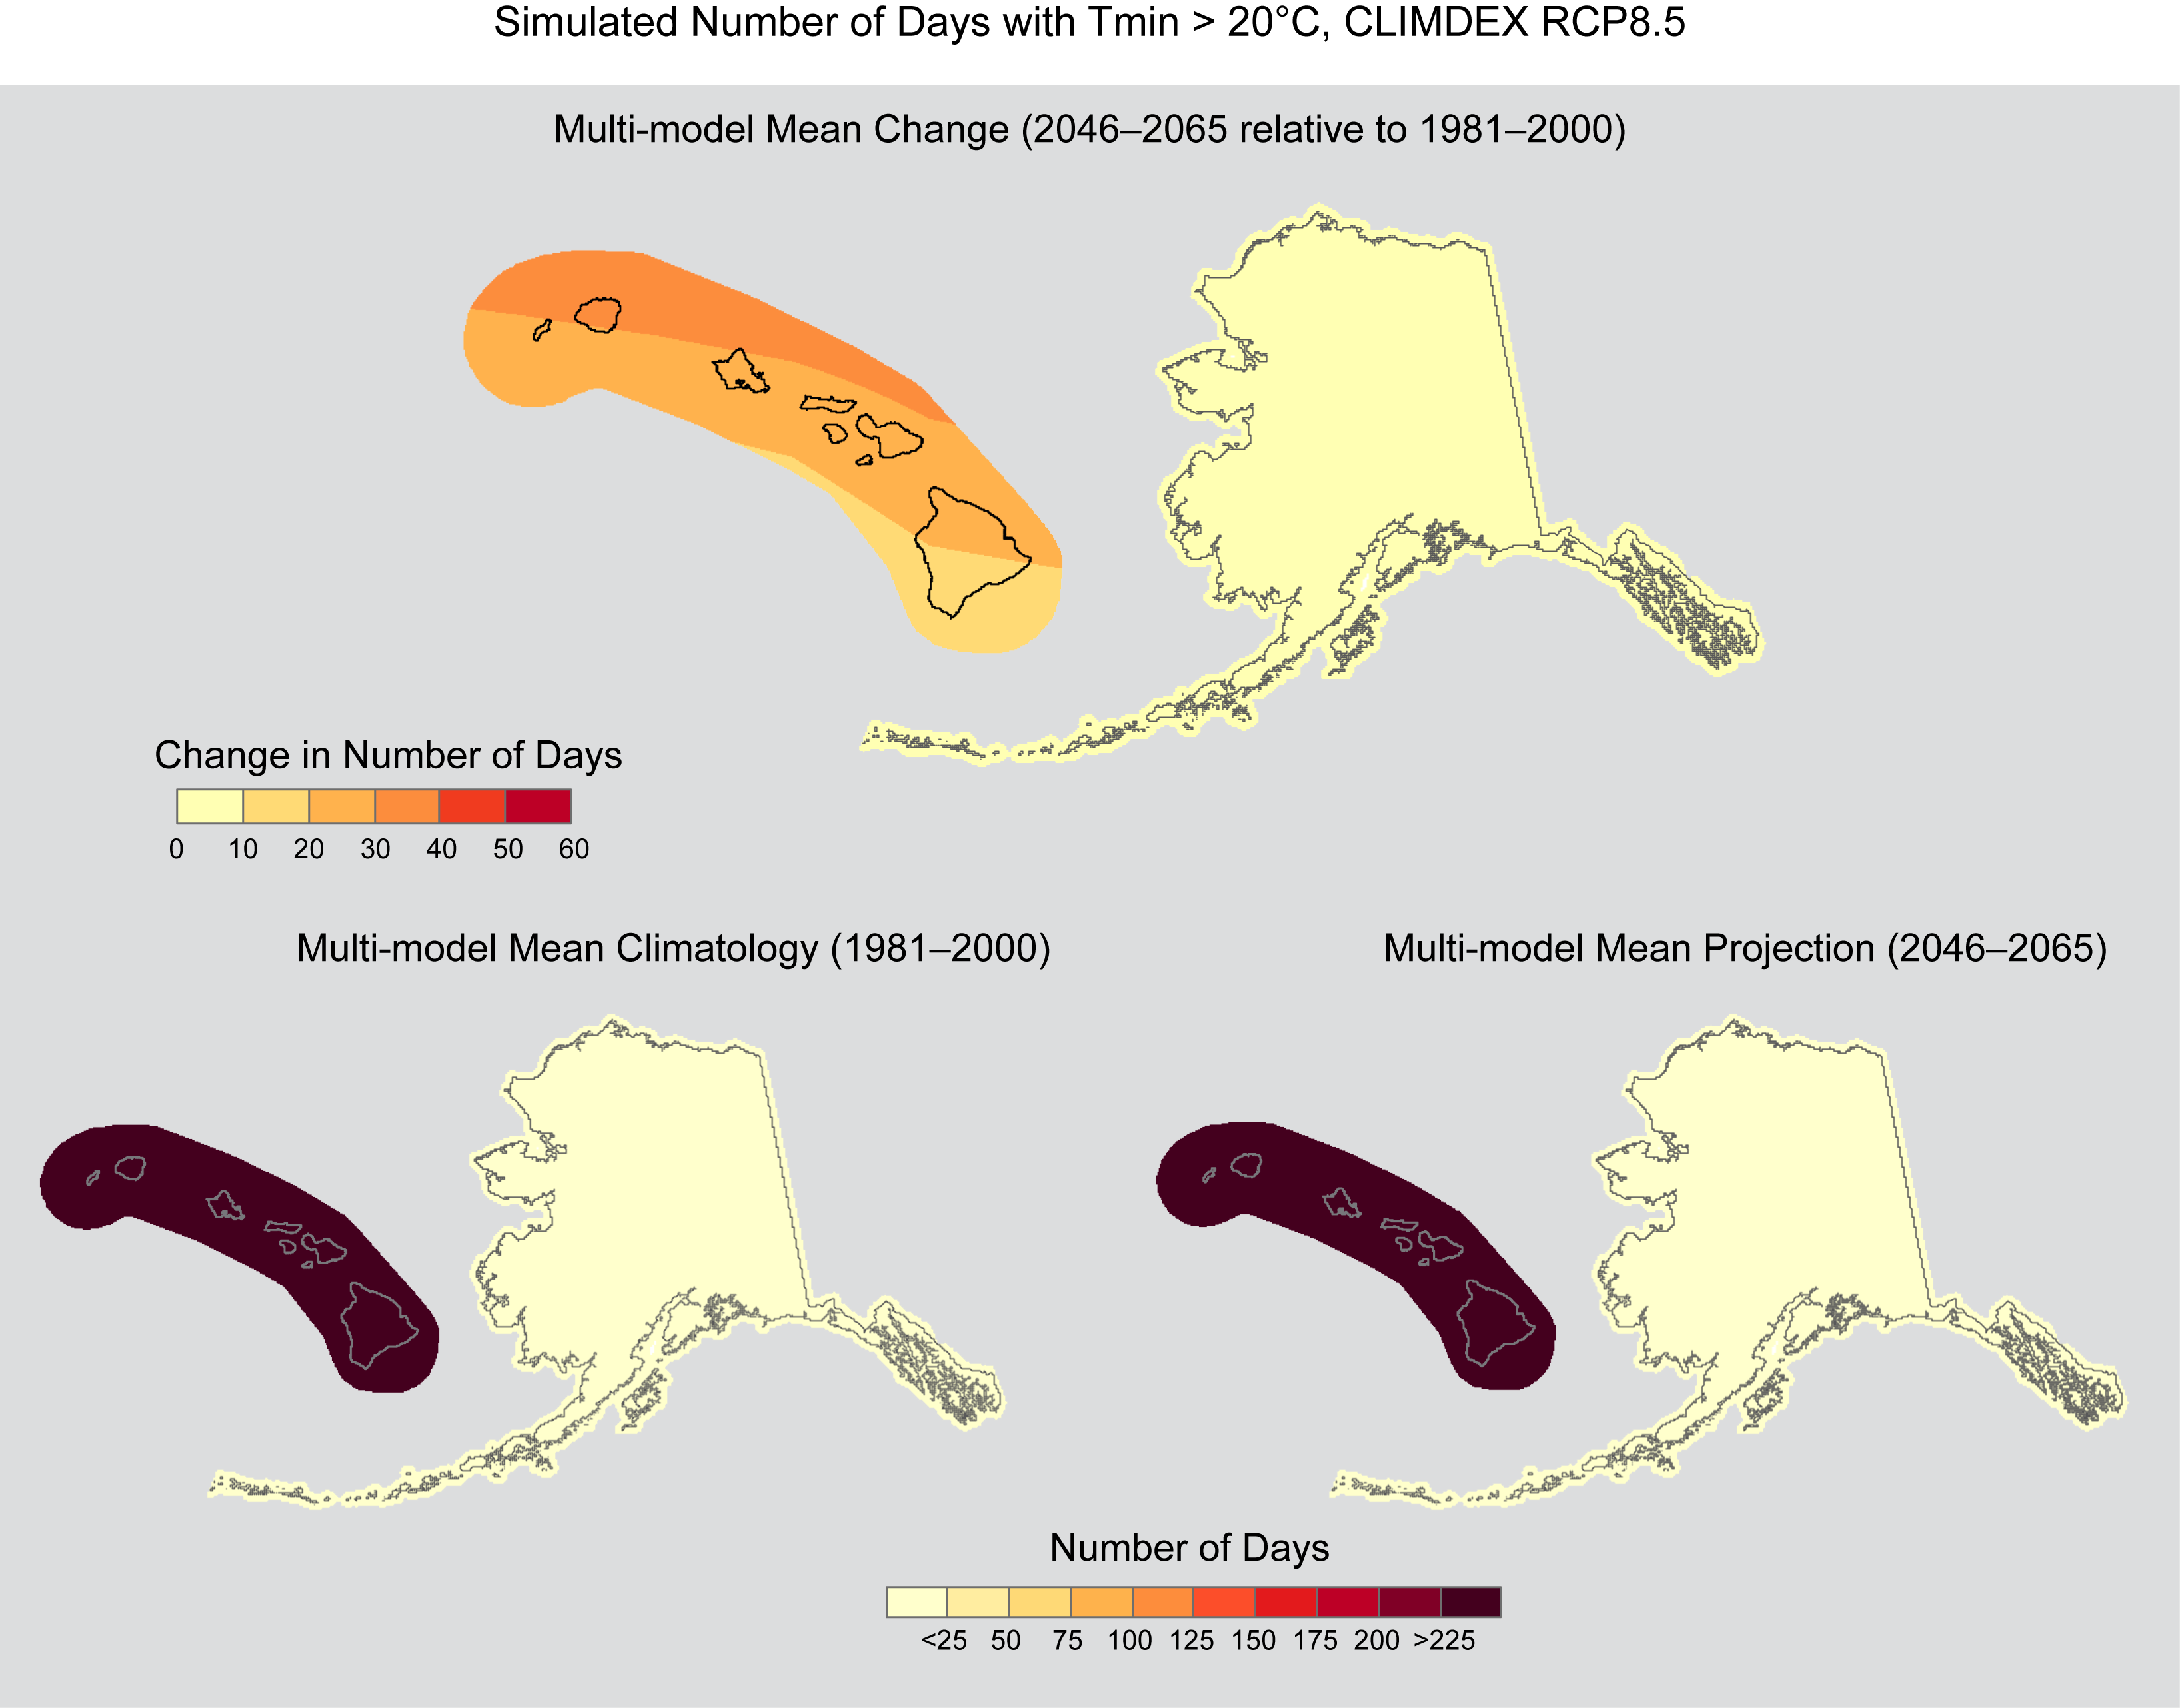
Simulated Number of Days with Tmin > 20°C, CLIMDEX RCP8.5 (Alaska and Hawaii)
Simulated multi-model mean change in the mean annual number of days with a minimum temperature greater than 20°C (Tmin > 20°C) for Alaska and Hawai‘i, for 2046–2065 with respect to the reference period of 1981–2000, using the CLIMDEX RCP8.5 scenario (top). Color only (category 1) indicates that less than 50% of the models show a statistically significant change (see Section 3). Multi-model mean climatology indicating the annual number of days with Tmin > 20°C for 1981–2000 (bottom left). Multi- model mean projection indicating the annual number of days with Tmin > 20°C for 2046–2065 (bottom right).
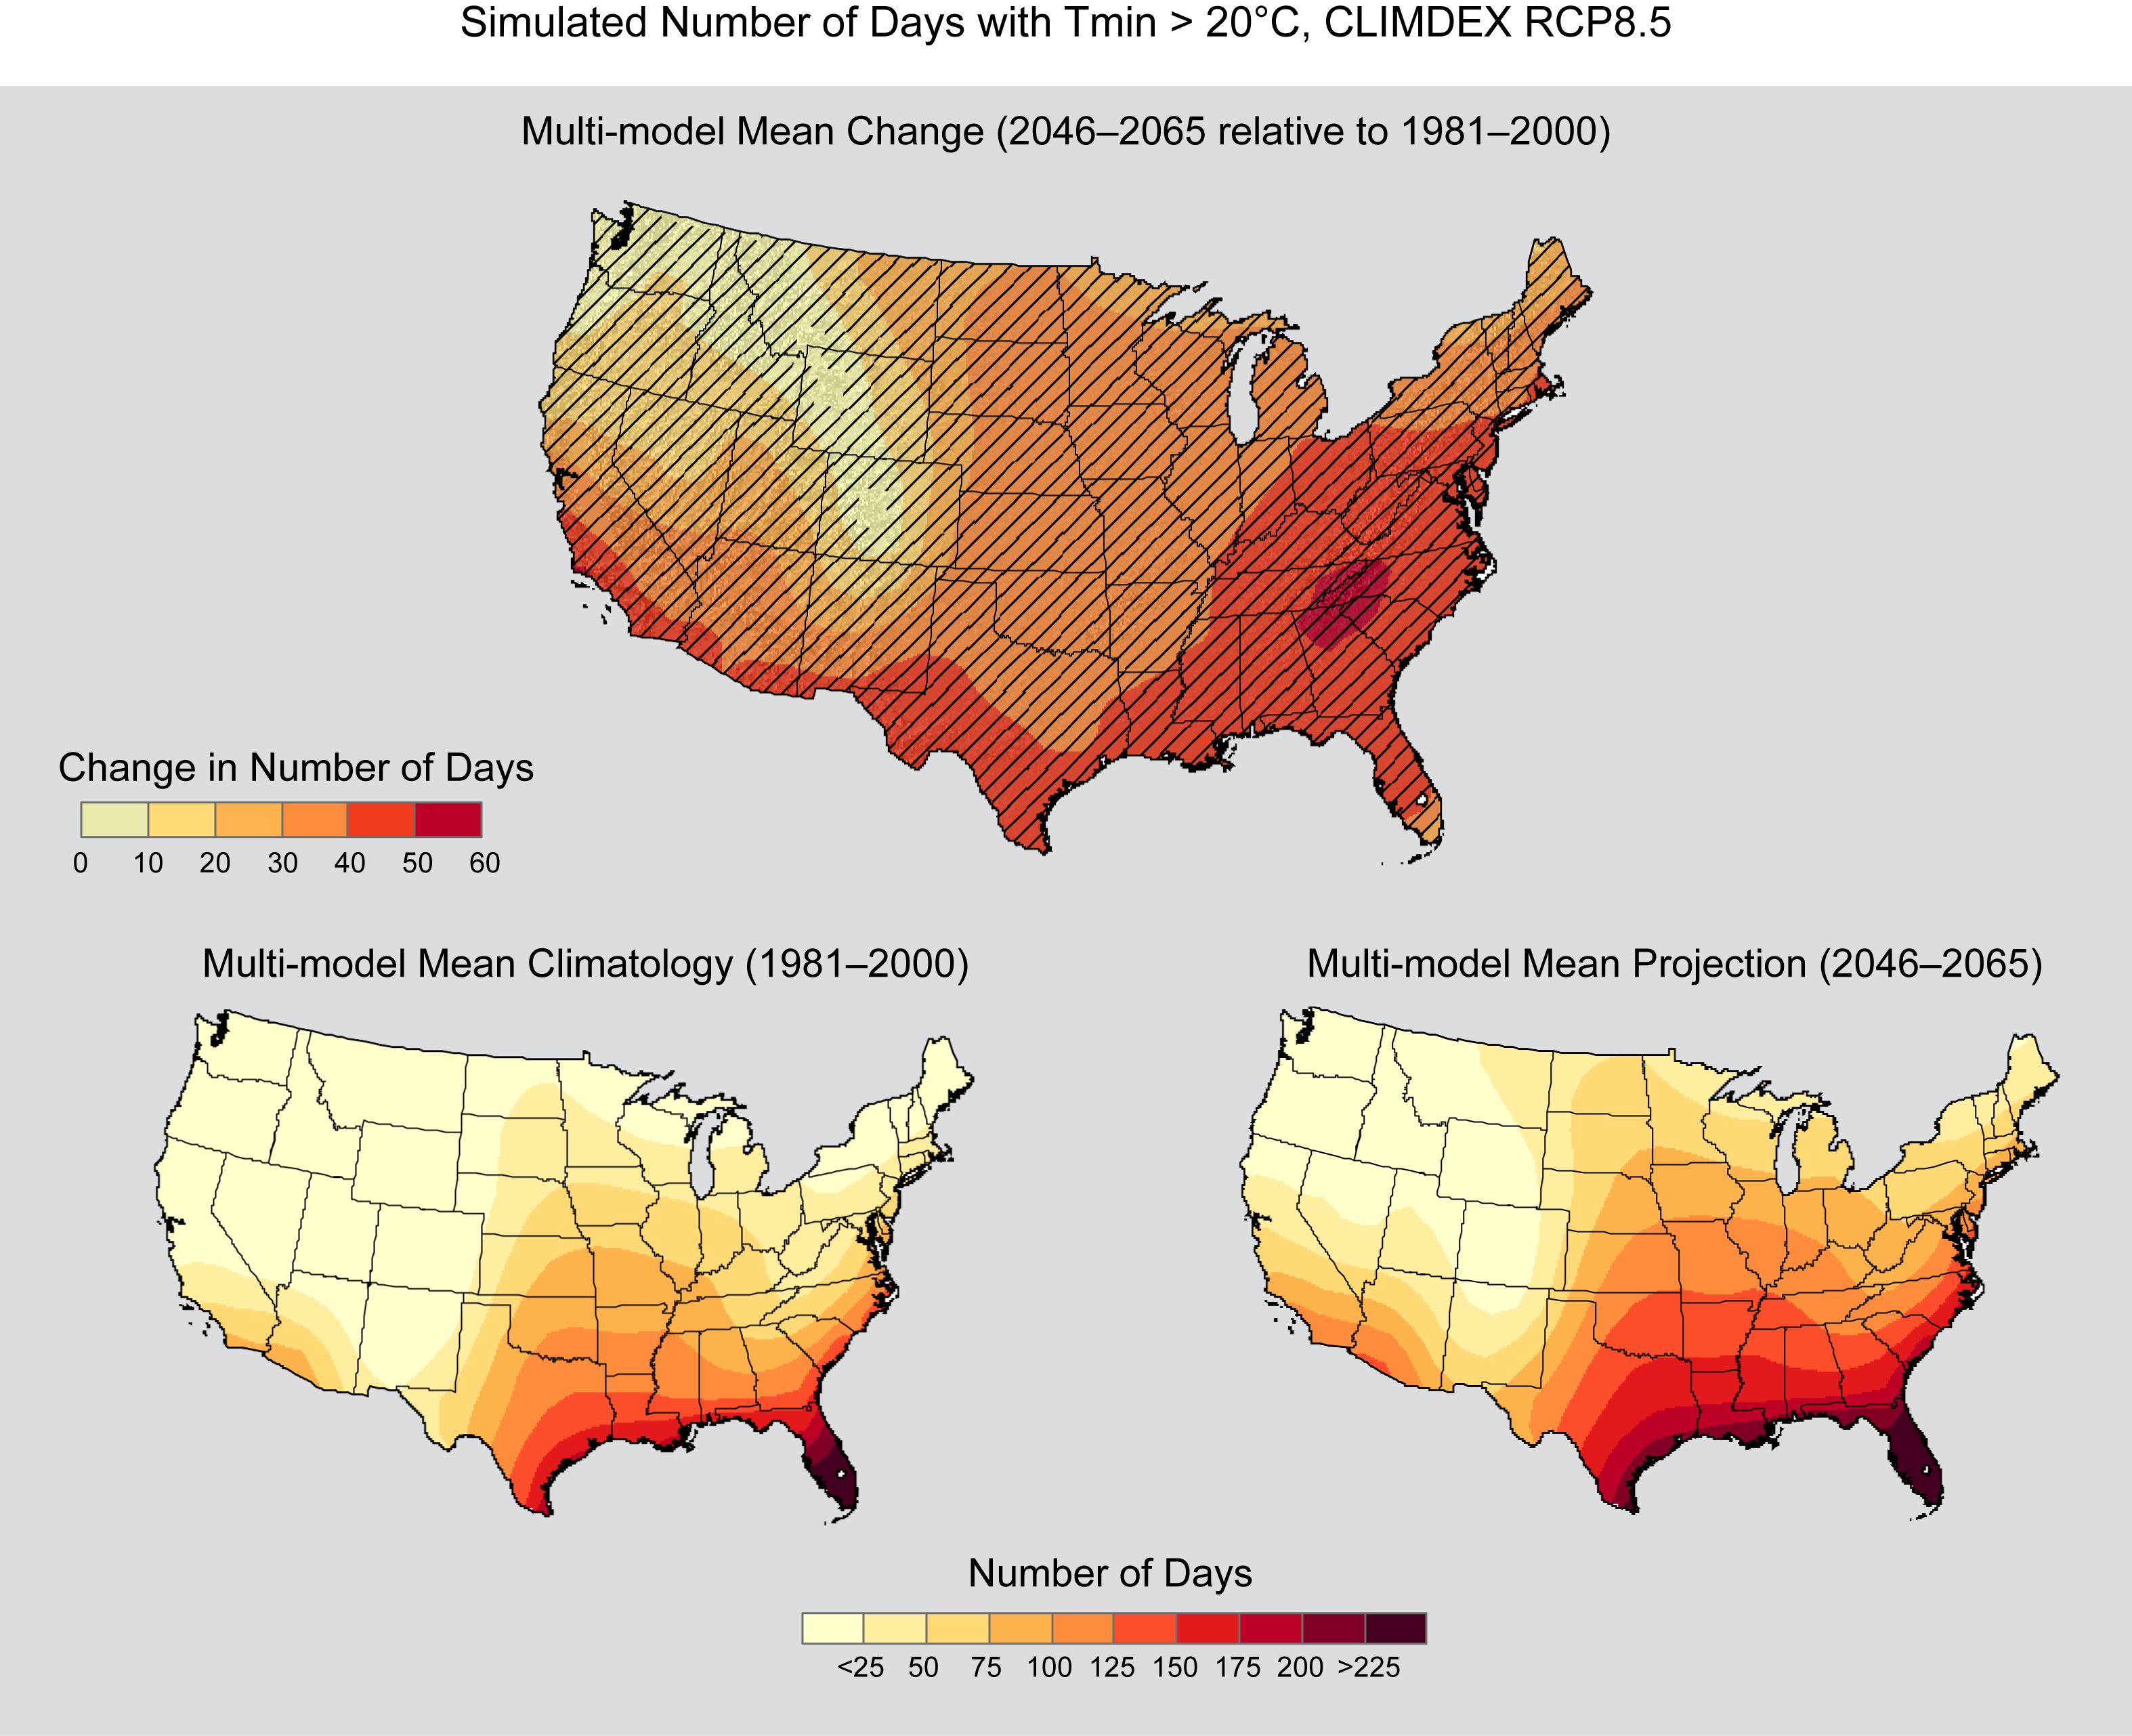
Simulated Number of Days with Tmin > 20°C, CLIMDEX RCP8.5
Simulated multi-model mean change in the mean annual number of days with a minimum temperature greater than 20°C (Tmin > 20°C) for the contiguous United States, for 2046–2065 with respect to the reference period of 1981–2000, using the CLIMDEX RCP8.5 scenario (top). Color only (category 1) indicates that less than 50% of the models show a statistically significant change. Color with hatching (category 3) indicates that more than 50% of the models show a statistically significant change, and more than 67% agree on the sign of the change (see Section 3). Multi-model mean climatology indicating the annual number of days with Tmin > 20°C for 1981–2000 (bottom left). Multi-model mean projection indicating the annual number of days with Tmin > 20°C for 2046–2065 (bottom right).

Simulated Change in Number of Days with Tmin < 0°C, CLIMDEX
Simulated change in the mean annual number of days with a minimum temperature less than 0°C for each region and the contiguous United States, for 2046–2065 with respect to the reference period of 1981–2000. The upper panel shows values for the CLIMDEX SRES B1 (blue), A1B (green), and A2 (red) scenarios. The lower panel shows values for the CLIMDEX RCP2.6 (dark teal), 4.5 (light teal), 6.0 (yellow), and 8.5 (dark red) scenarios. Bars indicate the interquartile ranges of model values and circles depict the multi-model means.
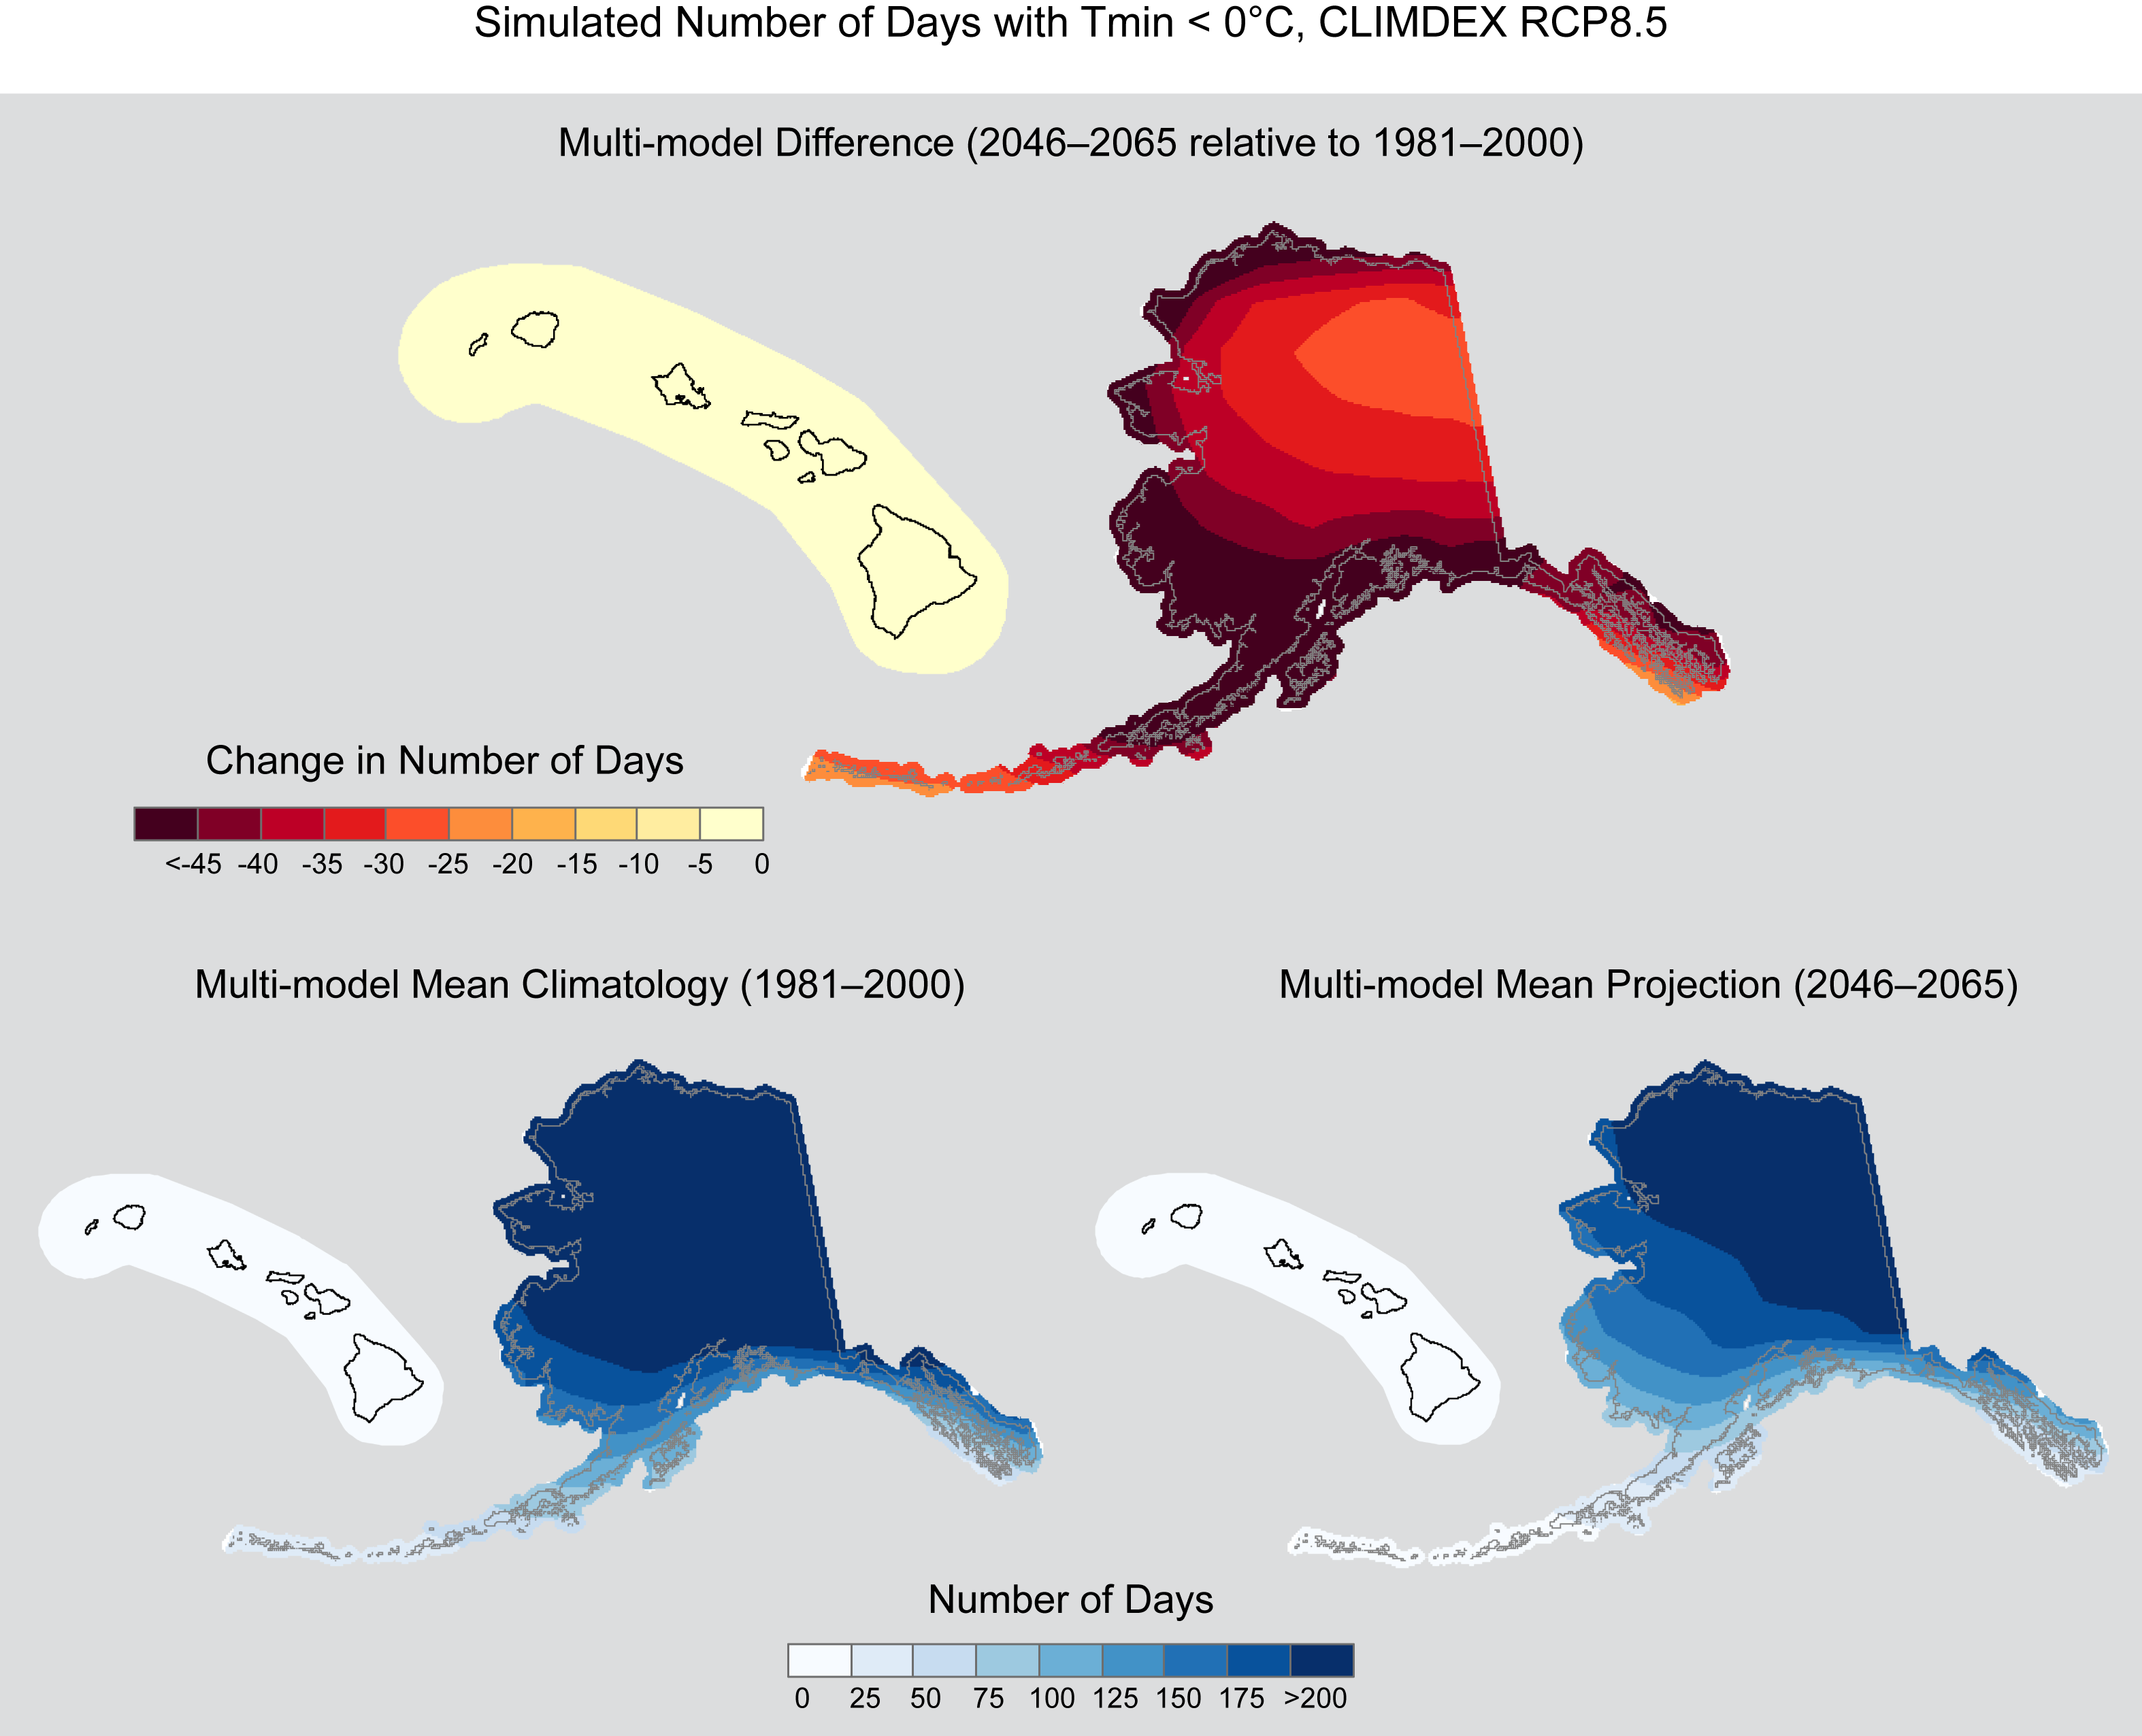
Simulated Number of Days with Tmin < 0°C, CLIMDEX RCP8.5 (Alaska and Hawaii)
Simulated multi-model mean change in the mean annual number of days with a minimum temperature less than 0°C (Tmin < 0°C) for Alaska and Hawai‘i, for 2046–2065 with respect to the reference period of 1981–2000, using the CLIMDEX RCP8.5 scenario (top). Color only (category 1) indicates that less than 50% of the models show a statistically significant change (see Section 3). Multi-model mean climatology indicating the annual number of days with Tmin < 0°C for 1981–2000 (bottom left). Multi-model mean projection indicating the annual number of days with Tmin < 0°C for 2046–2065 (bottom right).
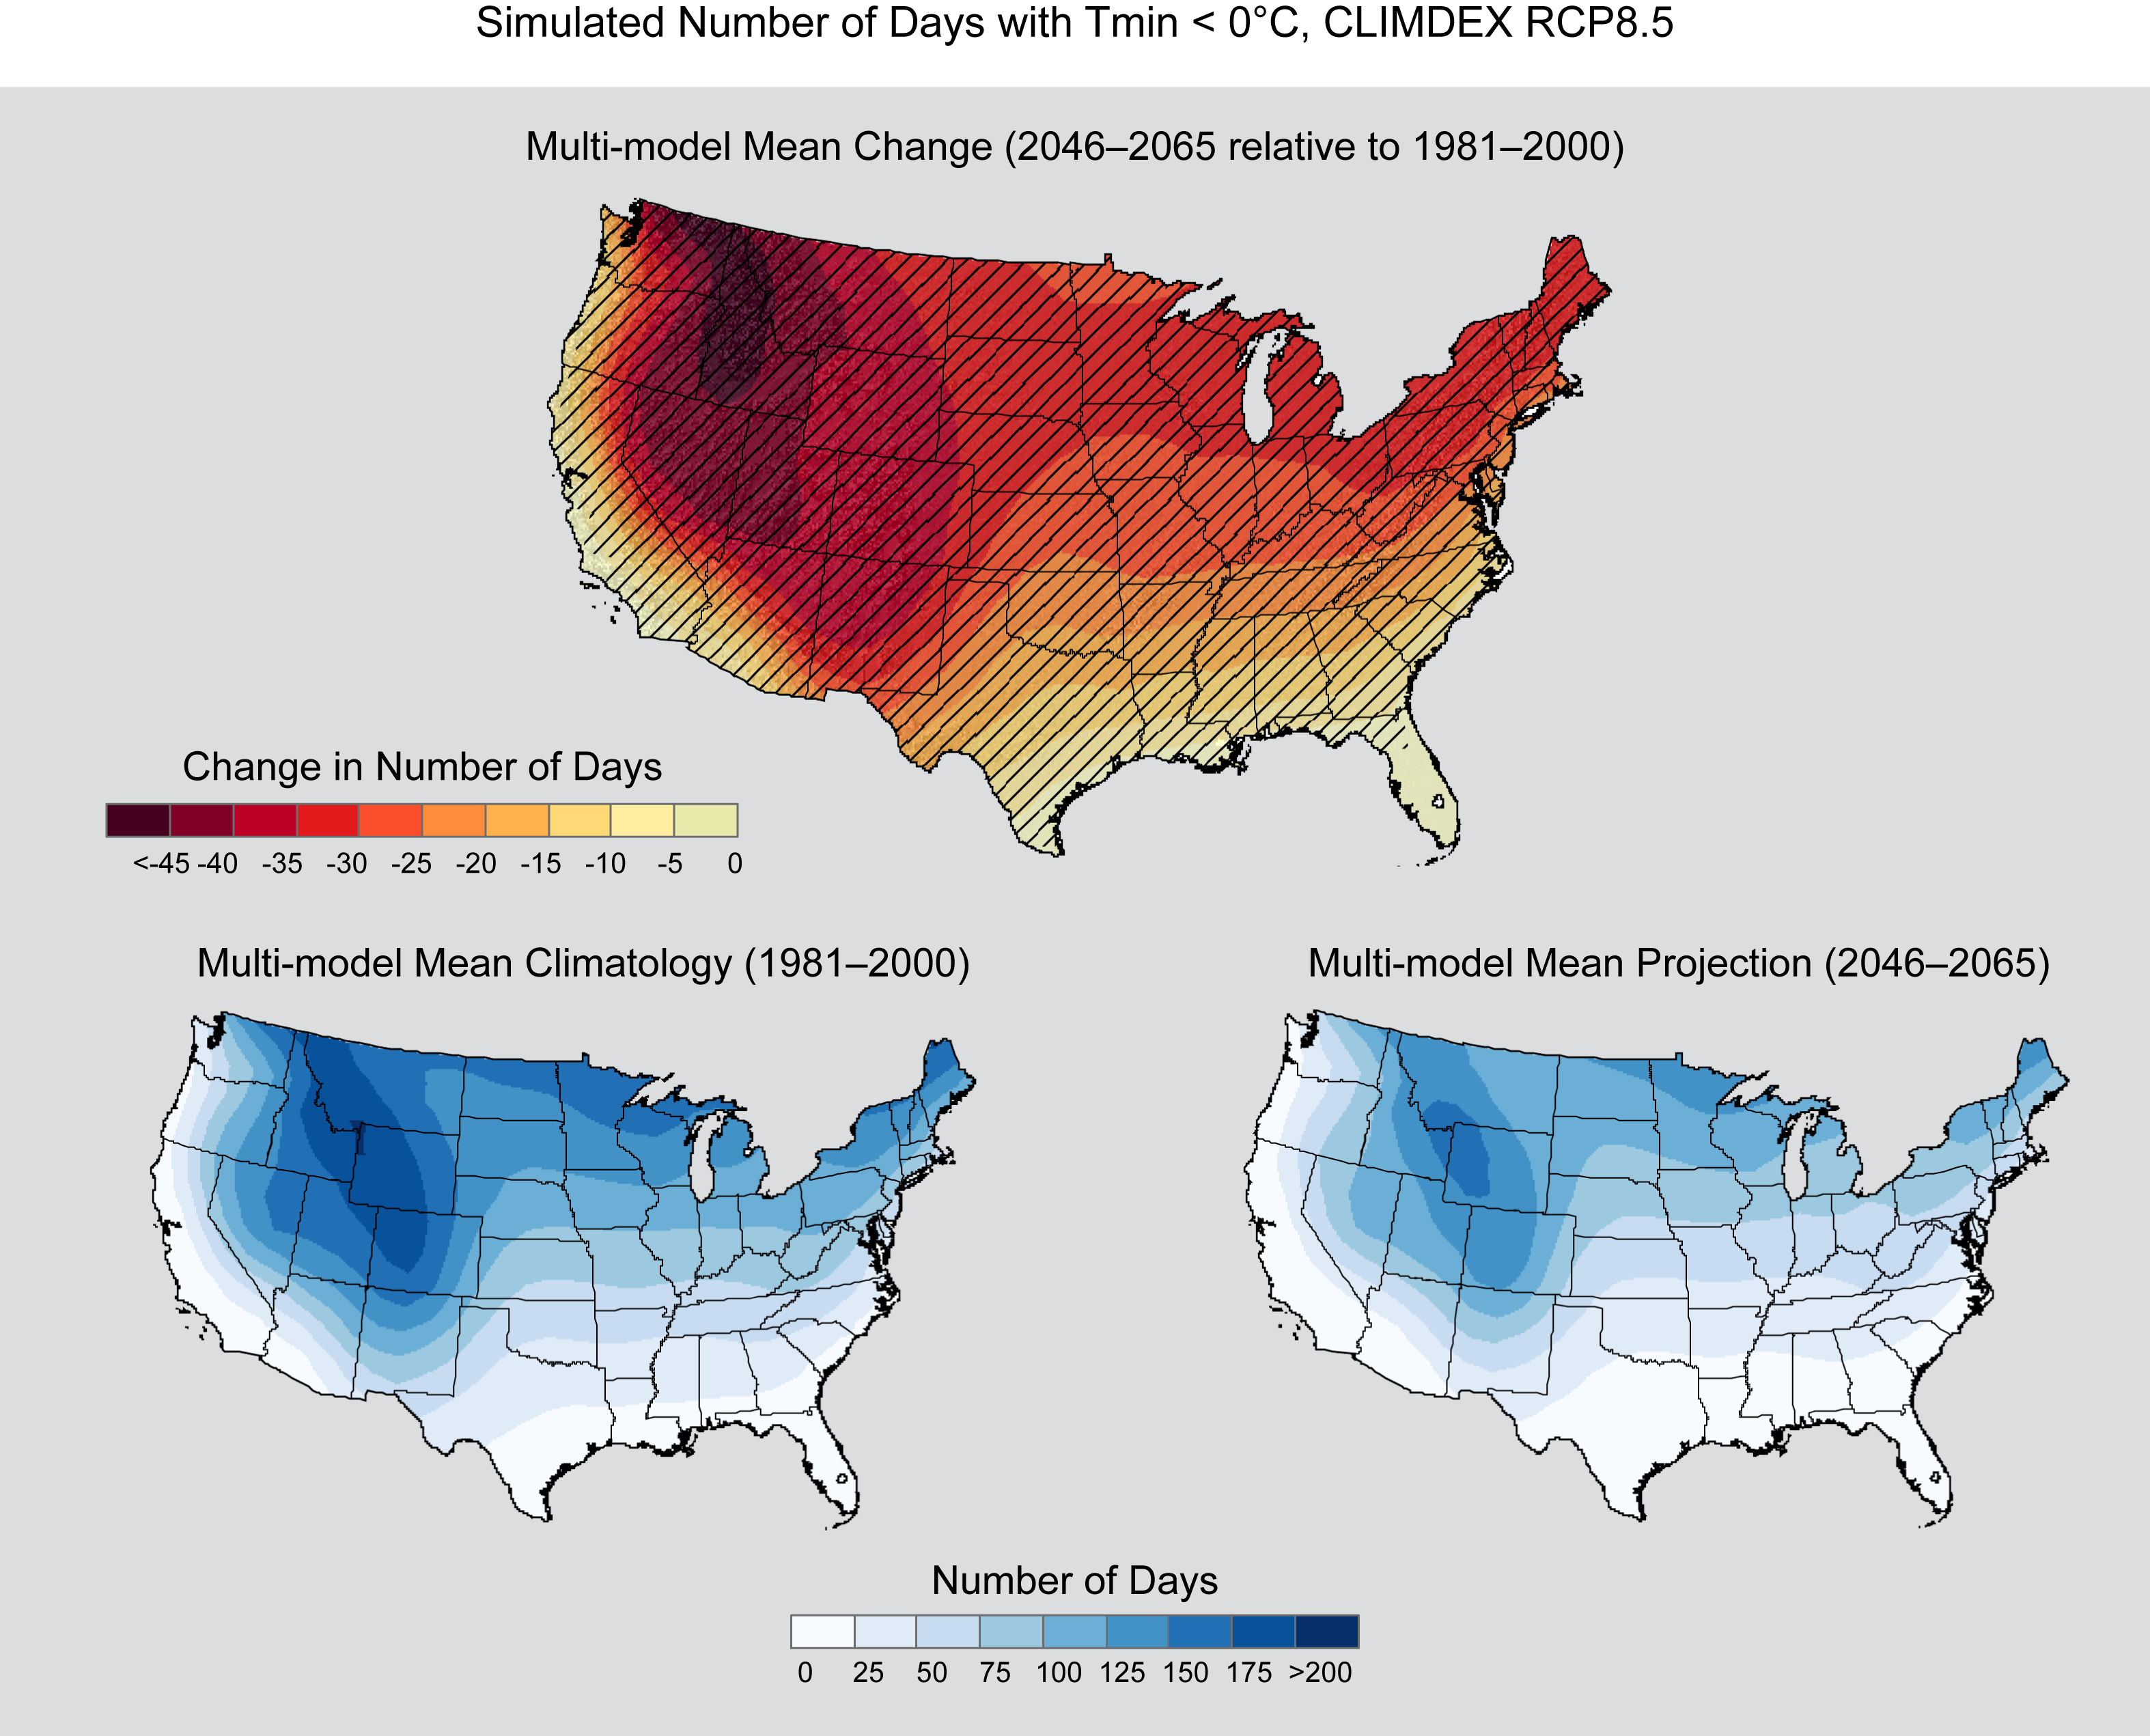
Simulated Number of Days with Tmin
Simulated multi-model mean change in the mean annual number of days with a minimum temperature less than 0°C (Tmin < 0°C) for the contiguous United States, for 2046–2065 with respect to the reference period of 1981–2000, using the CLIMDEX RCP8.5 scenario (top). Color only (category 1) indicates that less than 50% of the models show a statistically significant change. Color with hatching (category 3) indicates that more than 50% of the models show a statistically significant change, and more than 67% agree on the sign of the change (see Section 3). Multi-model mean climatology indicating the annual number of days with Tmin < 0°C for 1981–2000 (bottom left). Multi-model mean projection indicating the annual number of days with Tmin < 0°C for 2046–2065 (bottom right).
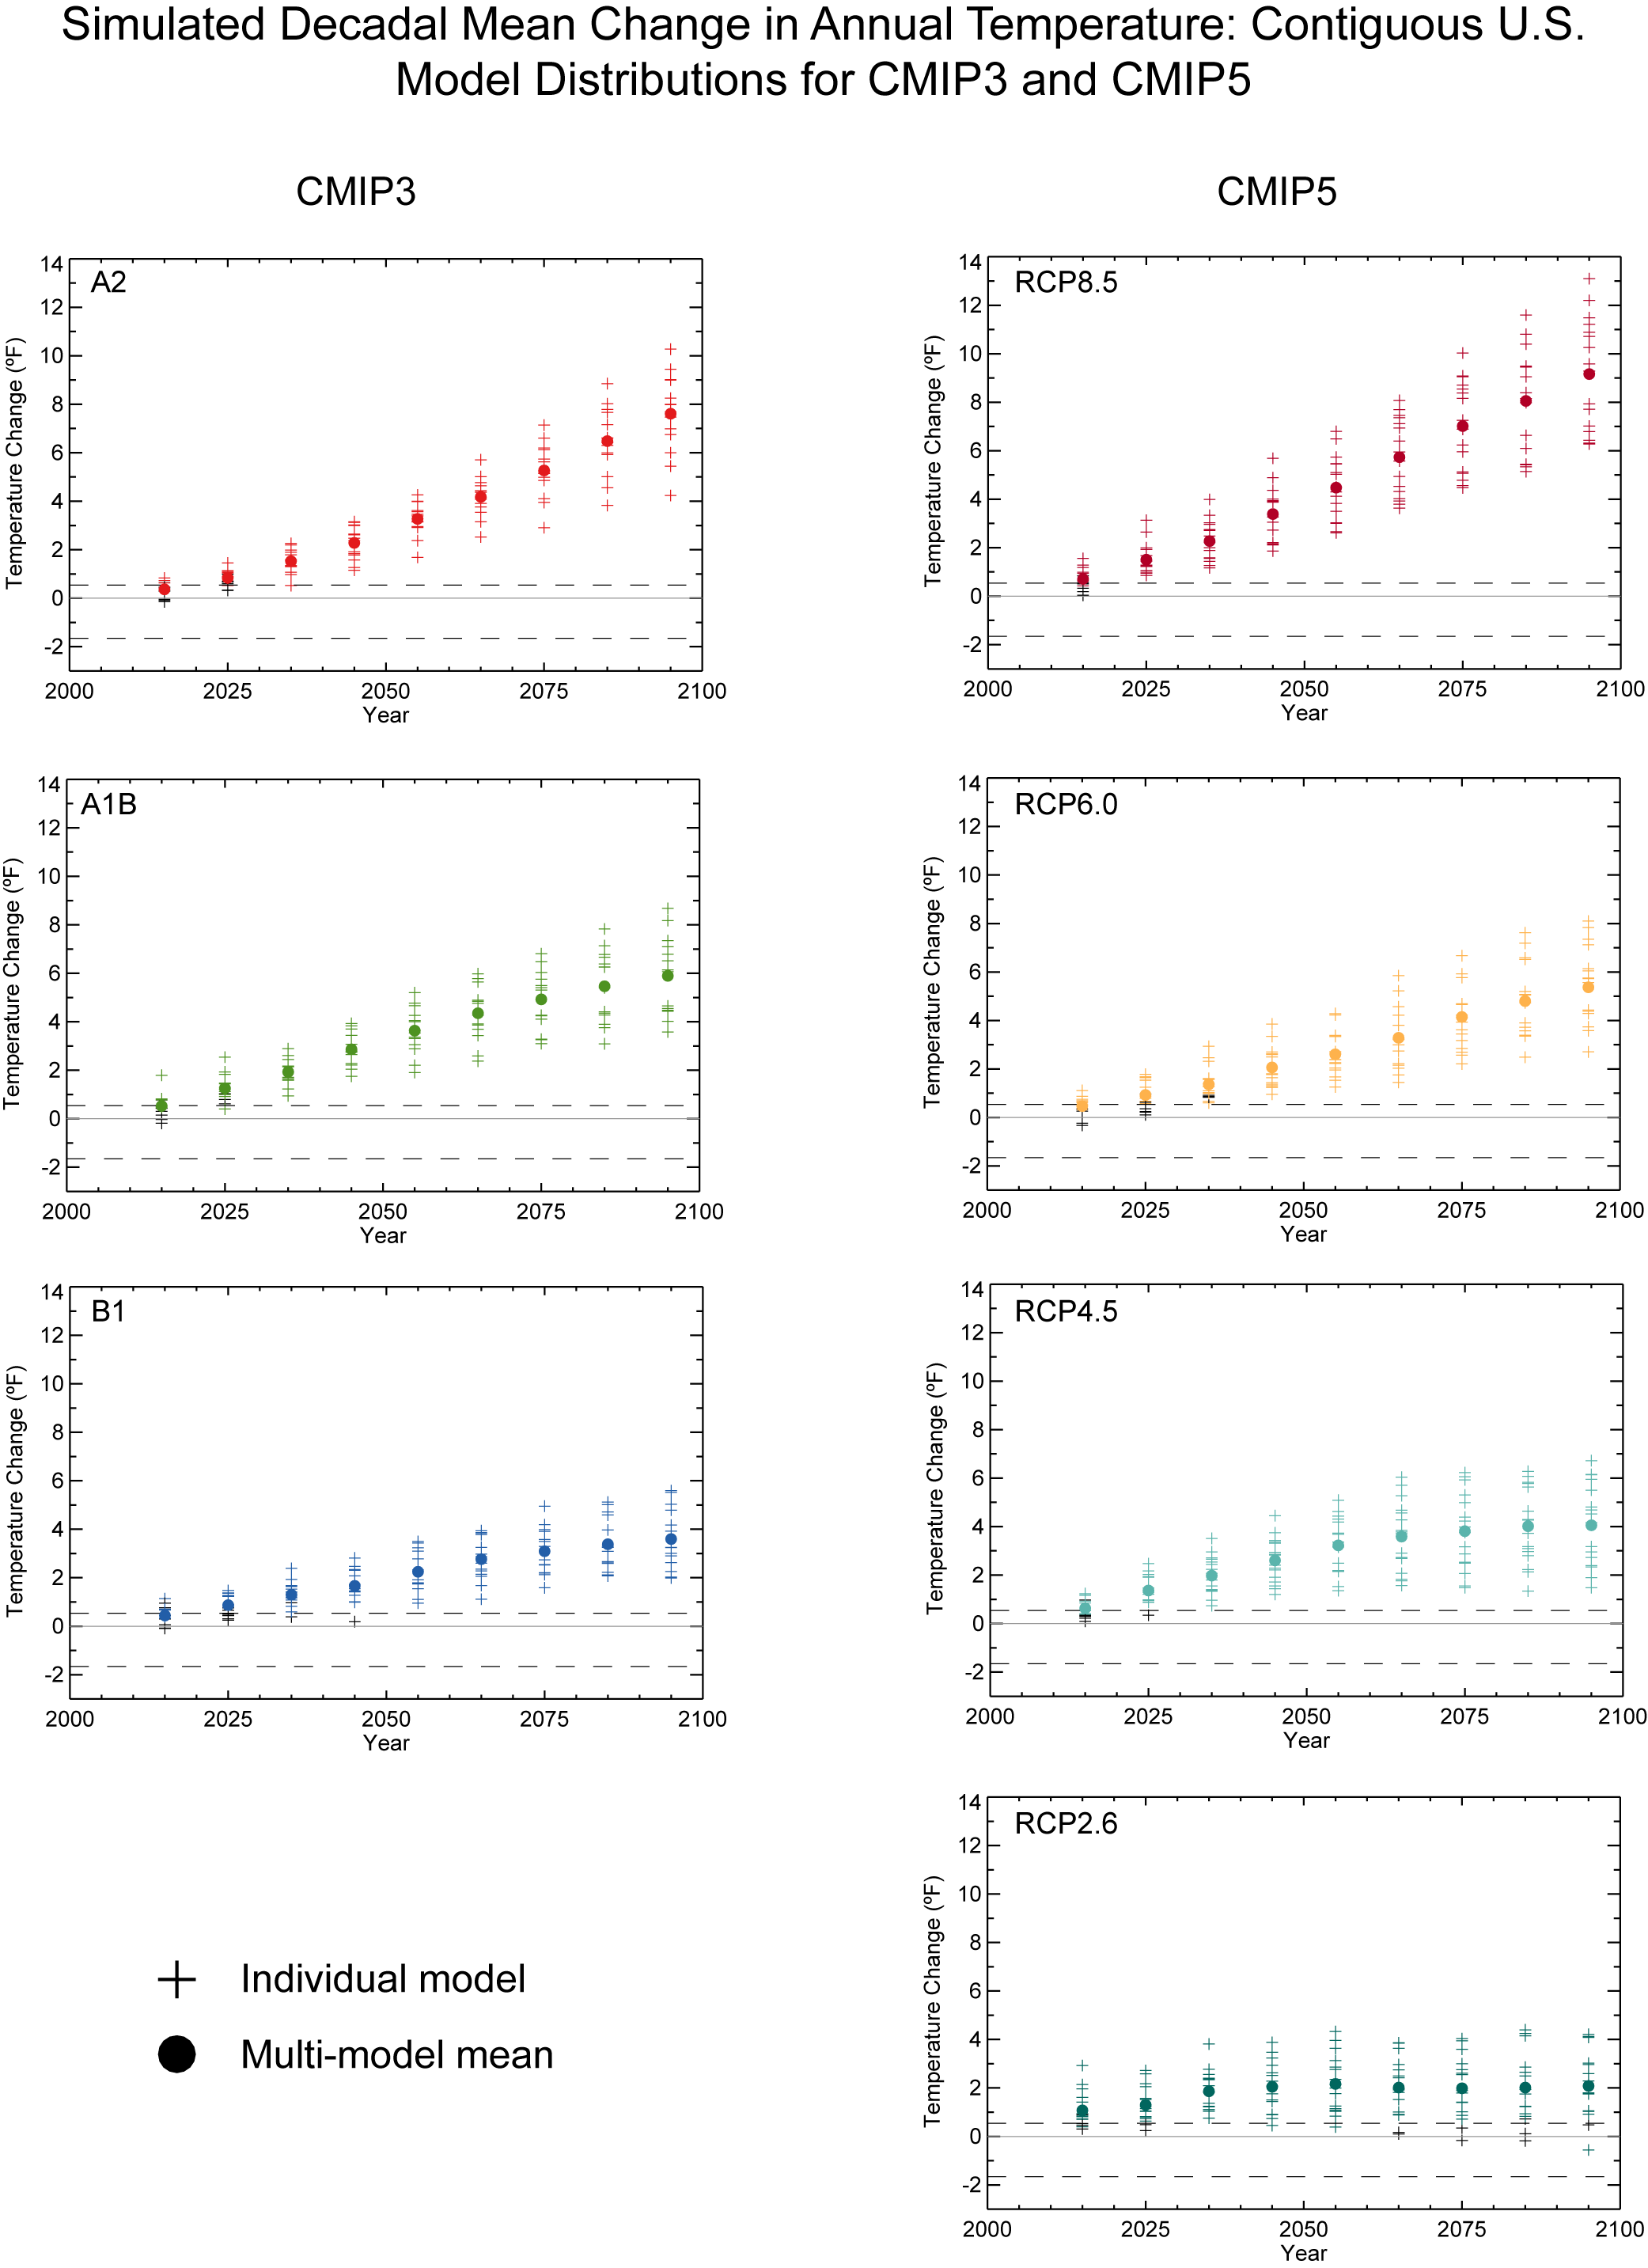
Simulated Decadal Mean Change in Annual Temperature: Contiguous U.S.; Model Distributions for CMIP3
Model distributions of simulated decadal mean change in annual temperature (°F) for the contiguous United States, for each future decadal time period (represented by their approximate midpoints, e.g., 2015 = 2011–2020), with respect to the reference period of 2001–2010. The left panels show values for the CMIP3 SRES B1 (blue), A1B (green), and A2 (red) scenarios. The right panels show values for the CMIP5 RCP2.6 (light teal), 4.5 (dark teal), 6.0 (yellow), and 8.5 (dark red) scenarios. Each individual model is represented by a plus sign (+), with circles depicting the multi-model means. These symbols are shown in color if the value is statistically significant at the 95% confidence level. Dashed lines indicate the 10th and 90th percentiles of observed temperature anomaly values from 1981–2010.
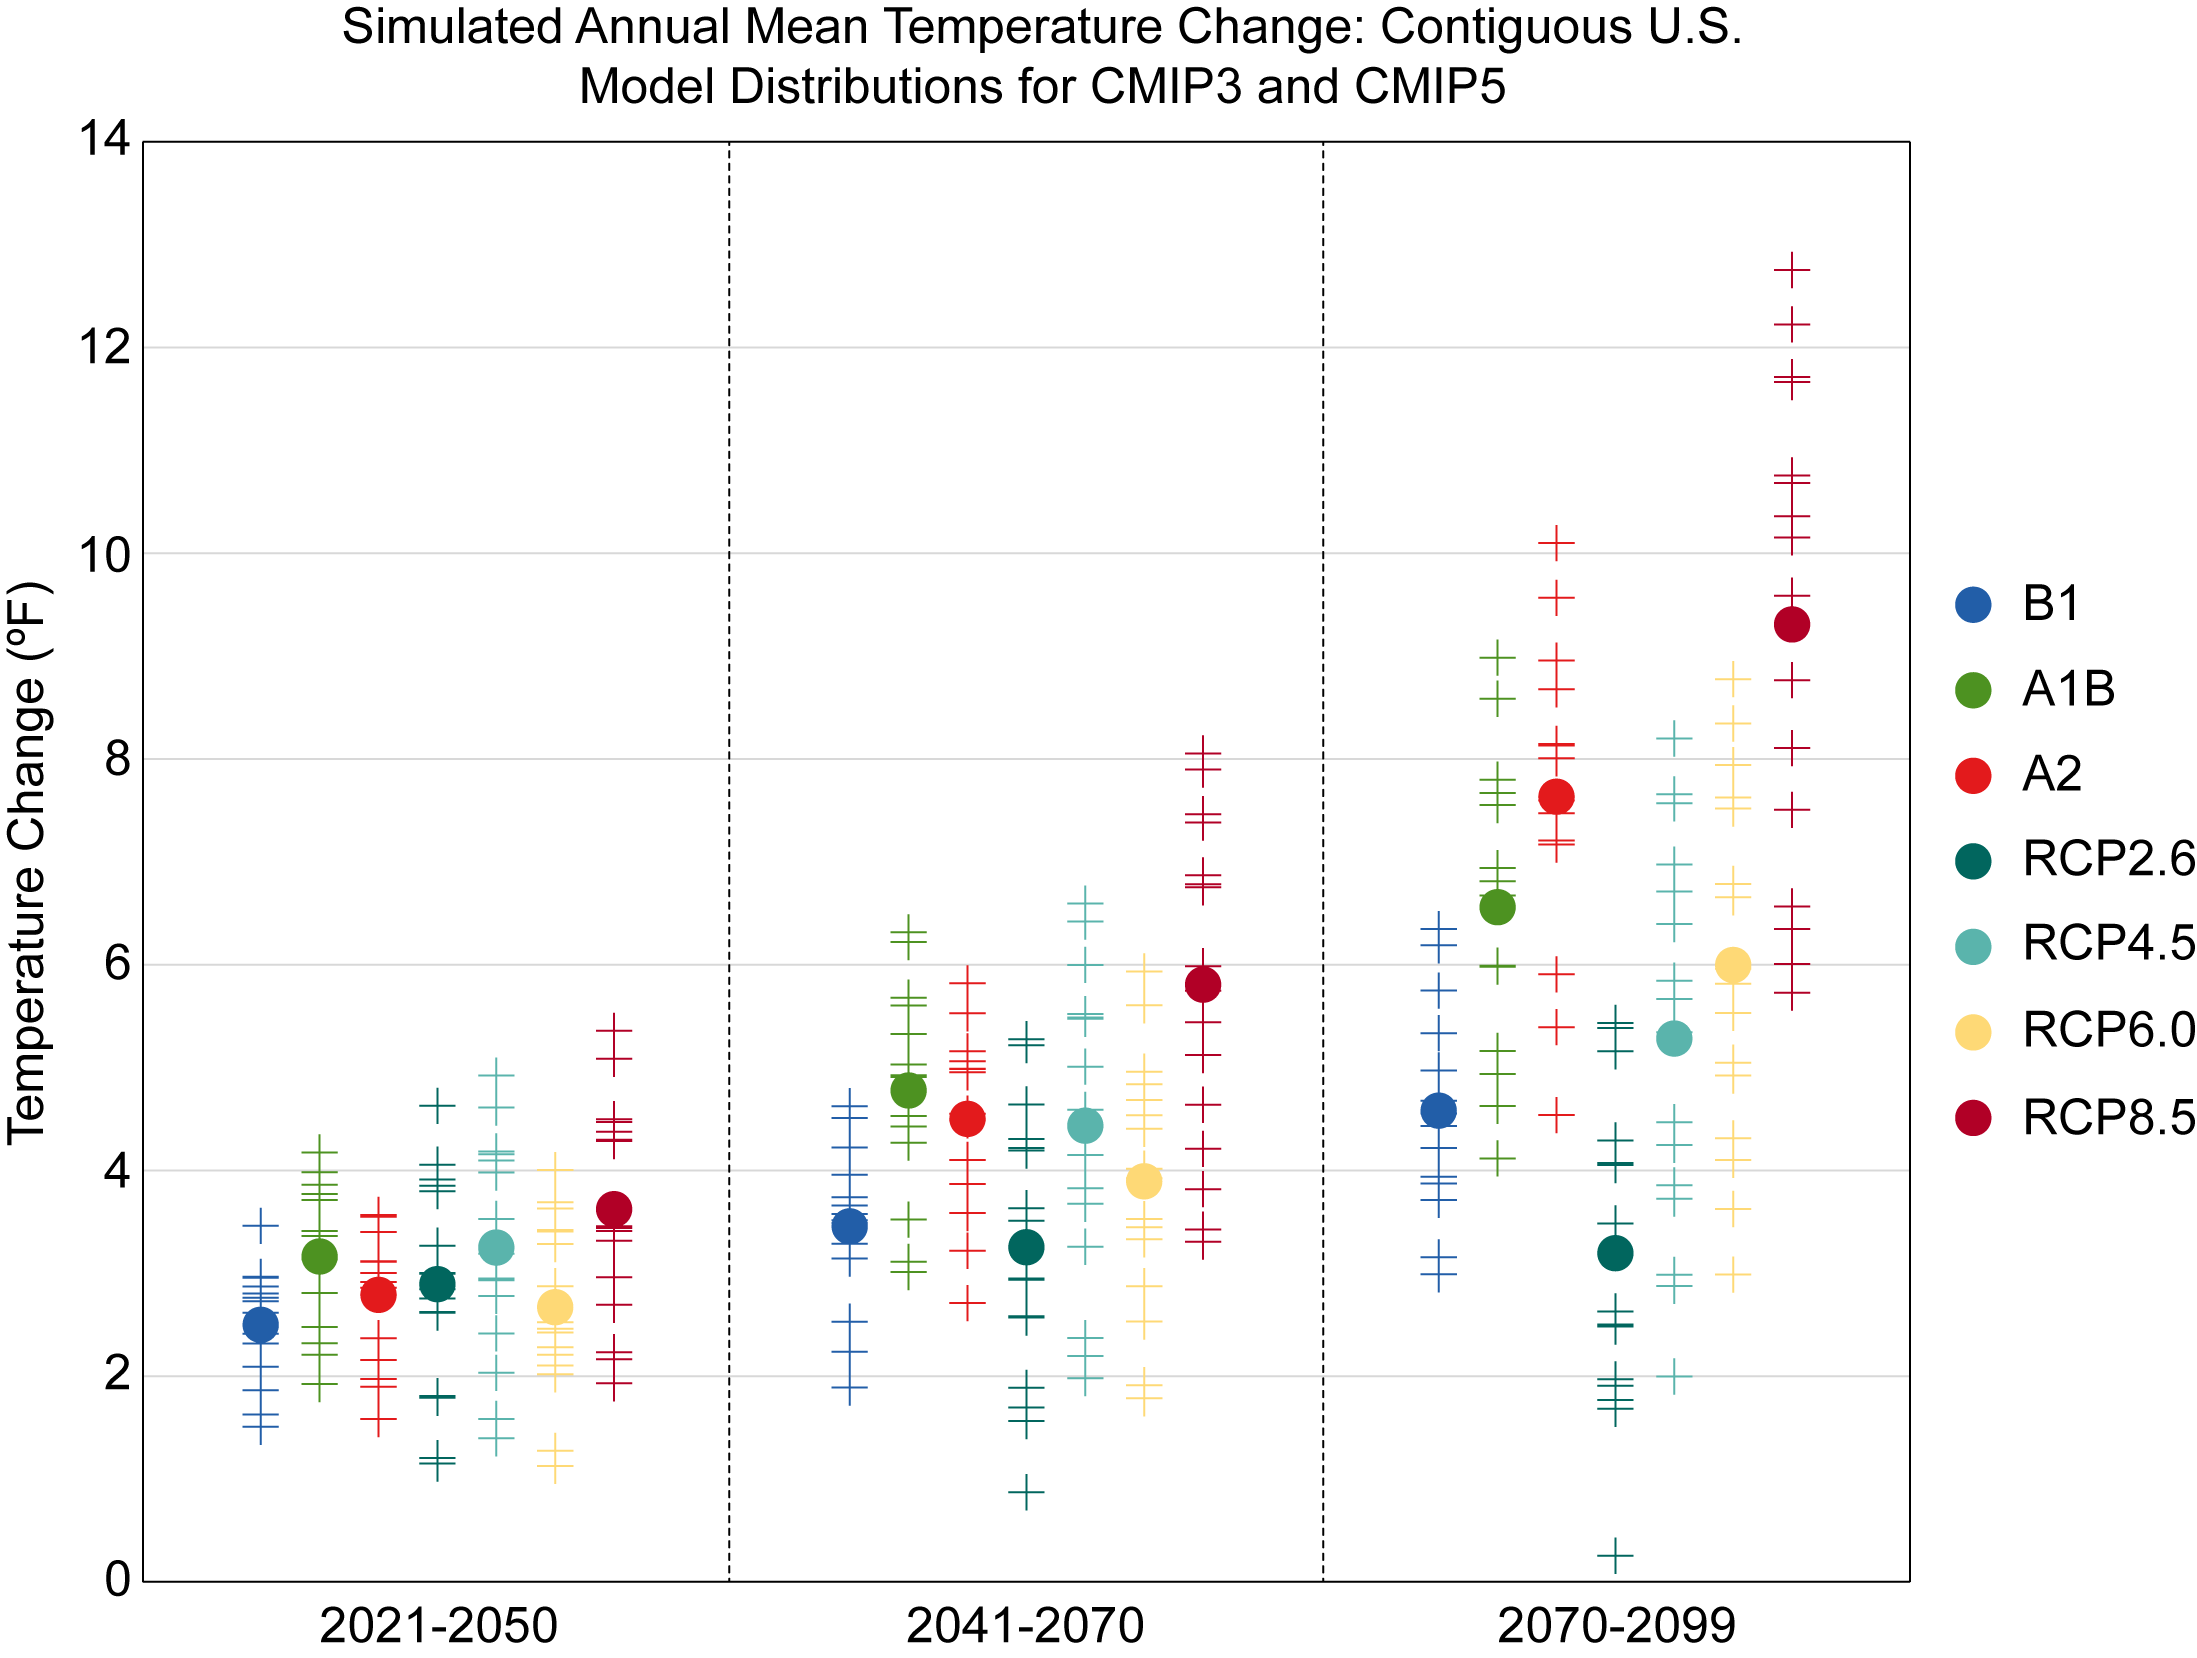
Simulated Annual Mean Temperature Change: Contiguous U.S.; Model Distributions for CMIP3 and CMIP5
Model distributions of simulated annual mean temperature change (°F) for the contiguous United States, for each future time period (2021–2050, 2041–2070, and 2070–2099) with respect to the reference period of 1971–2000 for each CMIP3 and CMIP5 scenario. The small plus signs (+) indicate each individual model and the circles depict the multi-model means.
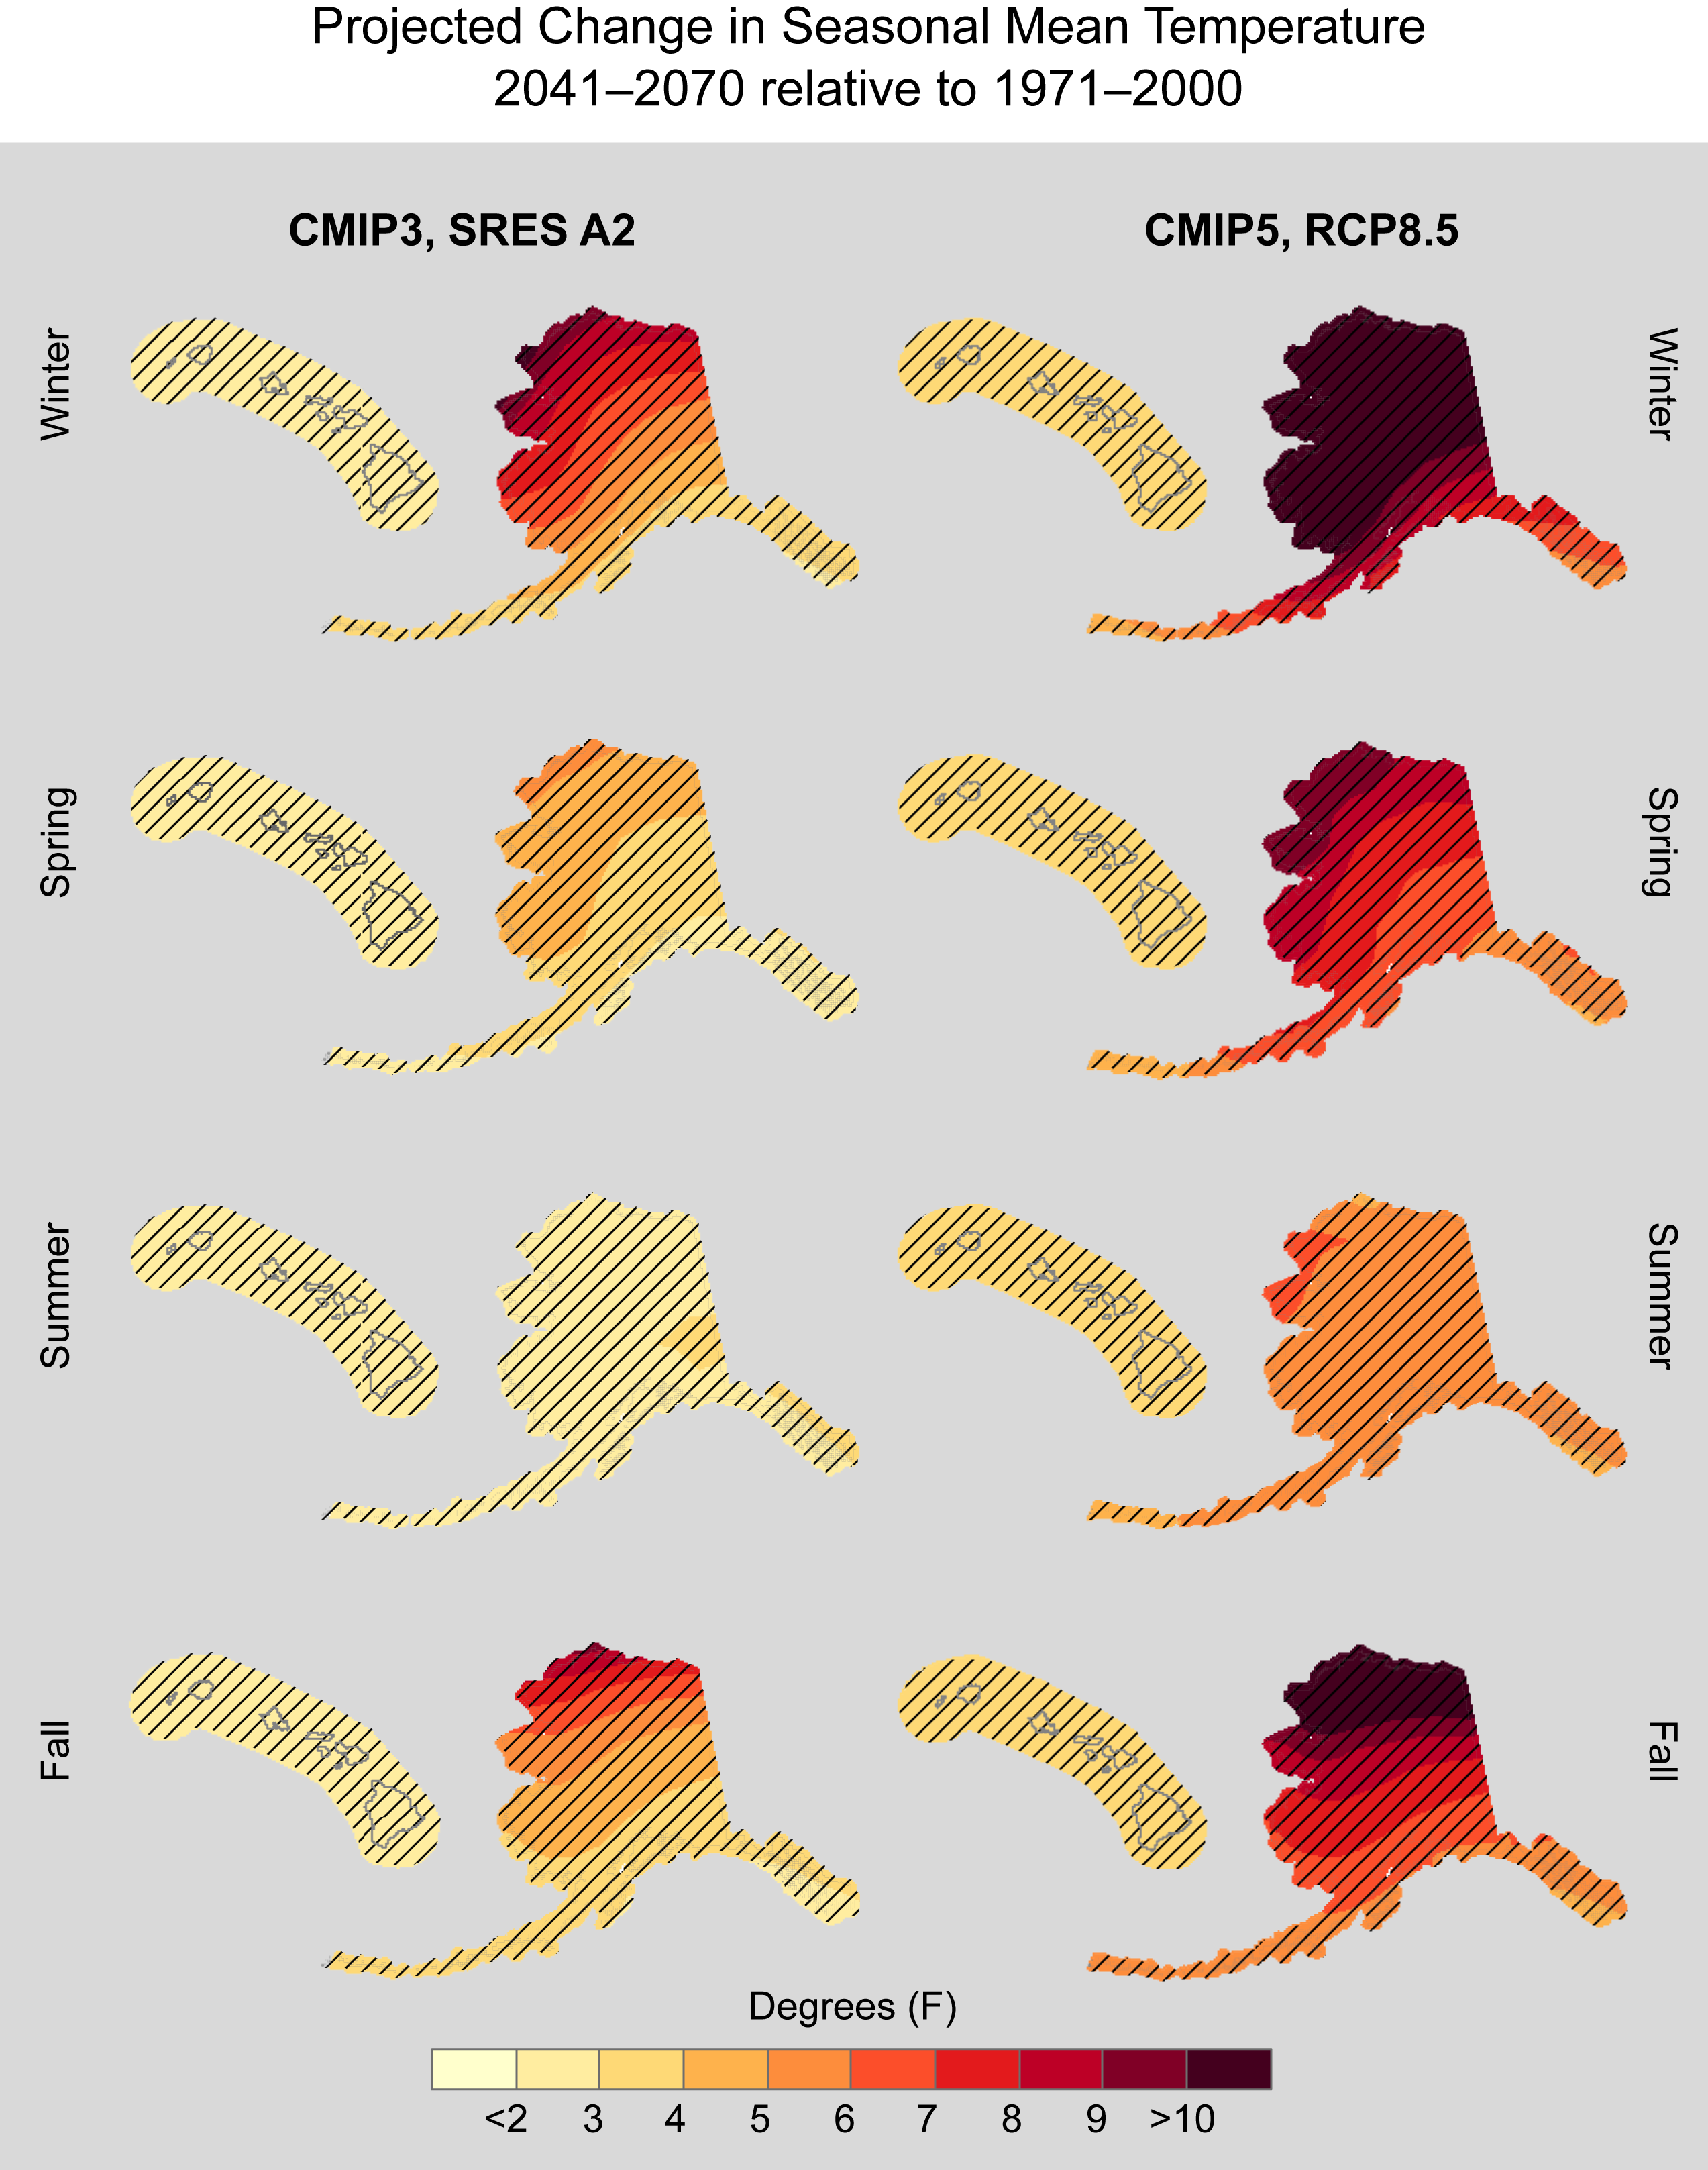
Projected Change in Seasonal Mean Temperature; 2041-2070 relative to 1971-2000 (Alaska and Hawaii)
Projected change in seasonal mean temperature (°F) for Alaska and Hawai‘i, for 2041–2070 with respect to the reference period of 1971–2000. These are multi-model means using CMIP3 SRES A2 (left column), and CMIP5 RCP8.5 (right column). Color with hatching (category 3) indicates that more than 50% of the models show a statistically significant change, and more than 67% agree on the sign of the change (see Section 3).

Projected Change in Seasonal Mean Temperature; 2041-2070 relative to 1971-2000
Projected change in seasonal mean temperature (°F) for the contiguous United States, for 2041–2070 with respect to the reference period of 1971–2000. These are multi-model means using CMIP3 SRES A2 (left column), and CMIP5 RCP8.5 (right column). Color with hatching (category 3) indicates that more than 50% of the models show a statistically significant change, and more than 67% agree on the sign of the change (see Section 3).
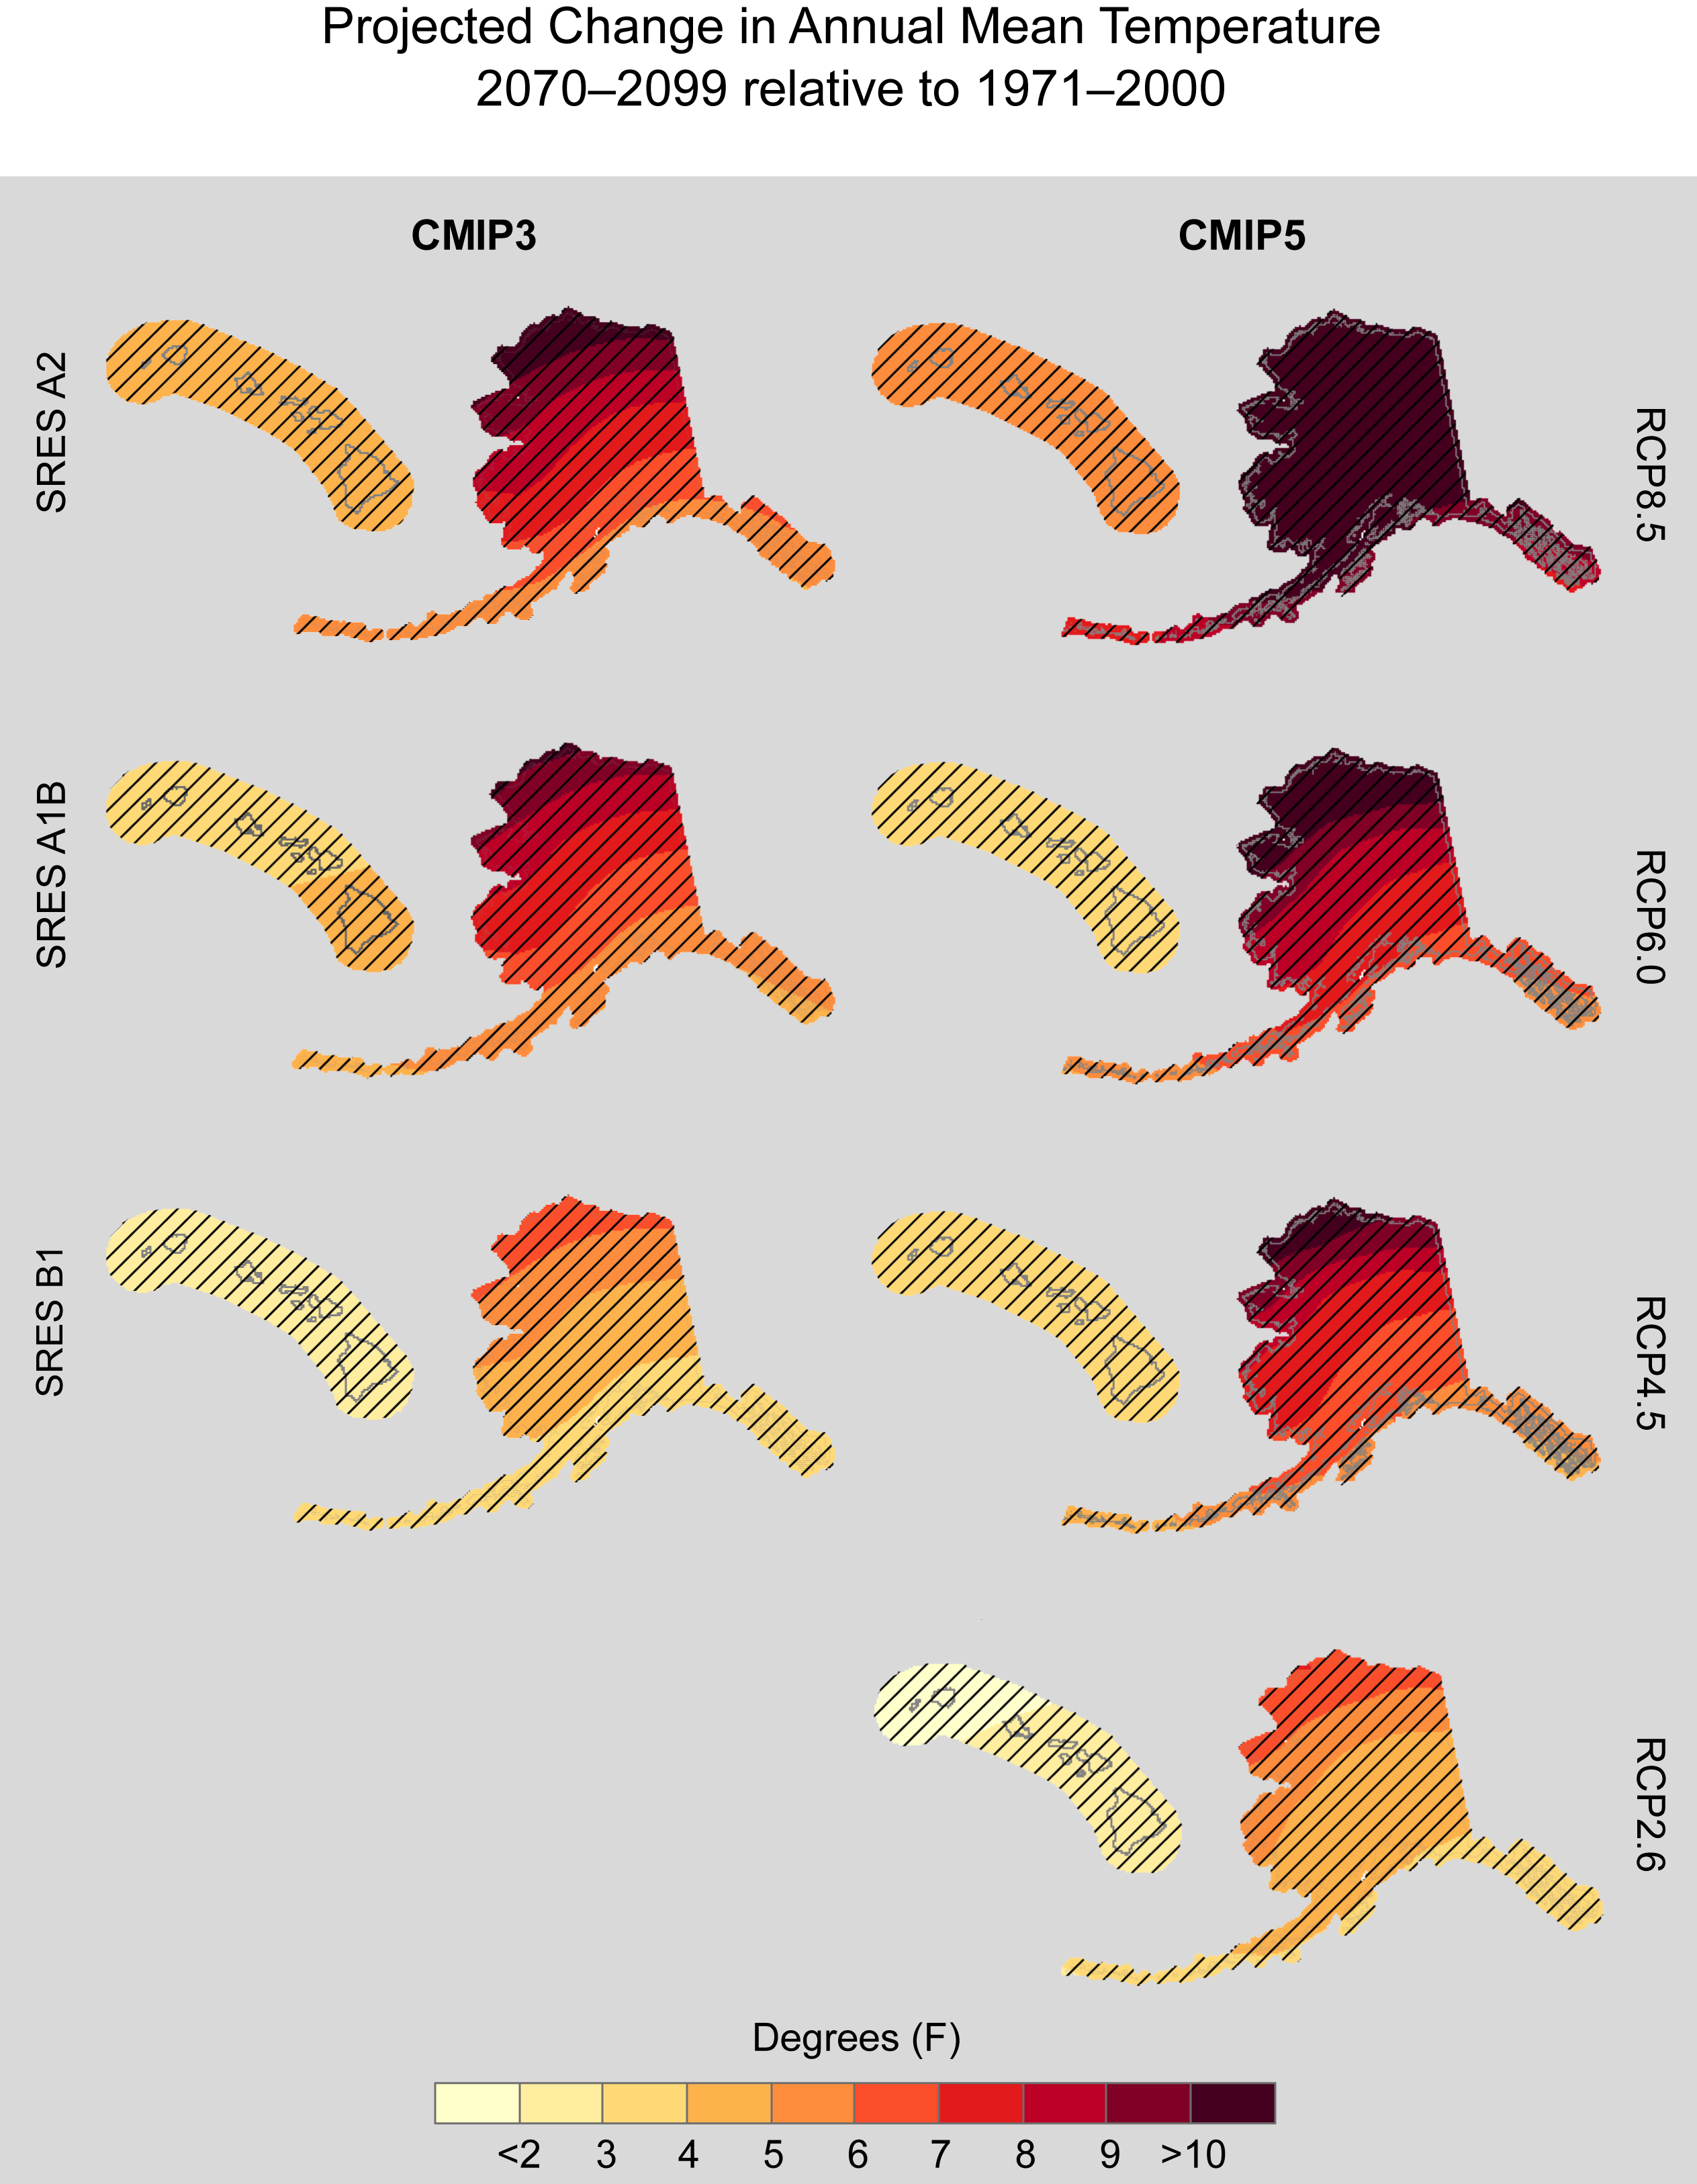
Projected Change in Annual Mean Temperature; 2070-2099 relative to 1971-2000 (Alaska and Hawaii)
Projected change in annual mean temperature (°F) for Alaska and Hawai‘i, for 2070–2099 with respect to the reference period of 1971–2000. These are multi-model means using CMIP3 SRES A2, A1B, and B1 scenarios (left column), and CMIP5 RCP8.5, 6.0, 4.5, and 2.6 scenarios (right column). Color with hatching (category 3) indicates that more than 50% of the models show a statistically significant change, and more than 67% agree on the sign of the change (see Section 3).
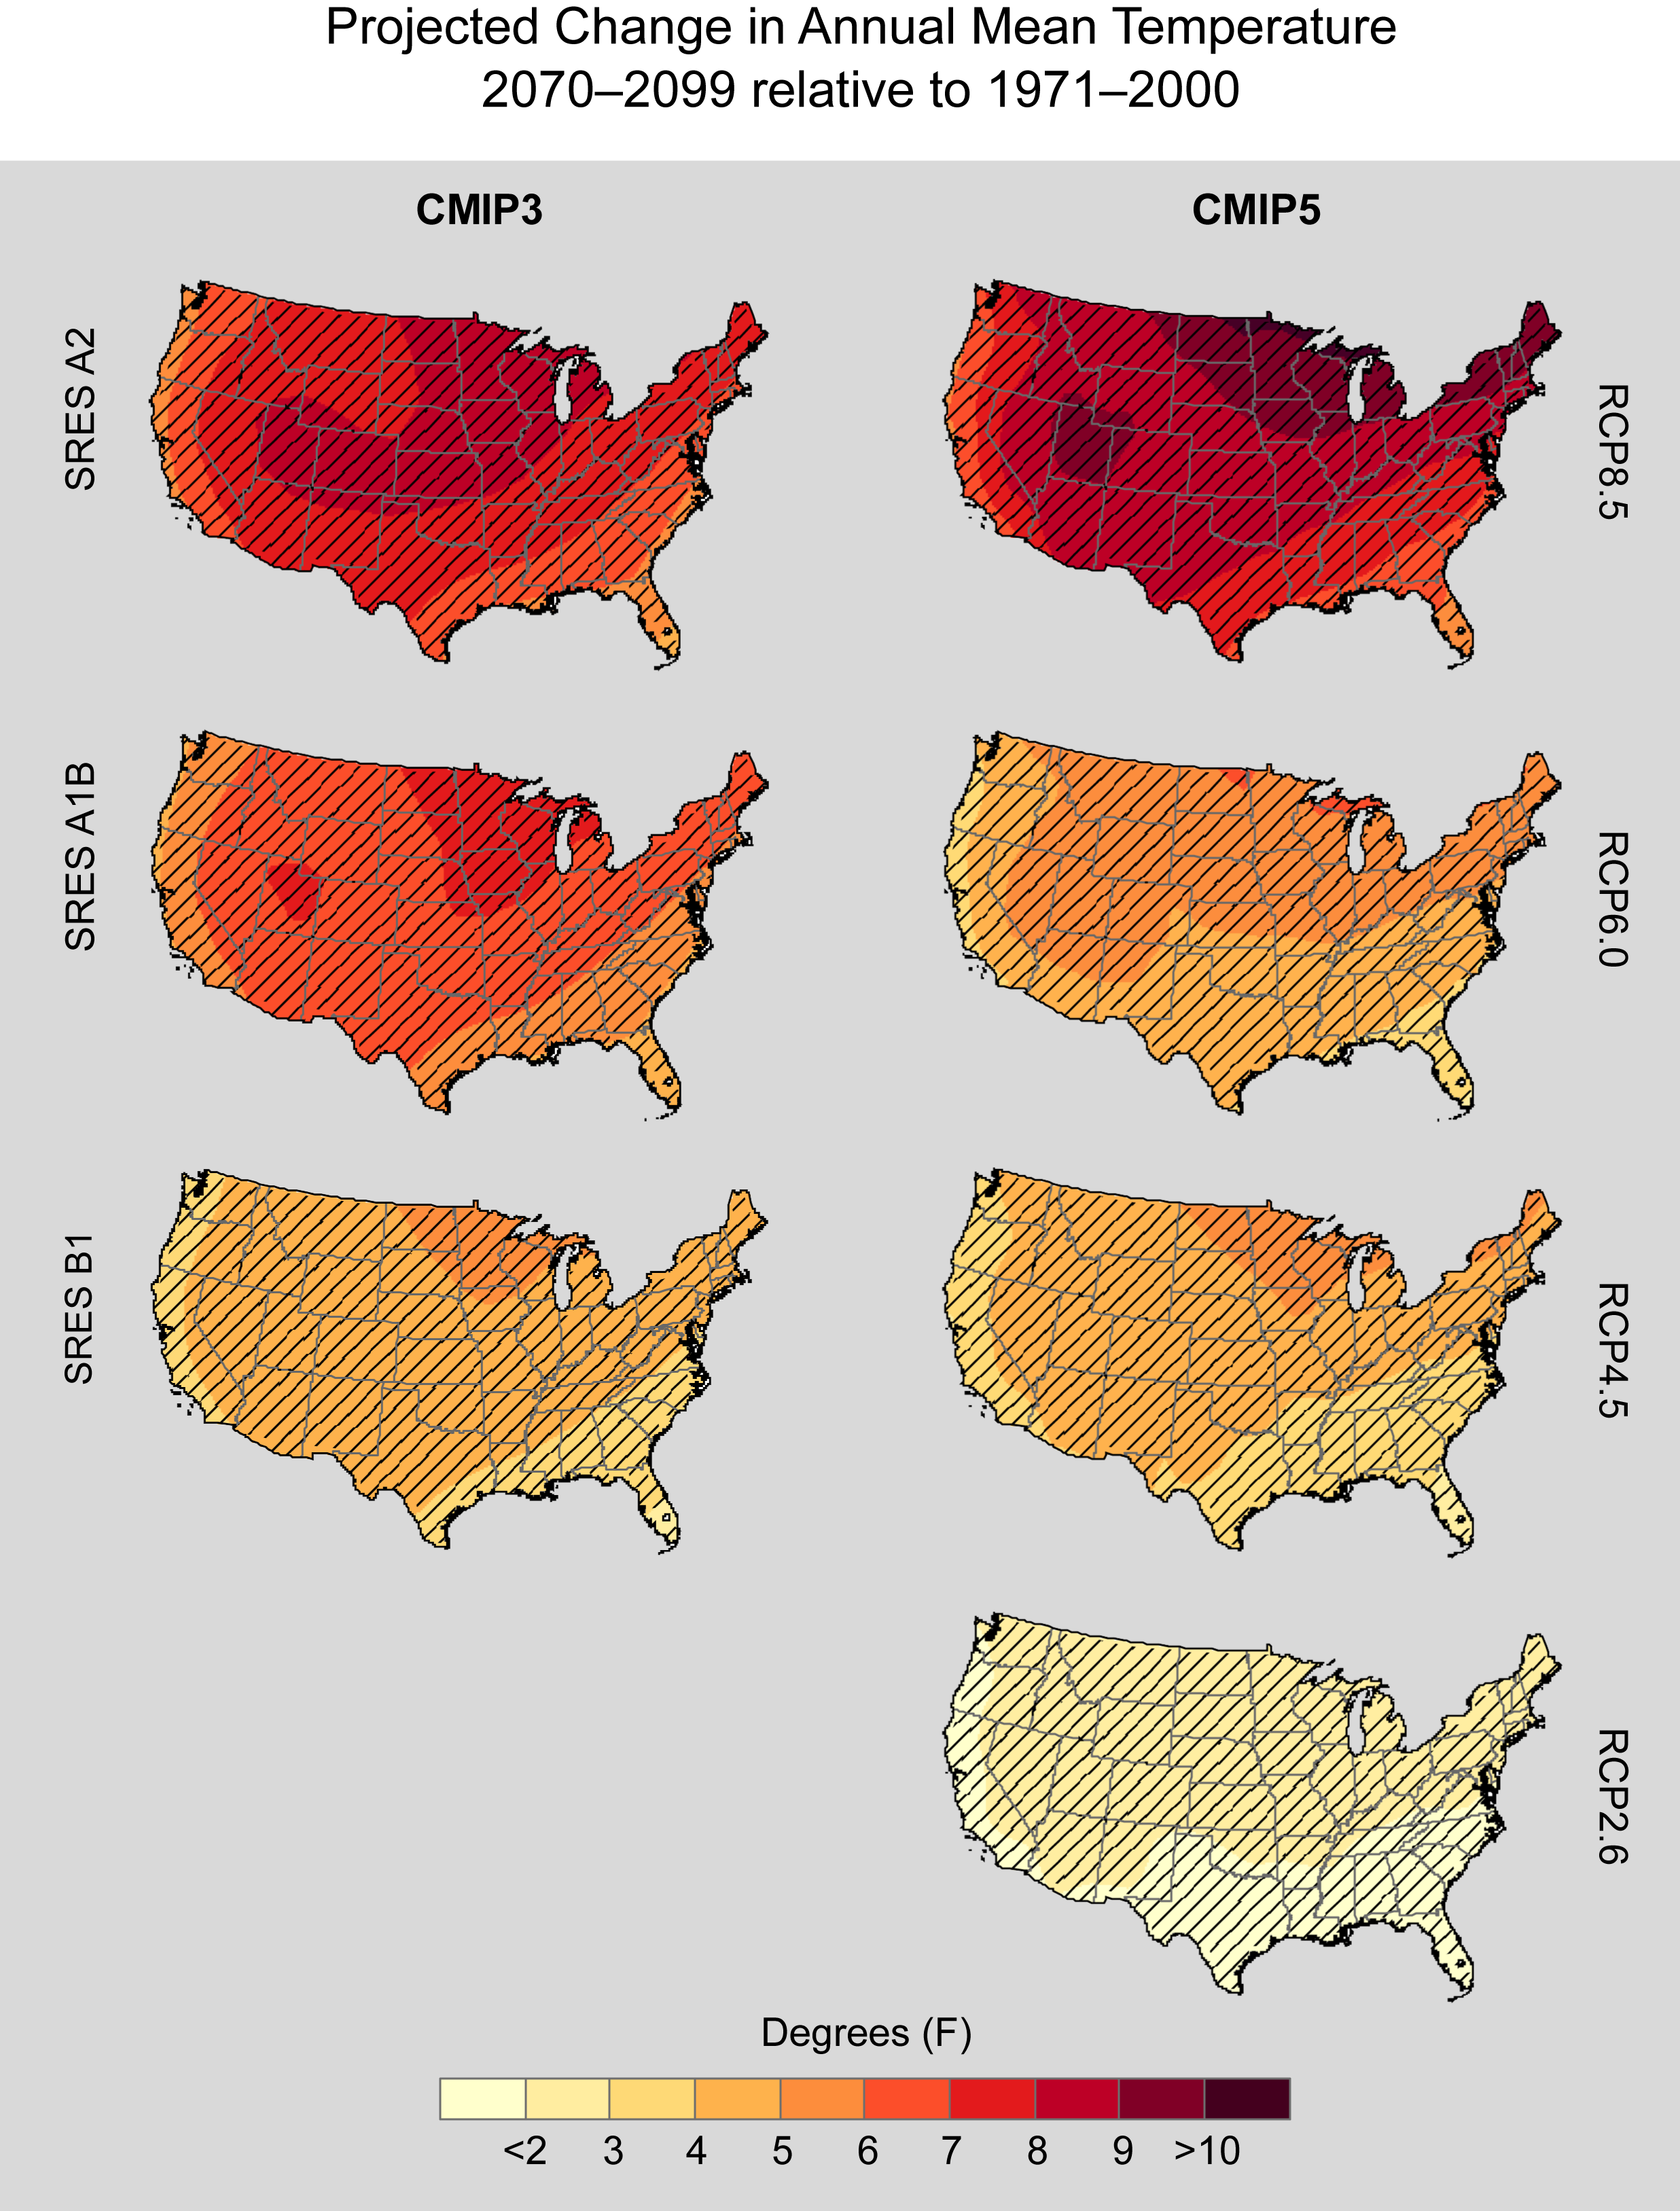
Projected Change in Annual Mean Temperature; 2070-2099 relative to 1971-2000
Projected change in annual mean temperature (°F) for the contiguous United States, for 2070–2099 with respect to the reference period of 1971–2000. These are multi-model means using CMIP3 SRES A2, A1B, and B1 scenarios (left column), and CMIP5 RCP8.5, 6.0, 4.5, and 2.6 scenarios (right column). Color with hatching (category 3) indicates that more than 50% of the models show a statistically significant change, and more than 67% agree on the sign of the change (see Section 3).
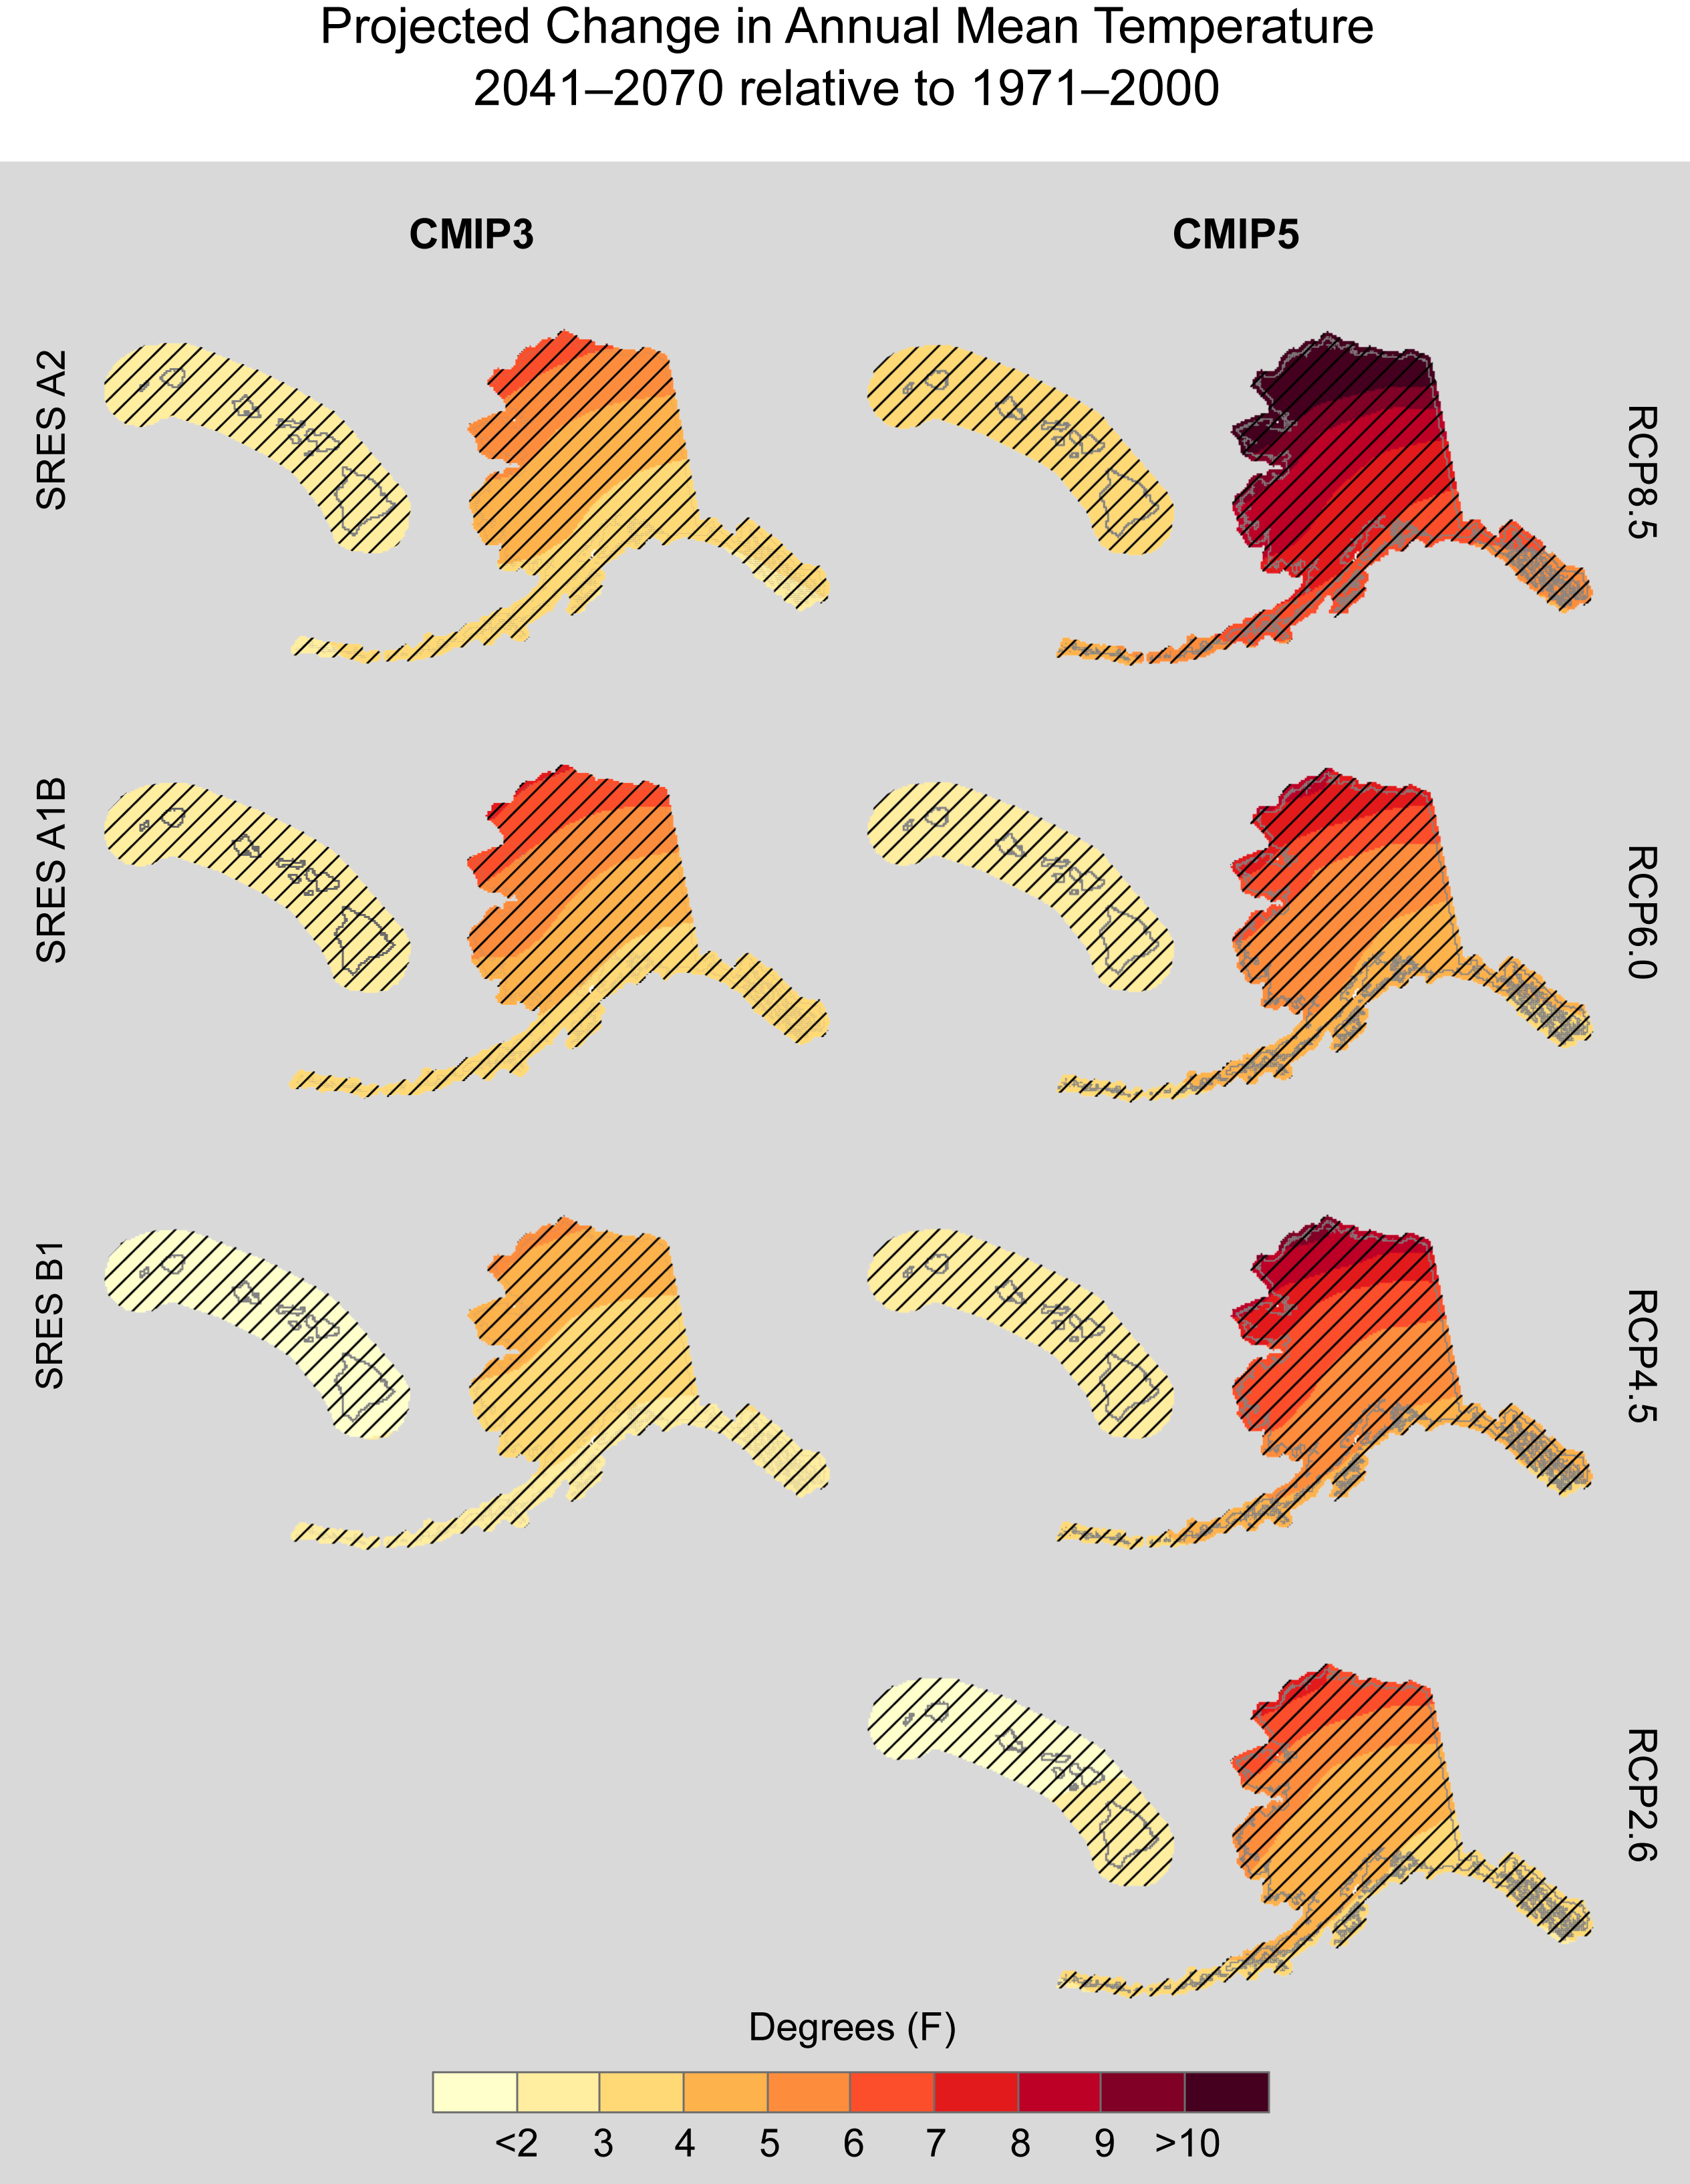
Projected Change in Annual Mean Temperature; 2041-2070 relative to 1971-2000 (Alaska and Hawaii)
Projected change in annual mean temperature (°F) for Alaska and Hawai‘i, for 2041–2070 with respect to the reference period of 1971–2000. These are multi-model means using CMIP3 SRES A2, A1B, and B1 scenarios (left column), and CMIP5 RCP8.5, 6.0, 4.5, and 2.6 scenarios (right column). Color with hatching (category 3) indicates that more than 50% of the models show a statistically significant change, and more than 67% agree on the sign of the change (see Section 3).
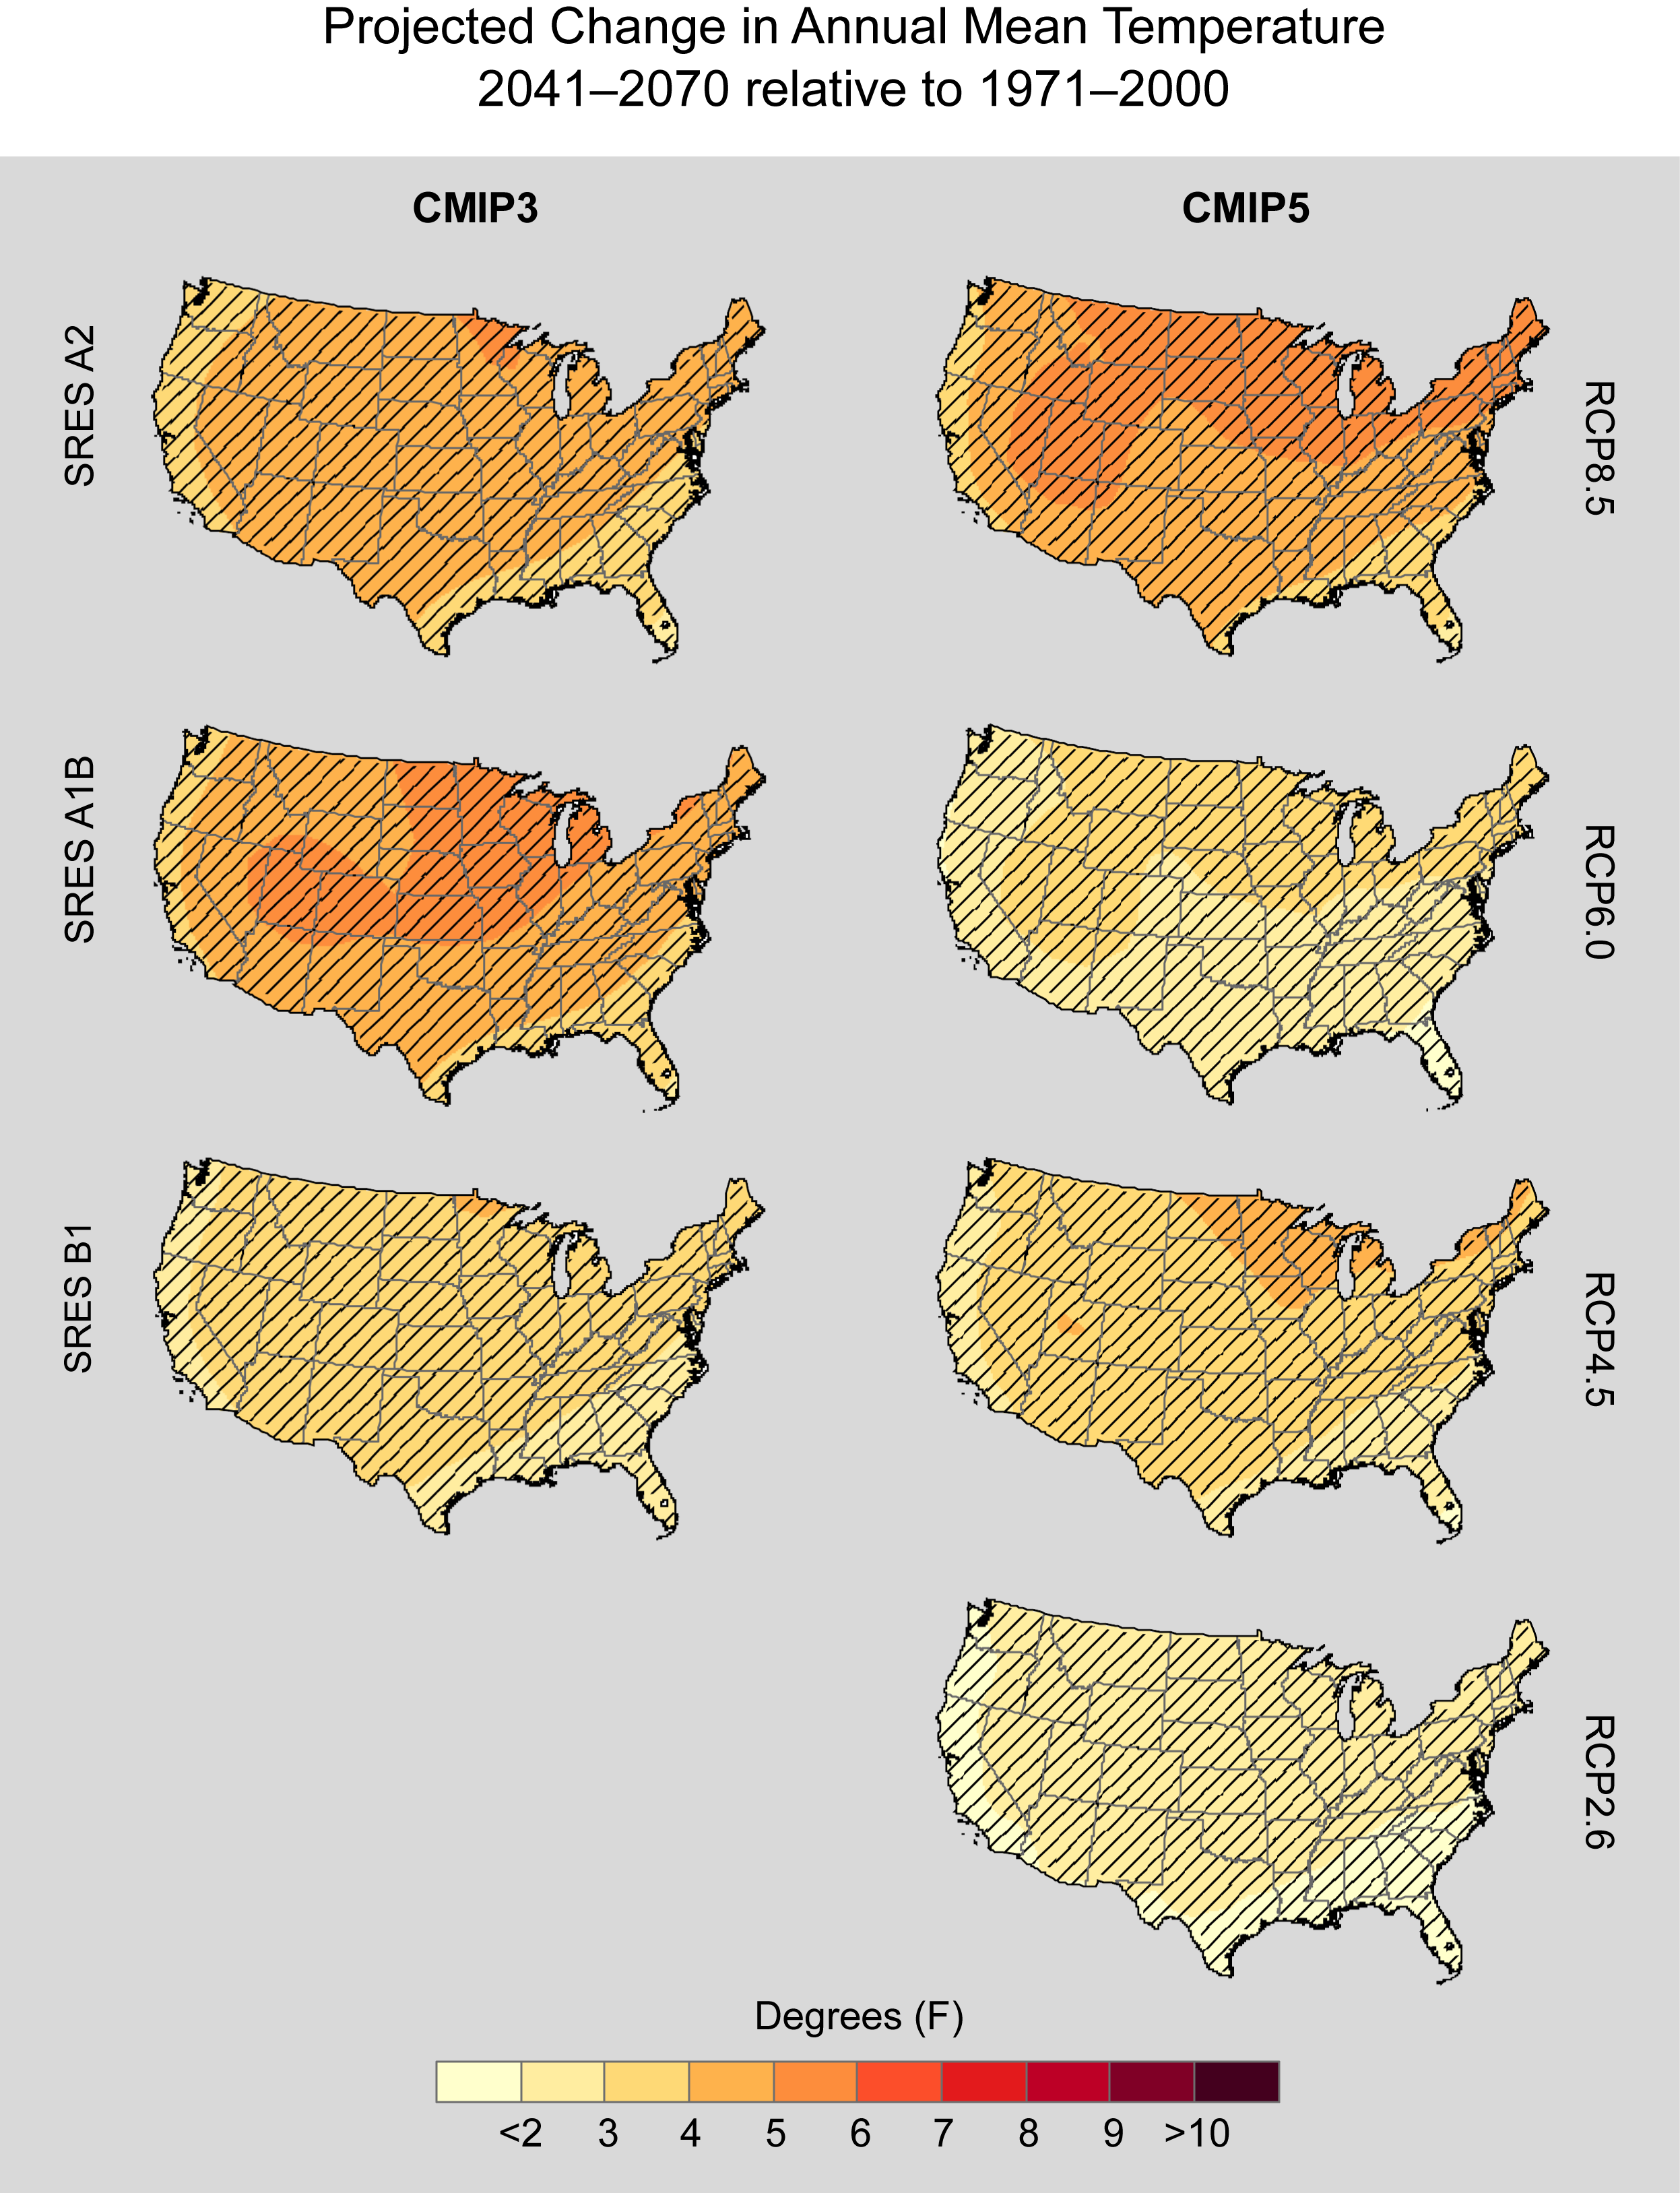
Projected Change in Annual Mean Temperature; 2041-2070 relative to 1971-2000
Projected change in annual mean temperature (°F) for the contiguous United States, for 2041–2070 with respect to the reference period of 1971–2000. These are multi-model means using CMIP3 SRES A2, A1B, and B1 scenarios (left column), and CMIP5 RCP8.5, 6.0, 4.5, and 2.6 scenarios (right column). Color with hatching (category 3) indicates that more than 50% of the models show a statistically significant change, and more than 67% agree on the sign of the change (see Section 3).
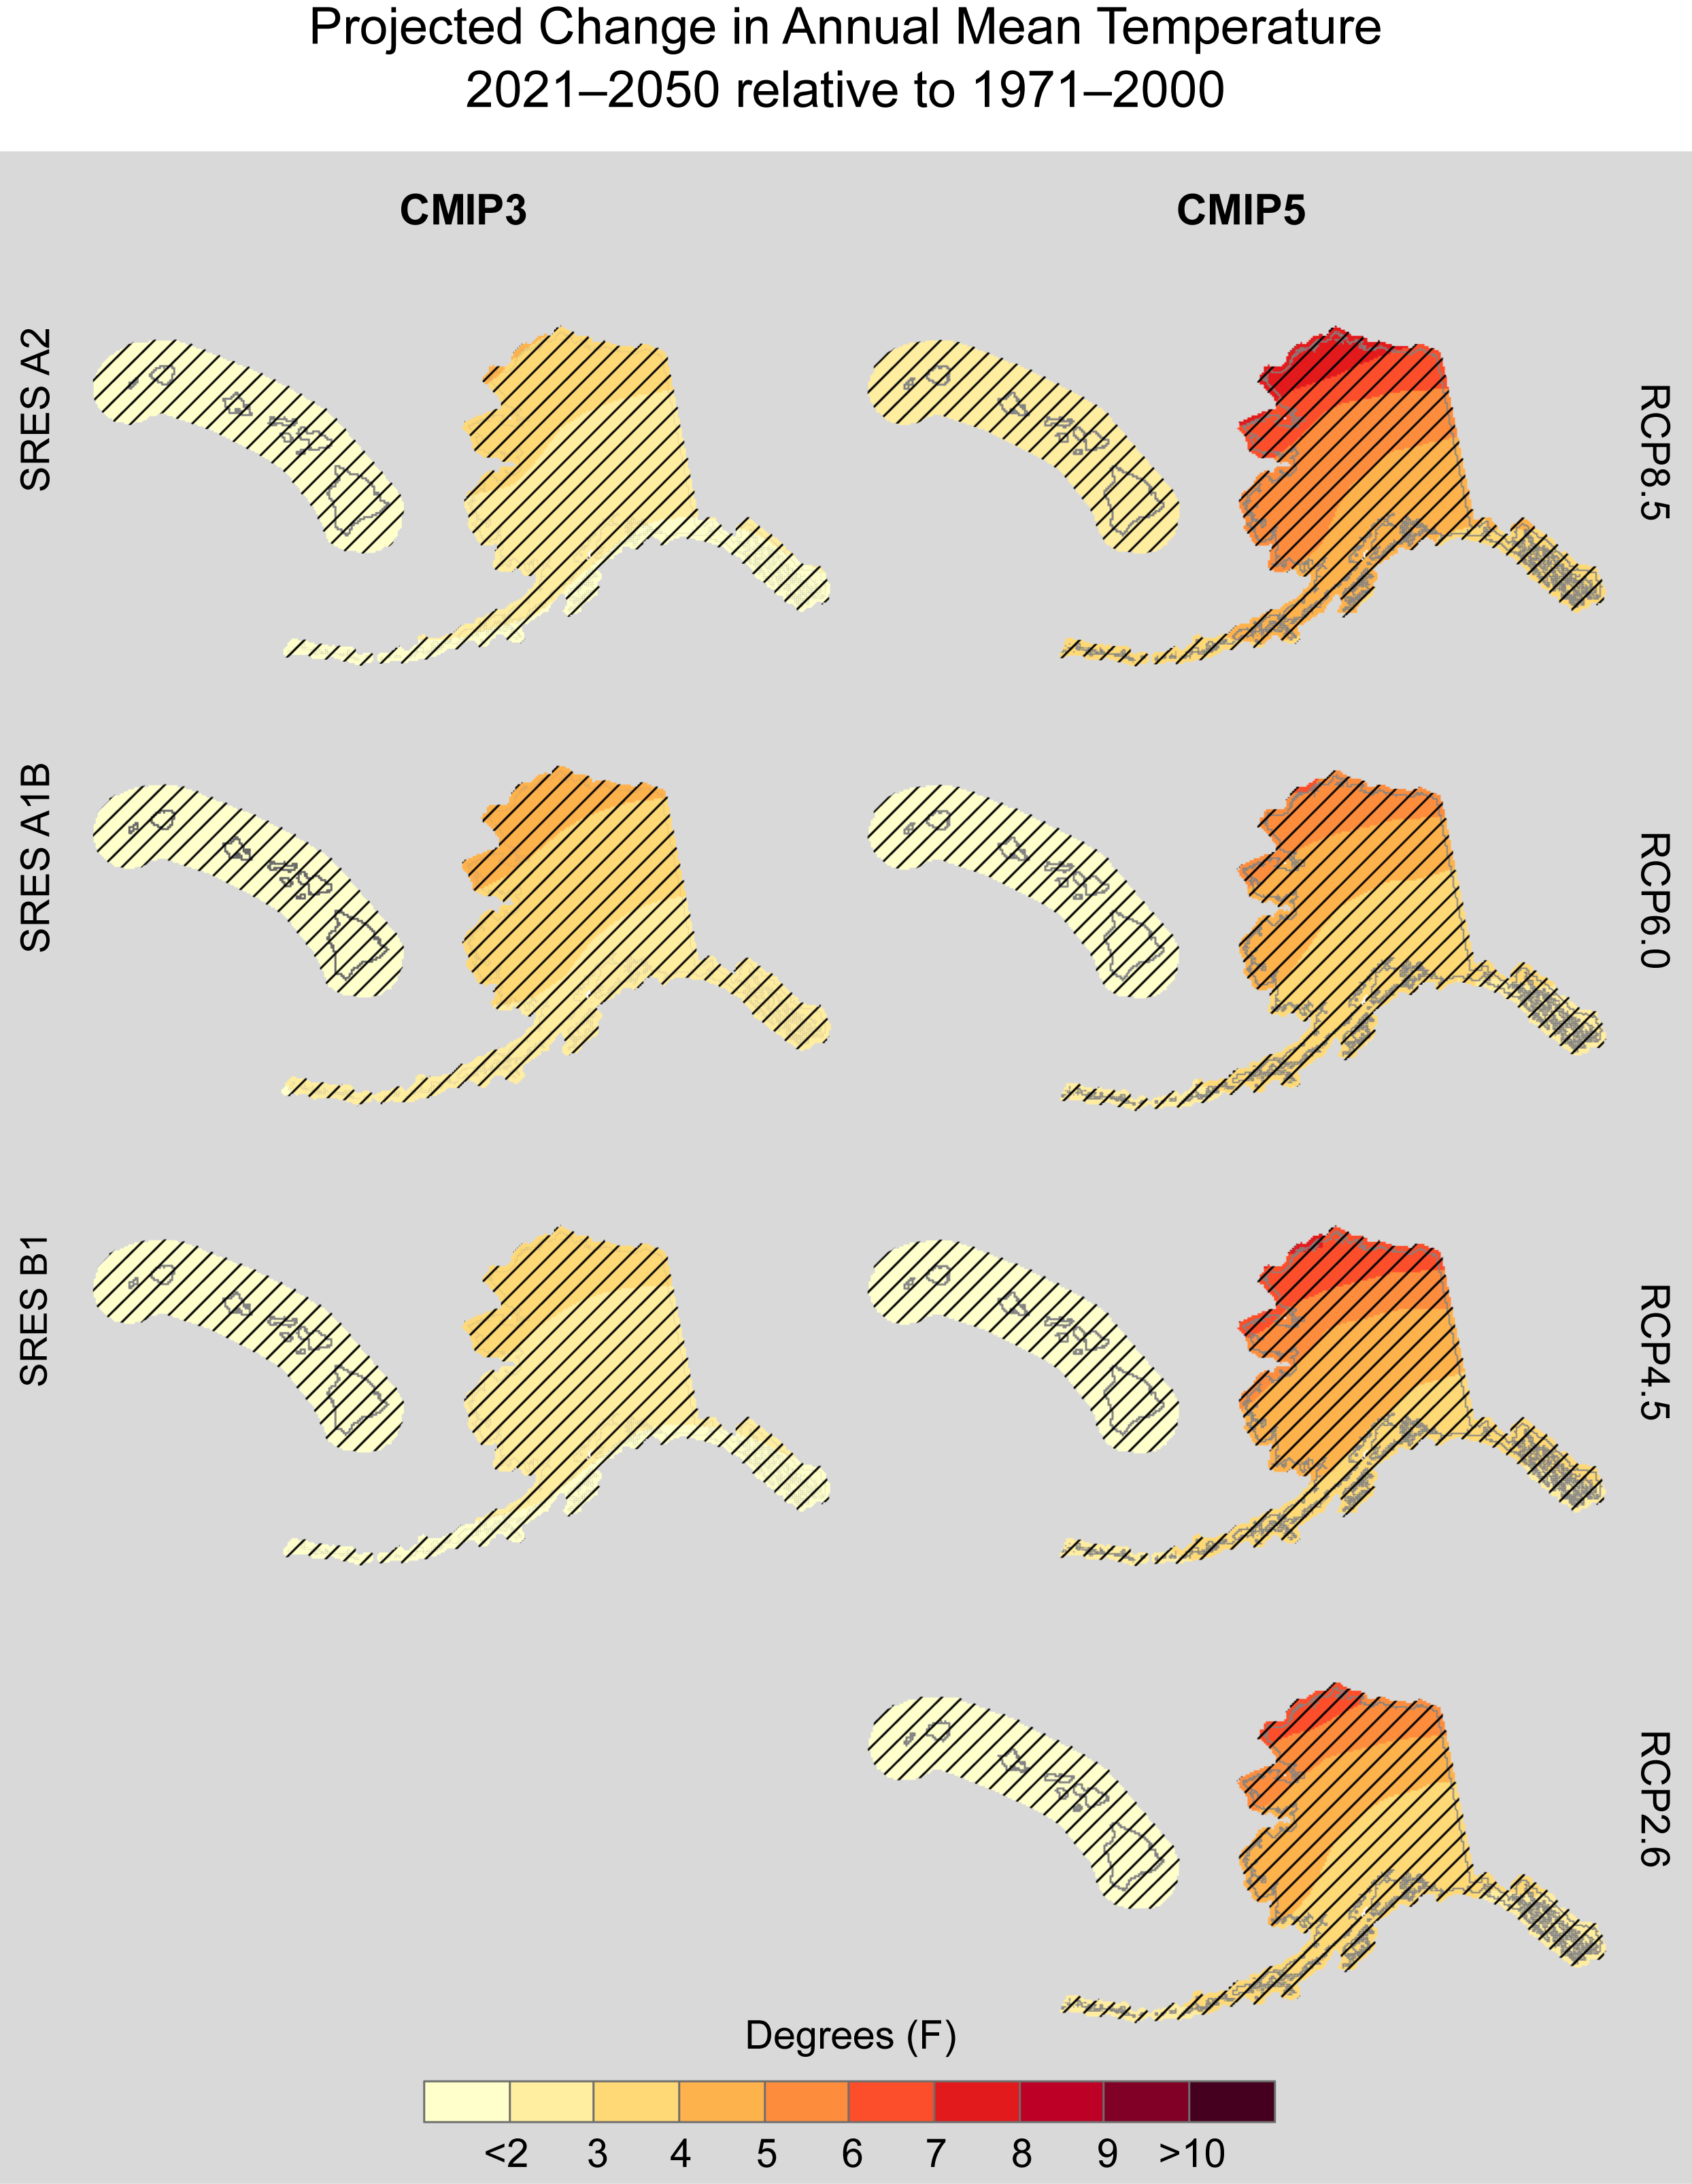
Projected Change in Annual Mean Temperature; 2021-2050 relative to 1971-2000 (Alaska and Hawaii)
Projected change in annual mean temperature (°F) for Alaska and Hawai‘i, for 2021–2050 with respect to the reference period of 1971–2000. These are multi-model means using CMIP3 SRES A2, A1B, and B1 scenarios (left column), and CMIP5 RCP8.5, 6.0, 4.5, and 2.6 scenarios (right column). Color with hatching (category 3) indicates that more than 50% of the models show a statistically significant change, and more than 67% agree on the sign of the change (see Section 3).
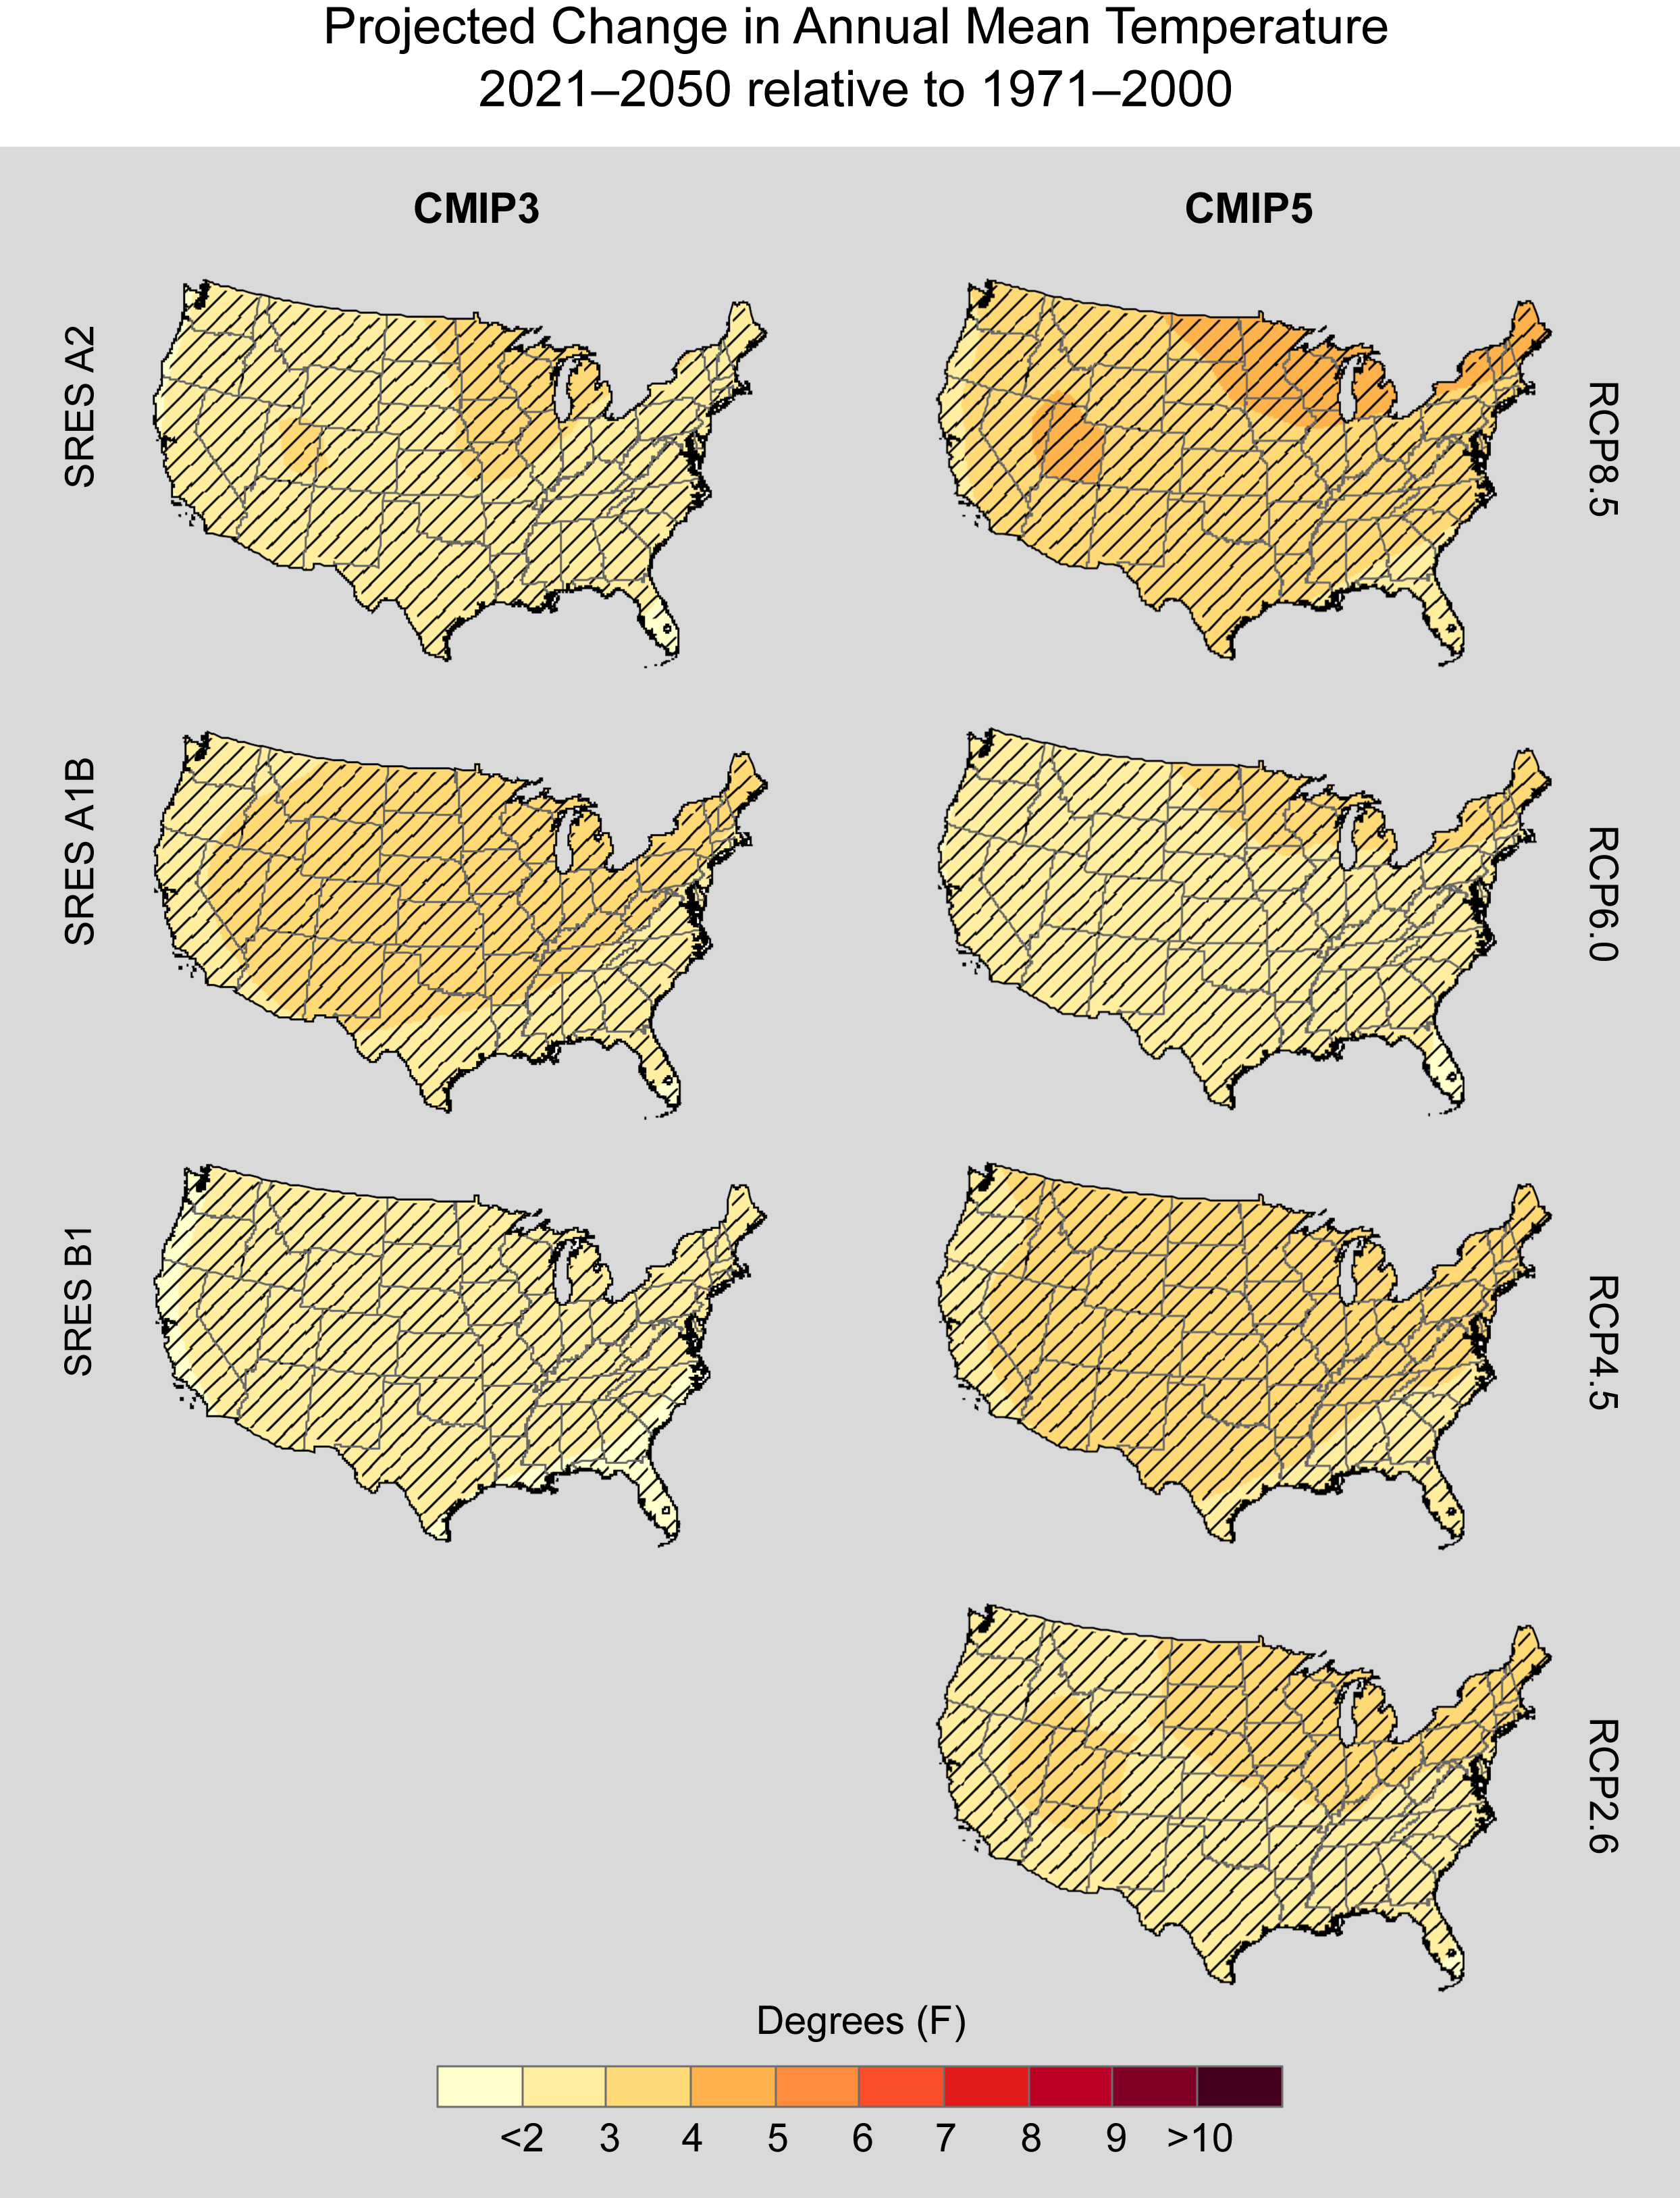
Projected Change in Annual Mean Temperature; 2021-2050 relative to 1971-2000
Projected change in annual mean temperature (°F) for the contiguous United States, for 2021–2050 with respect to the reference period of 1971–2000. These are multi-model means using CMIP3 SRES A2, A1B, and B1 scenarios (left column), and CMIP5 RCP8.5, 6.0, 4.5, and 2.6 scenarios (right column). Color with hatching (category 3) indicates that more than 50% of the models show a statistically significant change, and more than 67% agree on the sign of the change (see Section 3).
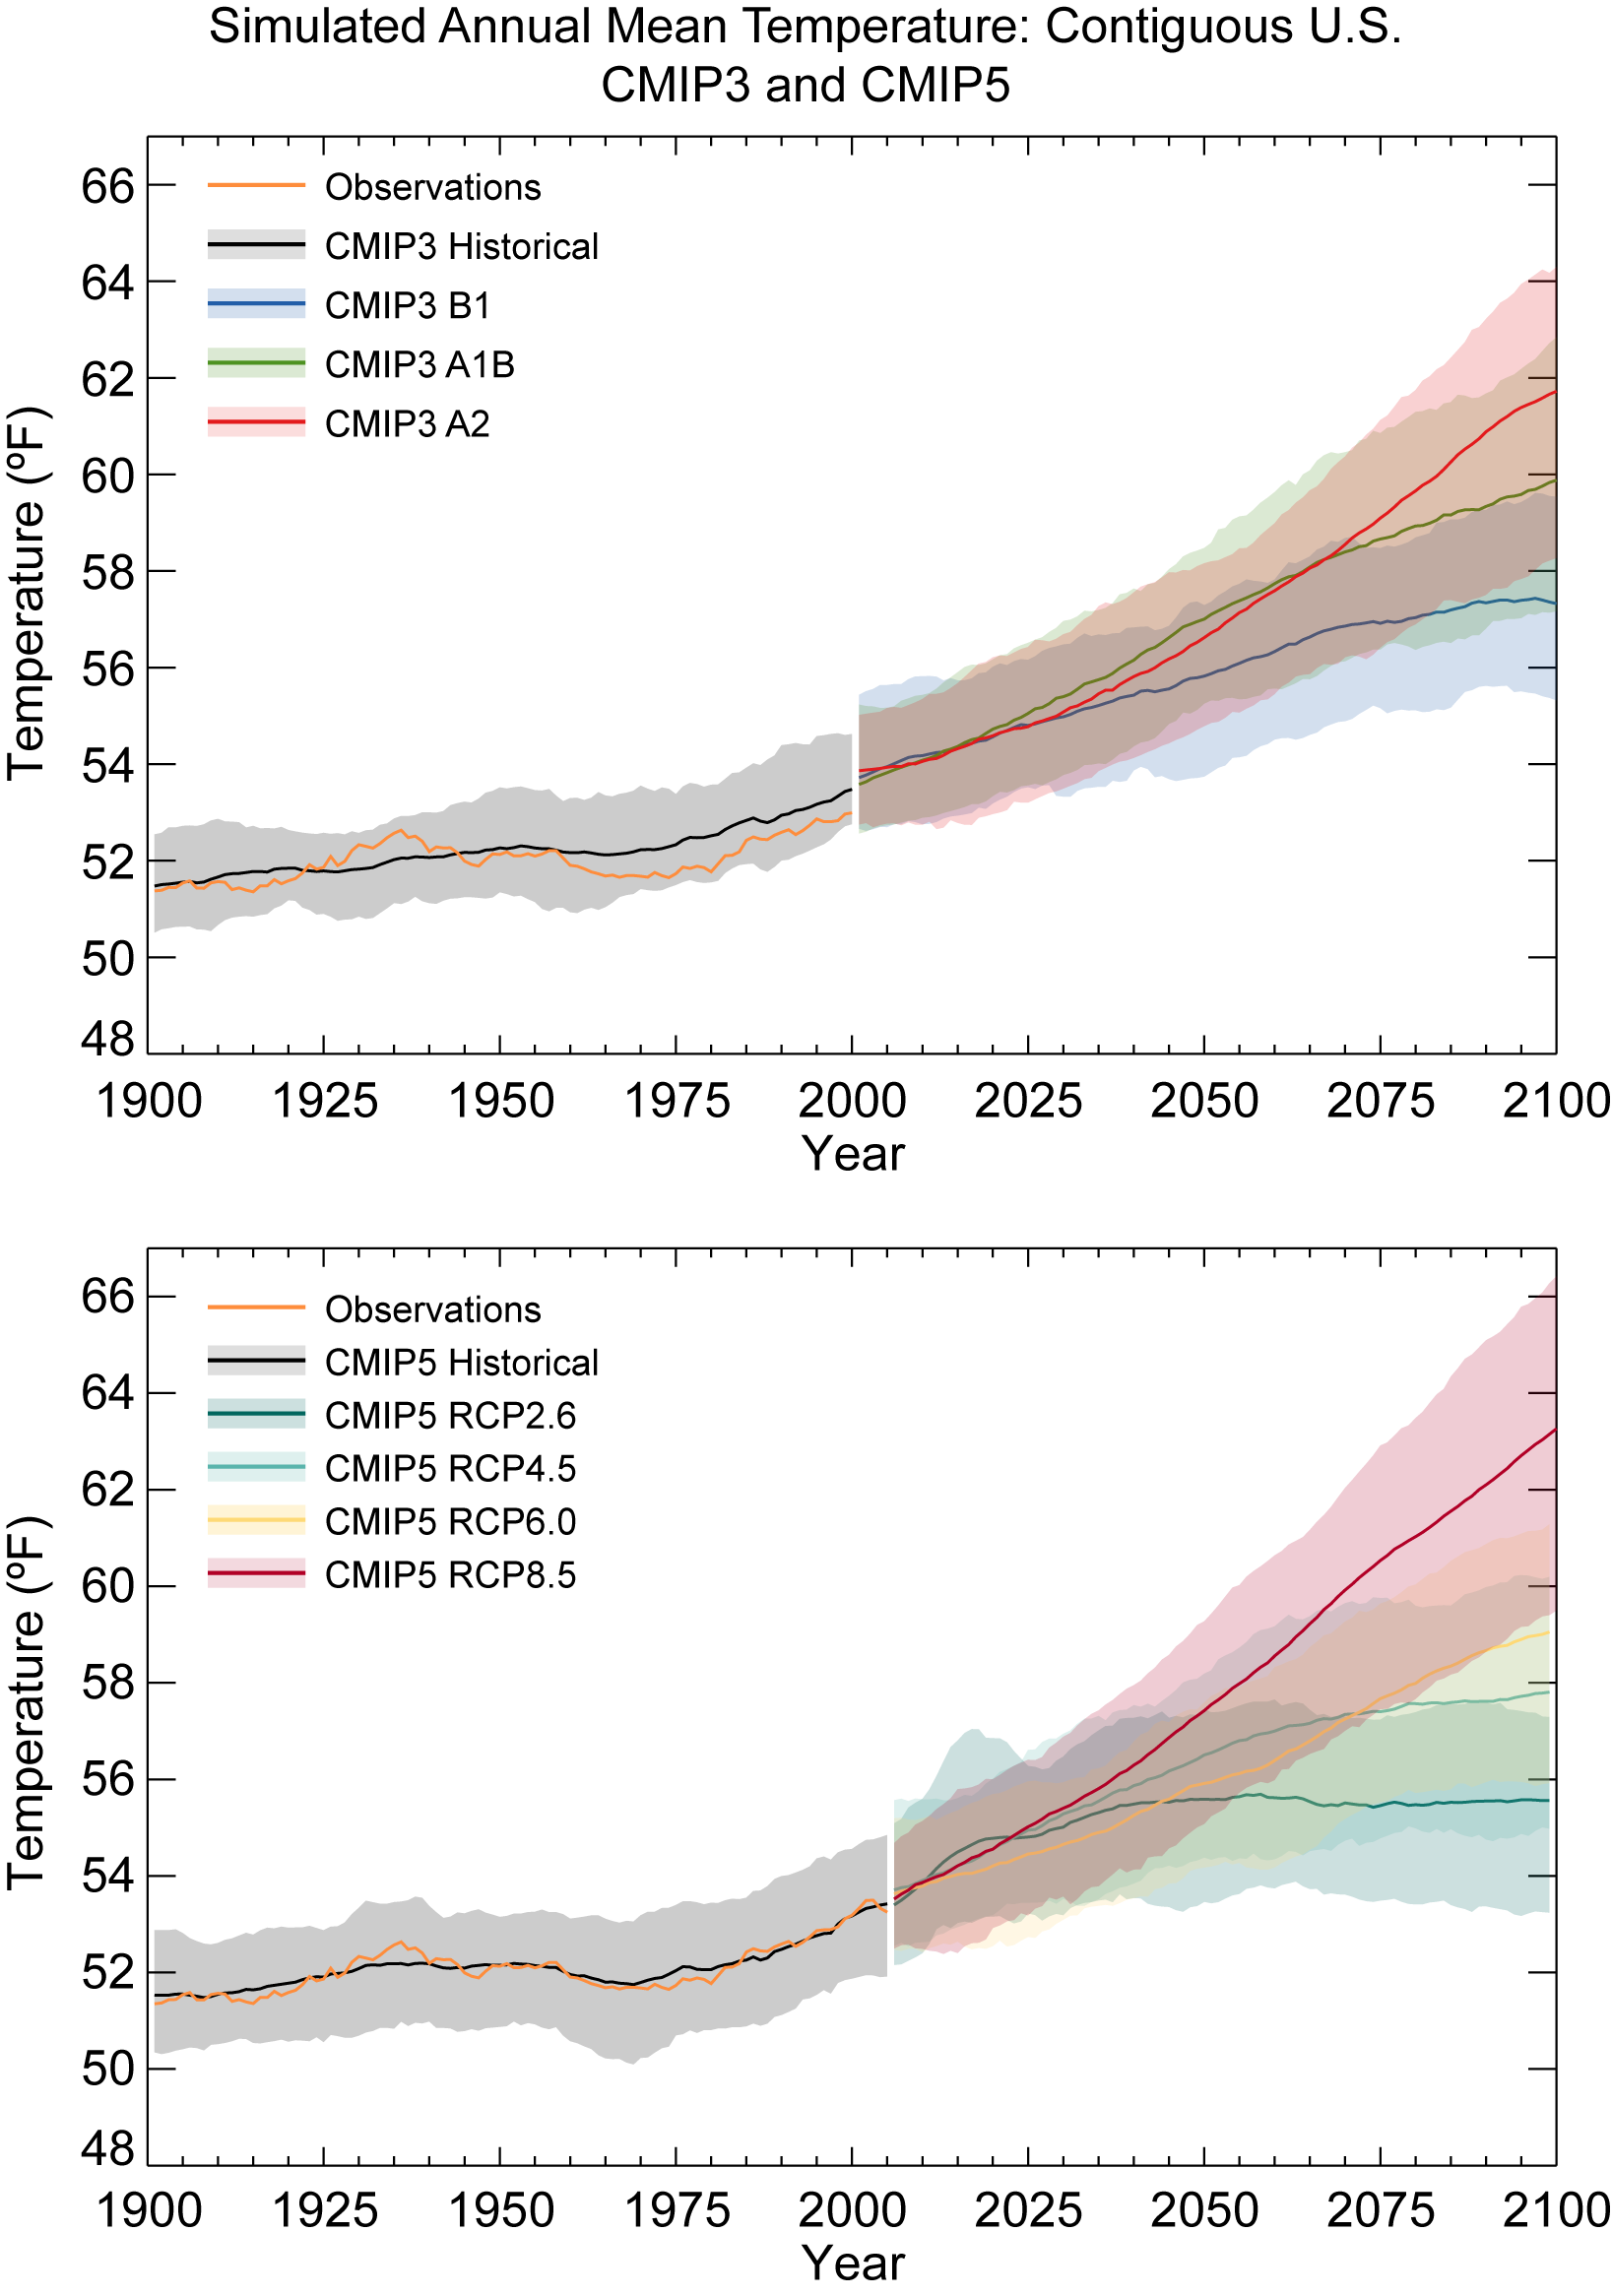
Simulated Annual Mean Temperature: Contiguous U.S.; CMIP3 and CMIP5
Simulated annual mean temperature (°F) for the contiguous U.S. for 1900–2100. The upper panel shows observations from NCEI’s Climate Divisional Dataset (nClimDiv, orange), multi-model mean simulations from CMIP3 for the historical period (black), and under the SRES B1 (blue), A1B (green), and A2 (red) scenarios. The lower panel shows observations from NCEI’s Climate Divisional Dataset (nClimDiv, orange), multi-model mean simulations from CMIP5 for the historical period (black), and under the RCP2.6 (dark teal), 4.5 (light teal), 6.0 (yellow), and 8.5 (dark red) scenarios. Shaded areas represent the smoothed range of 5th–95th percentile range of the model simulations. Data are smoothed with a 10-year moving boxcar average.
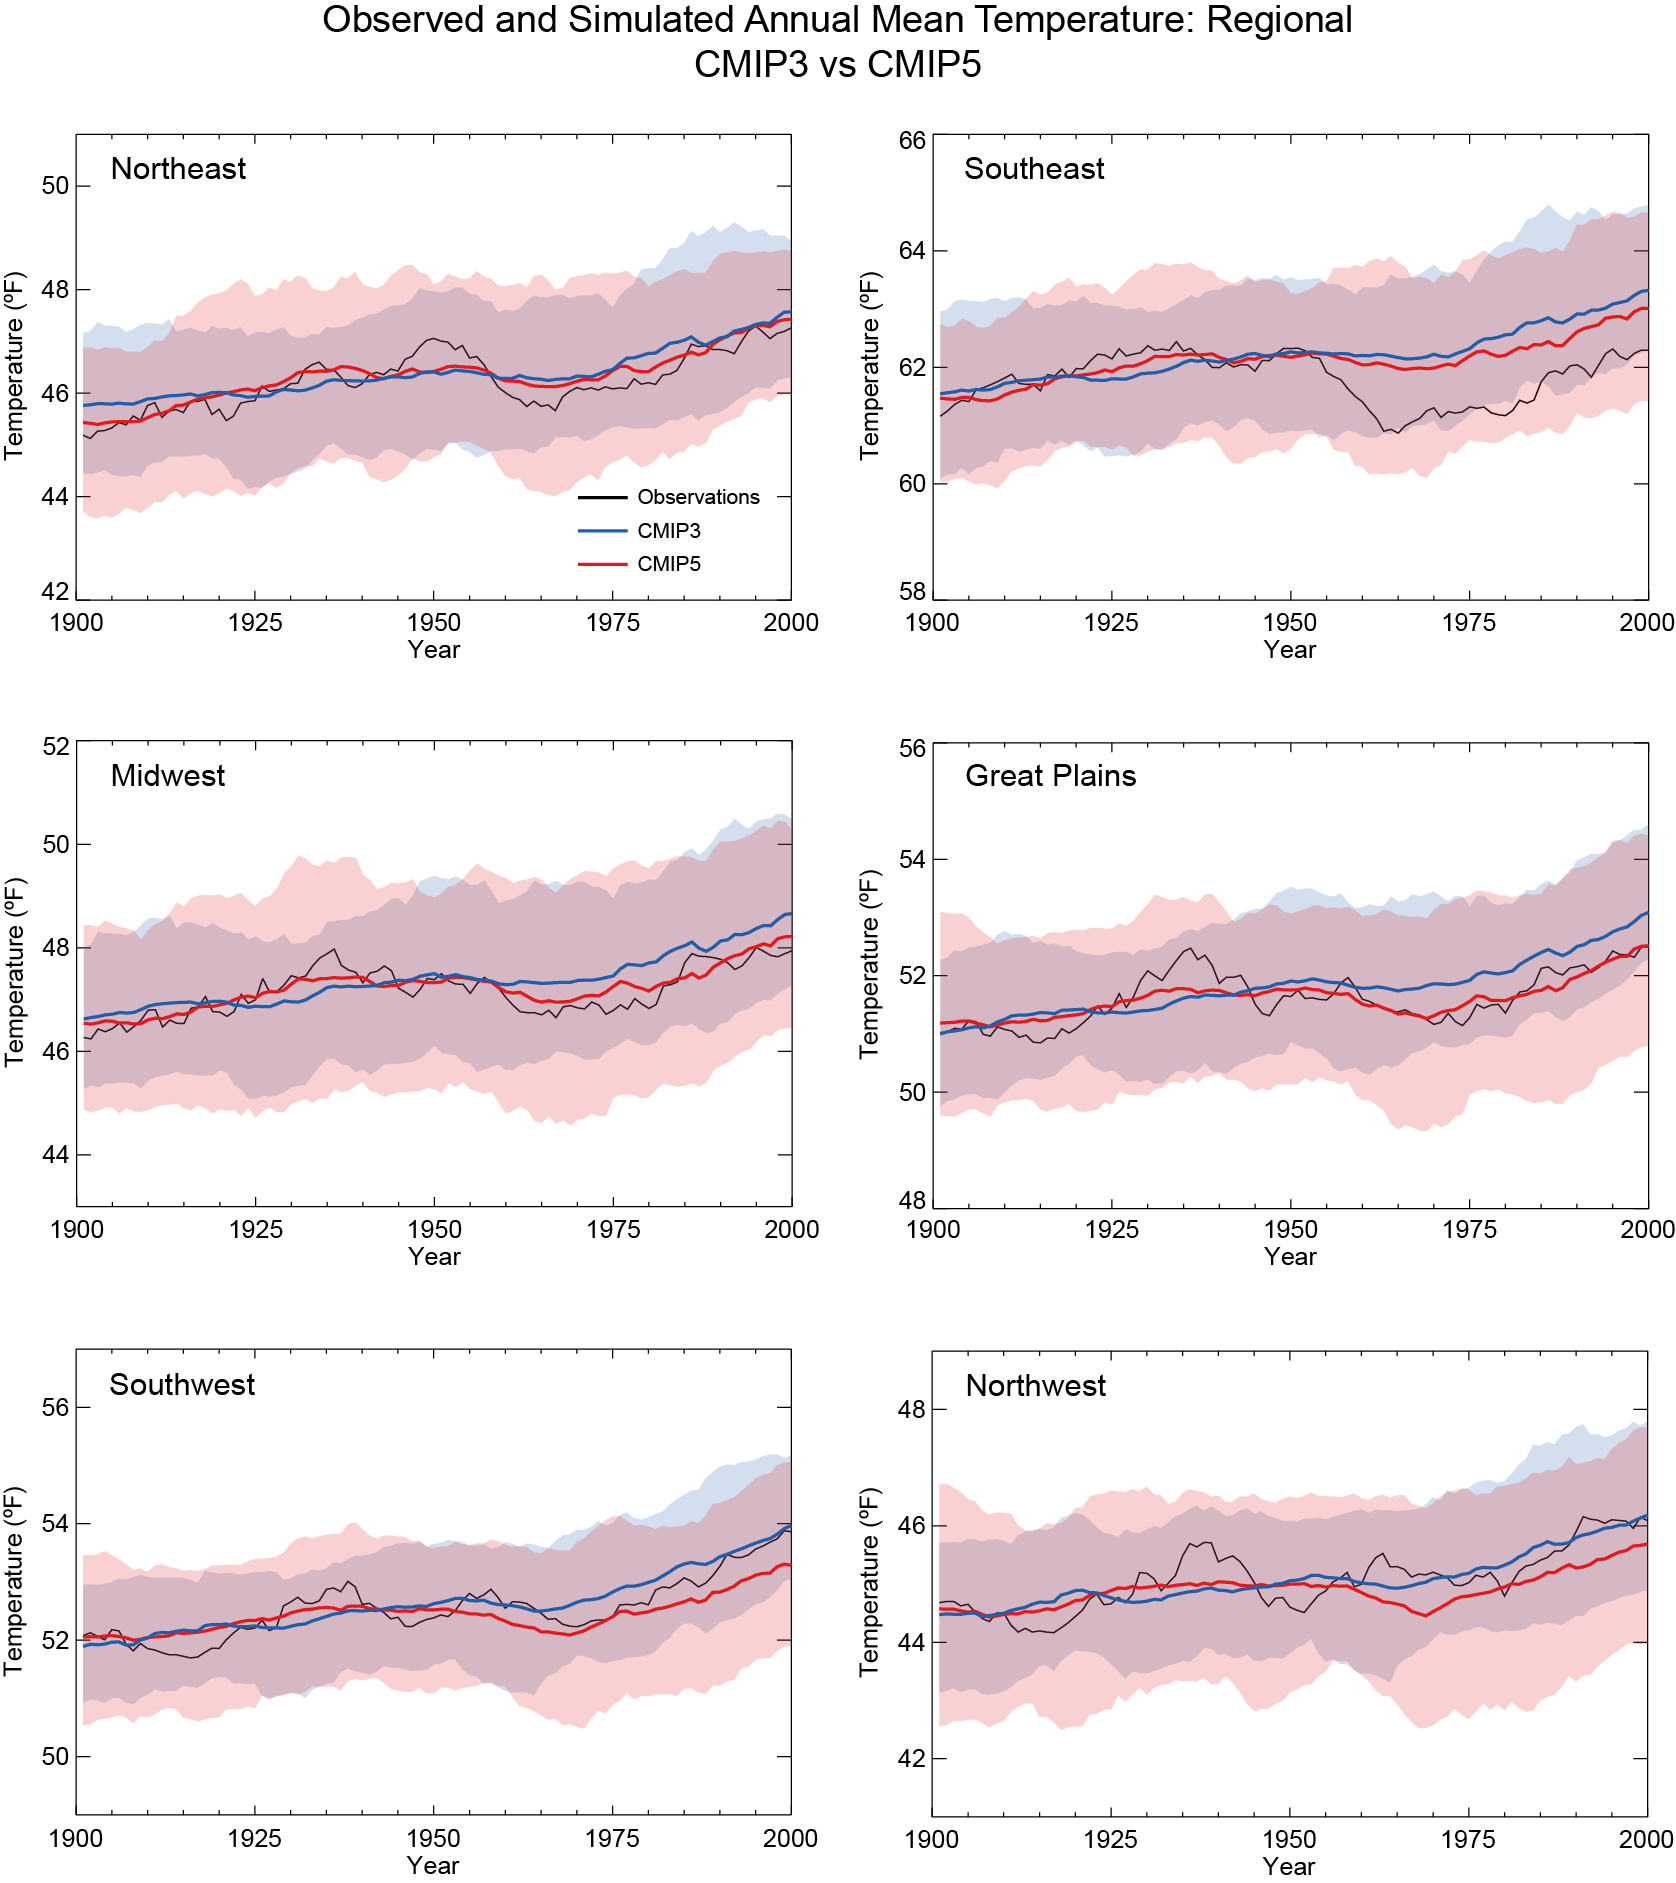
Observed and Simulated Annual Mean Temperature: Regional; CMIP3 vs CMIP5
Observed and simulated annual mean temperature (°F) for the six contiguous U.S. NCA regions for 1901–2000. Observational data are from NCEI’s Climate Divisional Dataset (nClimDiv, black); simulations are multi-model means from CMIP3 (blue) and CMIP5 (red). Shaded areas represent the smoothed range of 5th–95th percentile range of the model simulations. Data are smoothed with a 10-year moving boxcar average. Note: these time series are on unique scales for each region.
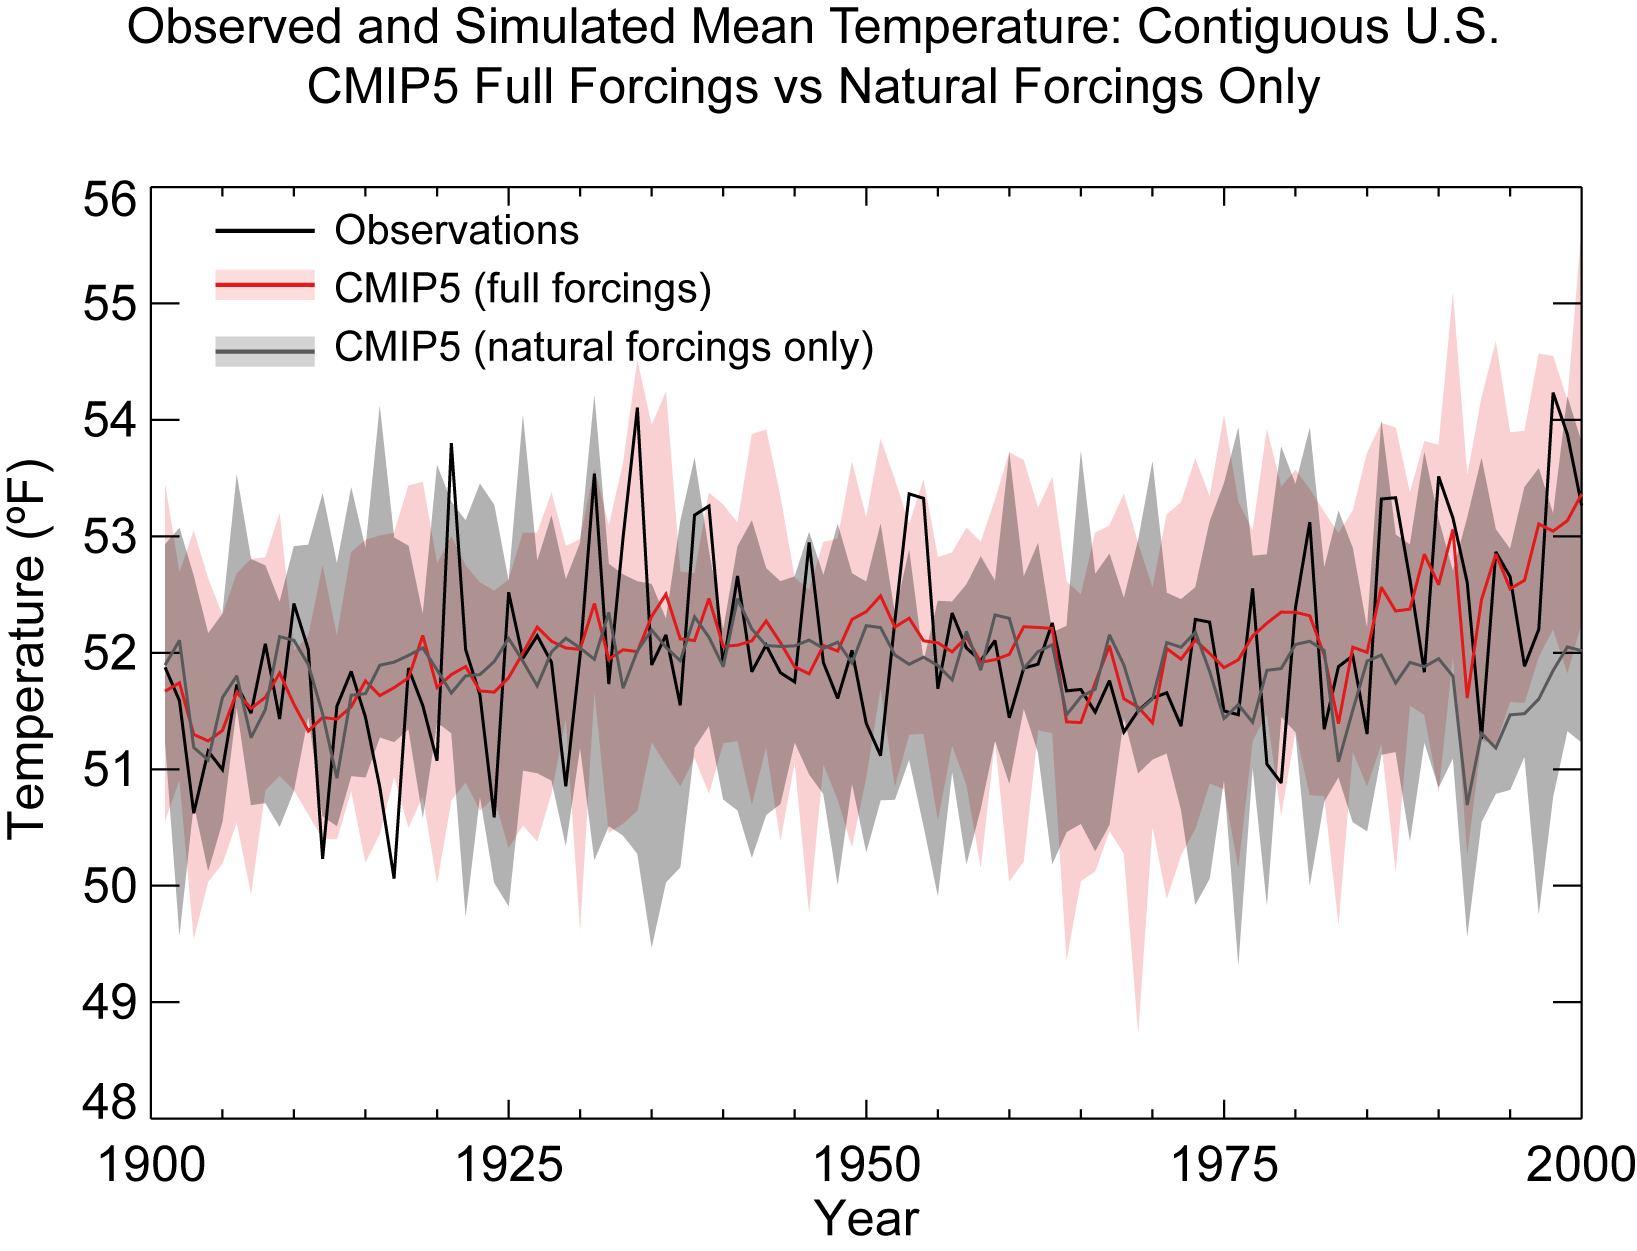
Observed and Simulated Mean Temperature: Contiguous U.S.: CMIP5 Full Forcings vs Natural Forcings On
Observed and simulated annual mean temperature (°F) for the contiguous U.S. for 1901–2000. Observational data are from NCEI’s Climate Divisional Dataset (nClimDiv, black); simulations are CMIP5 multi-model means using full forcings (red) and natural forcings only (gray). Shaded areas represent the 5th–95th percentile range of the model simulations.