Data from the Third National Climate Assessment
The following figures were created by the National Climate Assessment (NCA) Technical Support Unit (TSU) for the third NCA report published in May, 2014.
Click “Download data files” to download the relevant data files.
Please cite the following reference when using any of these figures:
Melillo, Jerry M., Terese (T.C.) Richmond, and Gary W. Yohe, Eds., 2014: Climate Change Impacts in the United States: The Third National Climate Assessment. U.S. Global Change Research Program, 841 pp. doi:10.7930/J0Z31WJ2.
The full third National Climate Assessment report can be found online at: http://nca2014.globalchange.gov/
Note: several of these files use 1/8 degree-CONUS Daily Downscaled Climate Projections by Katharine Hayhoe. The link provided for that dataset in the relevant README files is now broken. Please use this link instead: https://cida.usgs.gov/thredds/catalog.html
NCA3 Data Figures
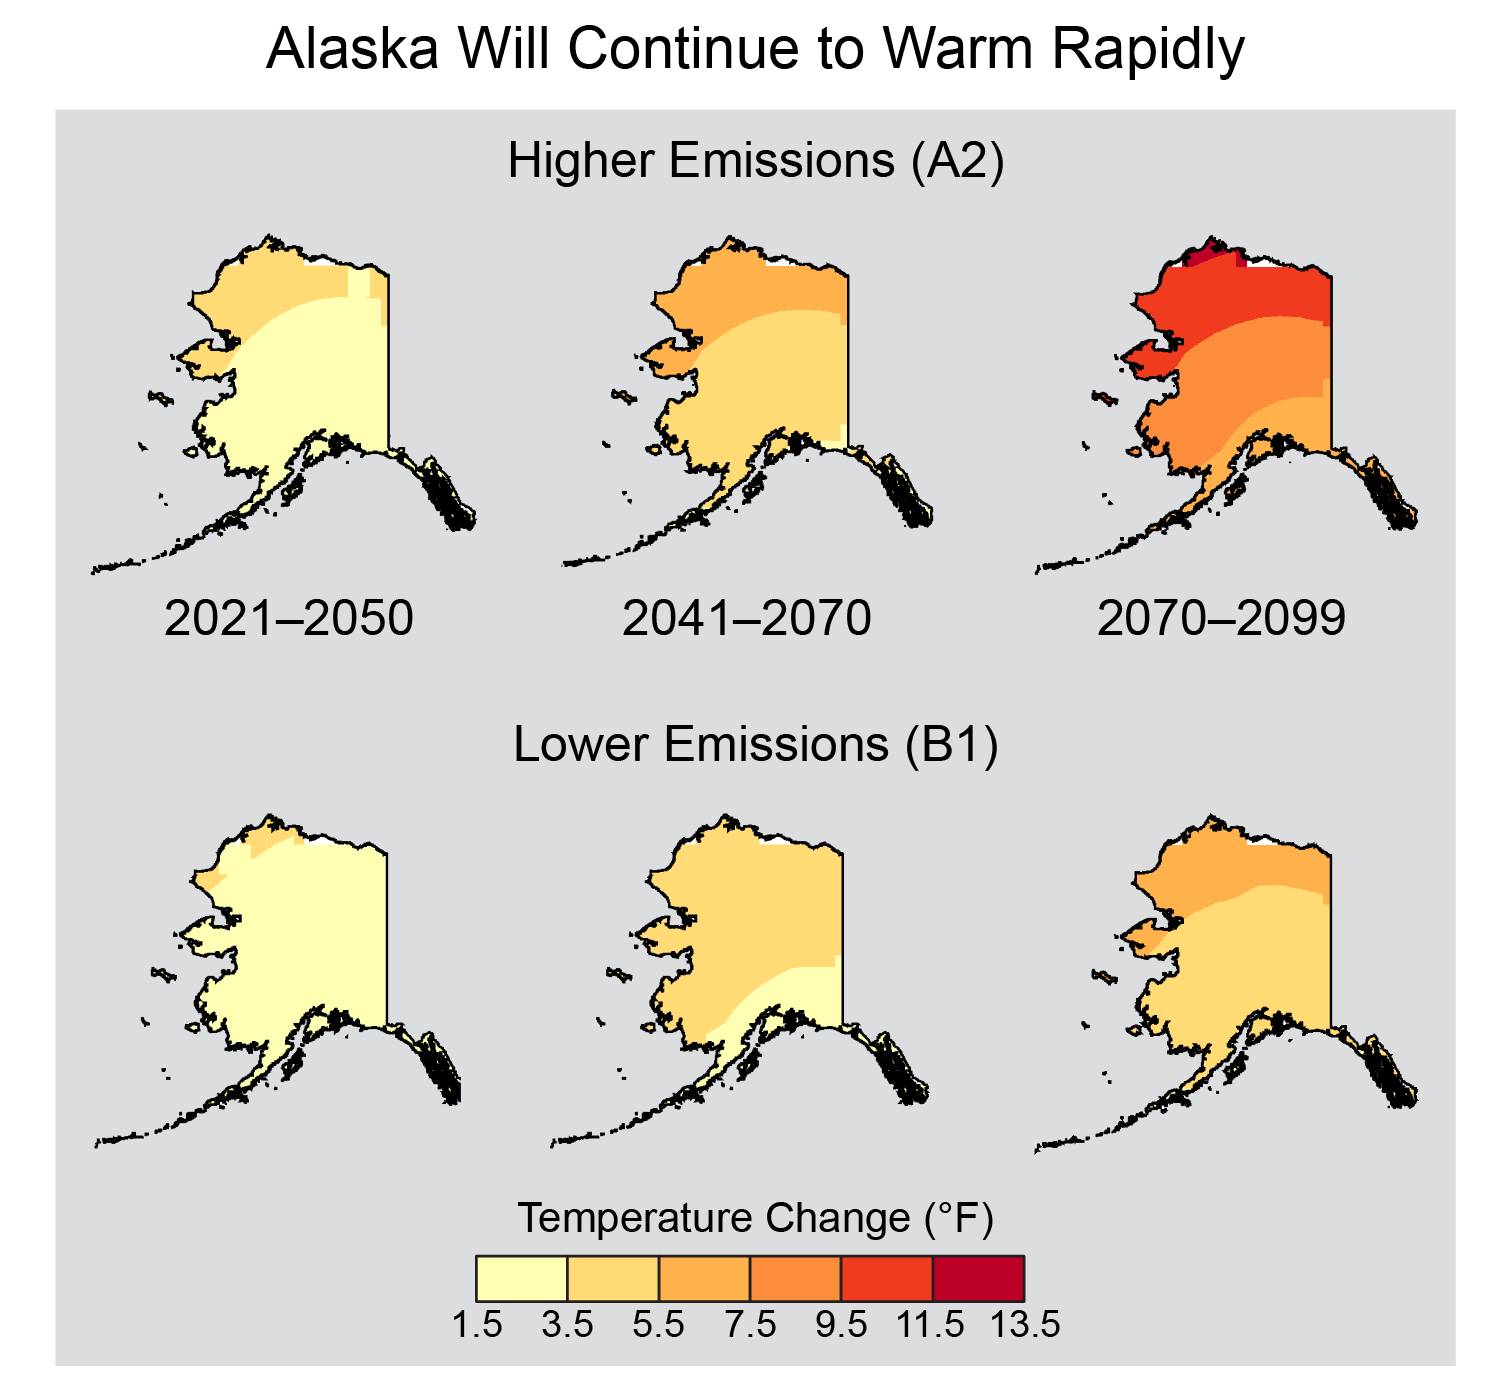
Alaska Will Continue to Warm Rapidly
Northern latitudes are warming faster than more temperate regions, and Alaska has already warmed much faster than the rest of the country. Maps show changes in temperature, relative to 1971-1999, projected for Alaska in the early, middle, and late parts of this century, if heat-trapping gas (also known as greenhouse gas) emissions continue to increase (higher emissions, A2), or are substantially reduced (lower emissions, B1). (Figure source: adapted from Stewart et al. 2013).
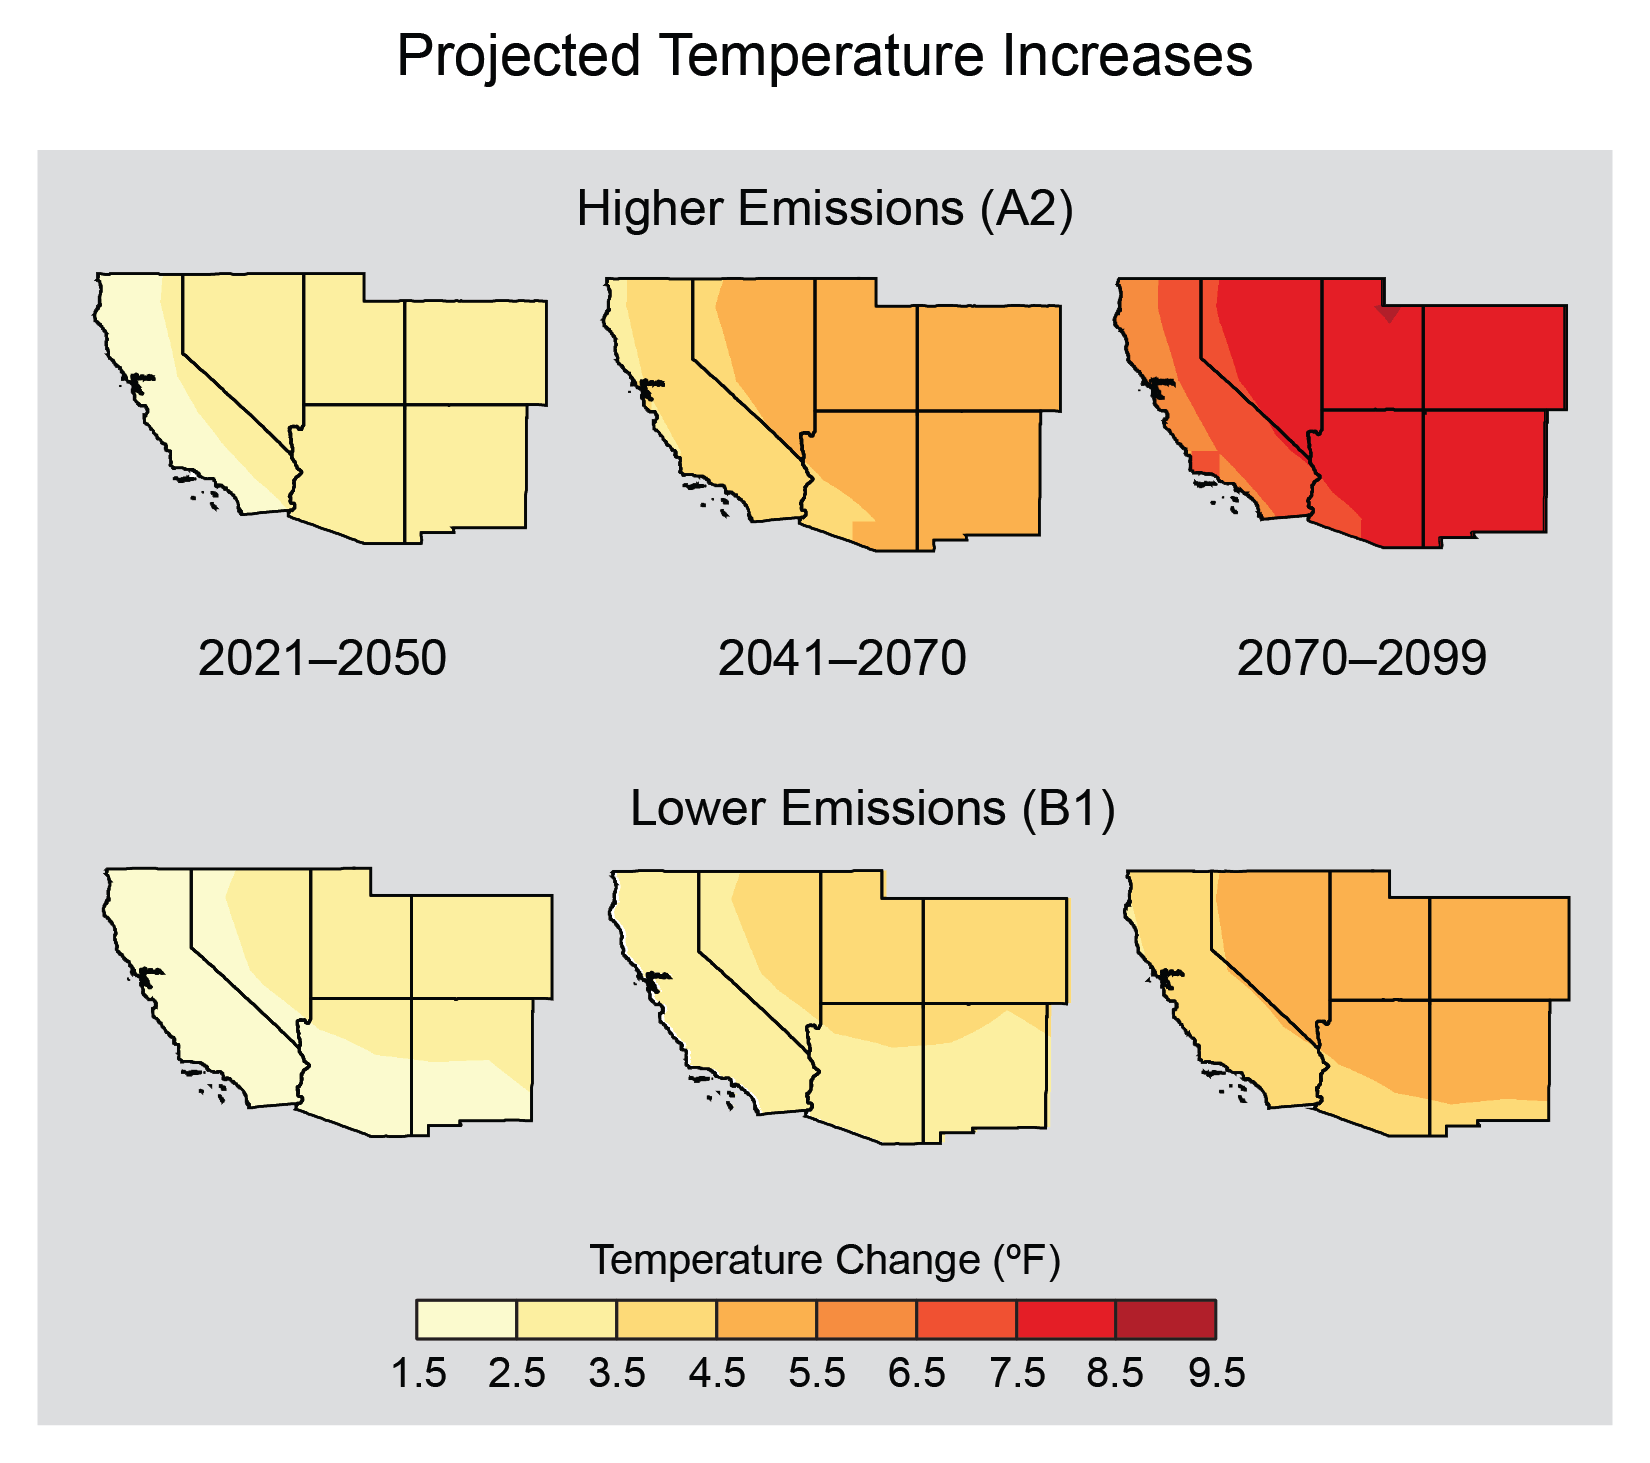
Projected Temperature Increases
Maps show projected changes in average, as compared to 1971-1999. Top row shows projections assuming heat-trapping gas emissions continue to rise (A2). Bottom row shows projections assuming substantial reductions in emissions (B1). (Figure source: adapted from Kunkel et al. 2013).

Projected Changes in Seasonal Precipitation
Climate change affects precipitation patterns as well as temperature patterns. The maps show projected changes in average precipitation by season for 2041–2070 compared to 1971–1999, assuming emissions of heat-trapping gases continue to rise (A2 scenario). Note significantly drier conditions in the Southwest in spring and Northwest in summer, as well as significantly more precipitation (some of which could fall as snow) projected for northern areas in winter and spring.Hatched areas indicate that the projected changes are significant and consistent among models. White areas indicate that the changes are not projected to be larger than could be expected fromnatural variability. (Figure source: NOAA NCEI / CICS-NC).

Newer Simulations for Projected Precipitation Change (CMIP5 models)
Seasonal precipitation change for 2071-2099 (compared to 1970-1999) as projected by recent simulations that include a wider range of scenarios. The maps on the left (RCP 2.6) assume rapid reductions in emissions – more than 70% cuts from current levels by 2050 – and a corresponding much smaller amount of warming and far less precipitation change. On the right, RCP 8.5 assumes continued increases in emissions, with associated large increases in warming and major precipitation changes. These would include, for example, large reductions in spring precipitation in the Southwest and large increases in the Northeast and Midwest. Rapid emissions reductions would be required for the more modest changes in the maps on the left. Hatched areas indicate that the projected changes are significant and consistent among models. White areas indicate that the changes are not projected to be larger than could be expected from natural variability. (Figure source: NOAA NCEI / CICS-NC).
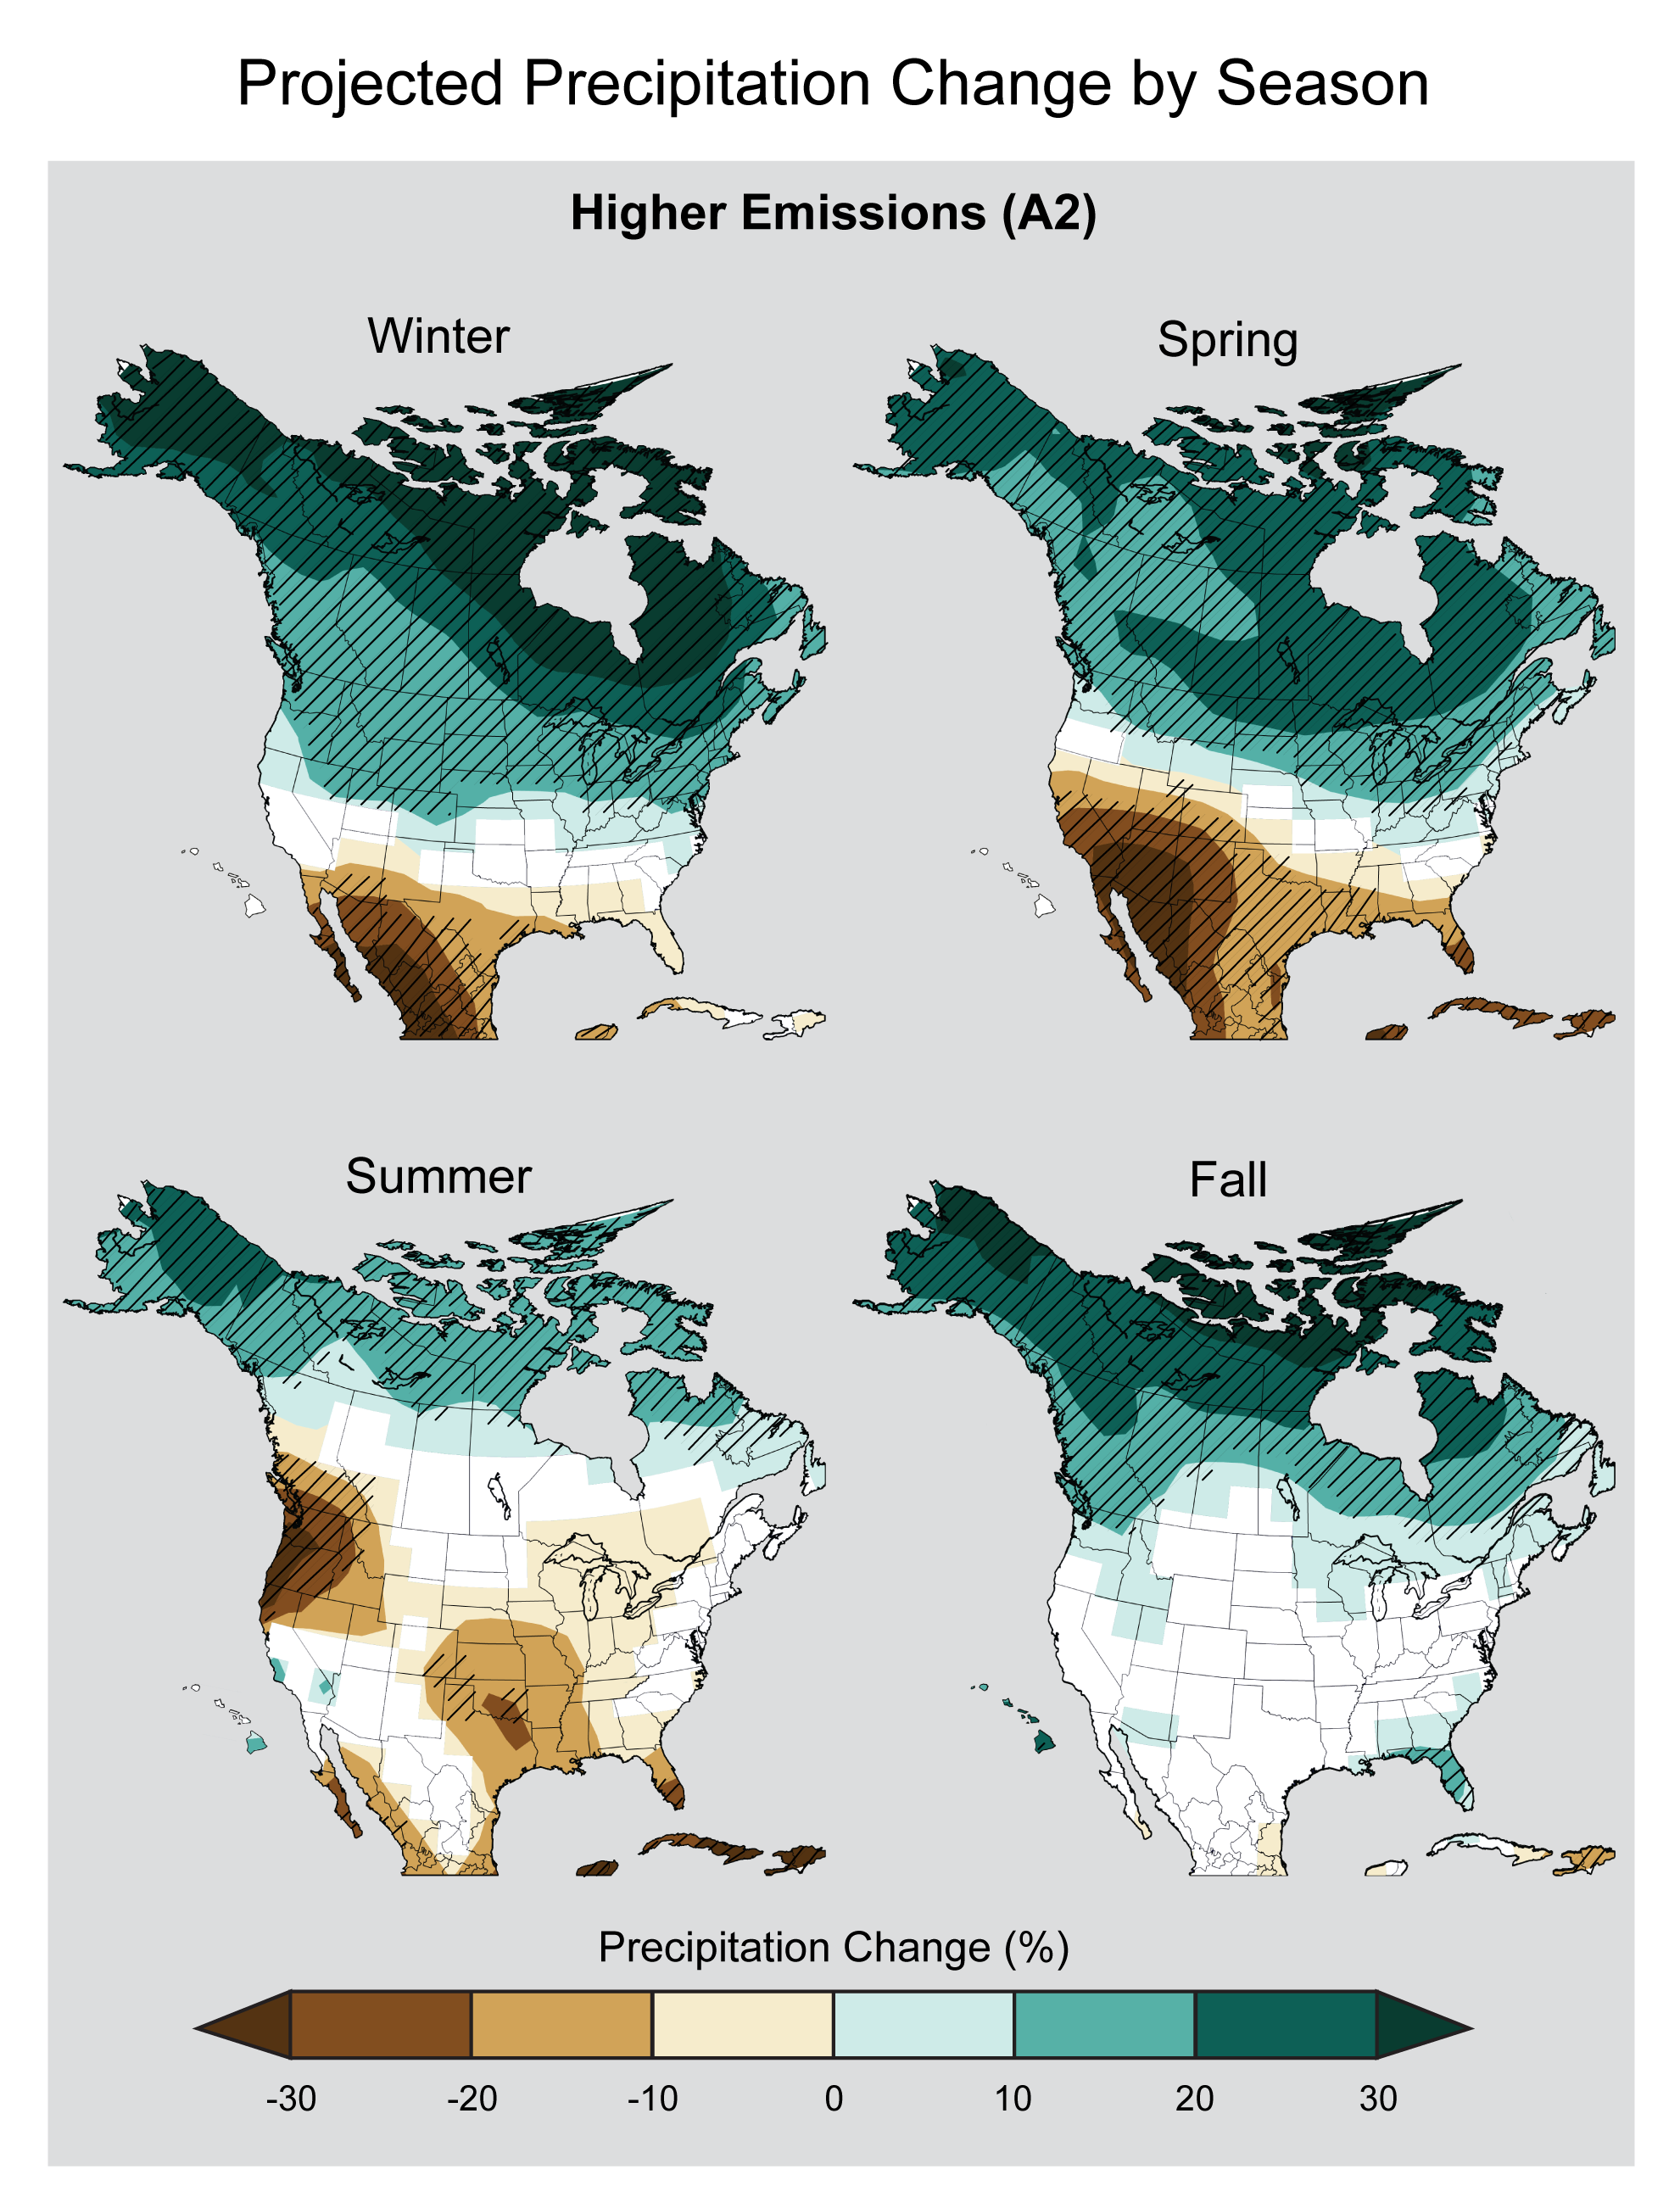
Projected Precipitation Change by Season
Projected change in seasonal precipitation for 2071-2099 (compared to 1970-1999) under an emissions scenario that assumes continued increases in emissions (A2).Hatched areas indicate that the projected changes are significant and consistent among models. White areas indicate that the changes are not projected to be larger than could be expected from natural variability. In general, the northern part of the U.S. is projected to see more winter and spring precipitation, while the southwestern U.S. is projected to experience less precipitation in the spring. (Figure source: NOAA NCEI / CICS-NC).

Temperature and Precipitation Distribution in the Great Plains
The region has a distinct north-south gradient in average temperature patterns (left), with a hotter south and colder north. For precipitation (right), the regional gradient runs west-east, with a wetter east and a much drier west. Averages shown here are for the period 1981-2010. (Figure source: adapted from Kunkel et al. 2013).

Projected Temperature Change by 2071-2099 (CMIP5 models)
The largest uncertainty in projecting climate change beyond the next few decades is the level of heat-trapping gas emissions. The most recent model projections (CMIP5) take into account a wider range of options with regard to human behavior, including a lower scenario than has been considered before (RCP 2.6). This scenario assumes rapid reductions in emissions – more than 70% cuts from current levels by 2050 and further large decreases by 2100 – and the corresponding smaller amount of warming. On the higher end, the scenarios include one that assumes continued increases in emissions (RCP 8.5) and the corresponding greater amount of warming. Also shown are temperature changes for the intermediate scenarios RCP 4.5 (which is most similar to B1) and RCP 6.0 (which is most similar to A1B; see Appendix 3: Climate Science Supplement). Projections show change in average temperature in the later part of this century (2071-2099) relative to the late part of last century (1970-1999). (Figure source: NOAA NCEI / CICS-NC).
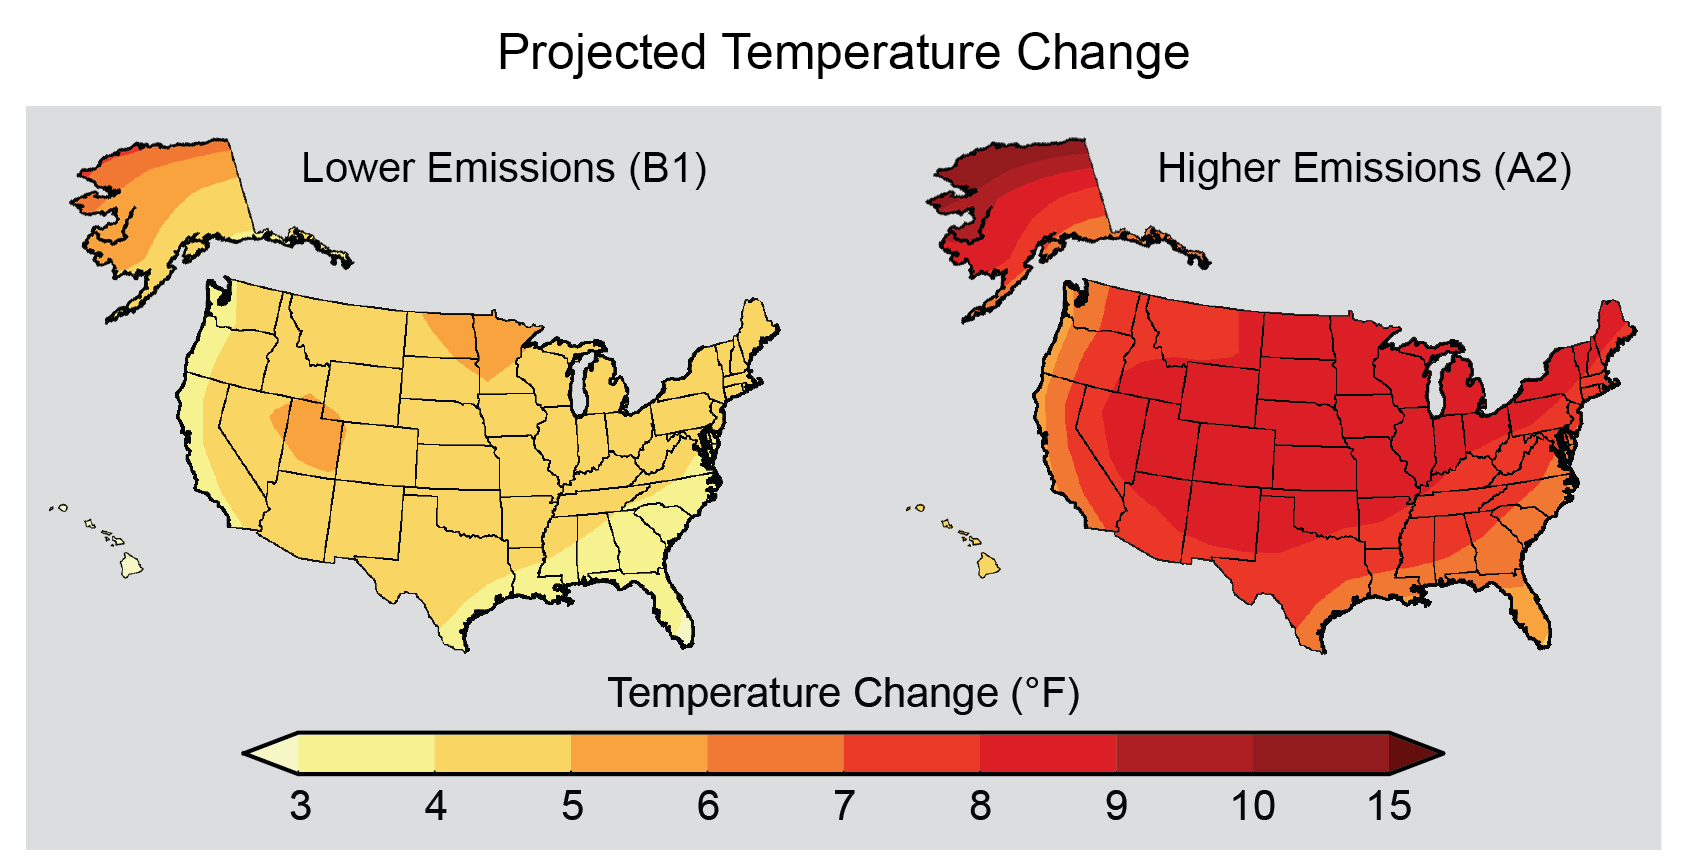
Projected Temperature Change
Maps show projected change in average surface air temperature in the later part of this century (2071-2099) relative to the later part of the last century (1970-1999) under a scenario that assumes substantial reductions in heat trapping gases (B1) and a higher emissions scenario that assumes continued increases in global emissions (A2). (See Appendix 3: Climate Science, Supplemental Message 5 for a discussion of temperature changes under a wider range of future scenarios for various periods of this century). (Figure source: NOAA NCEI / CICS-NC).
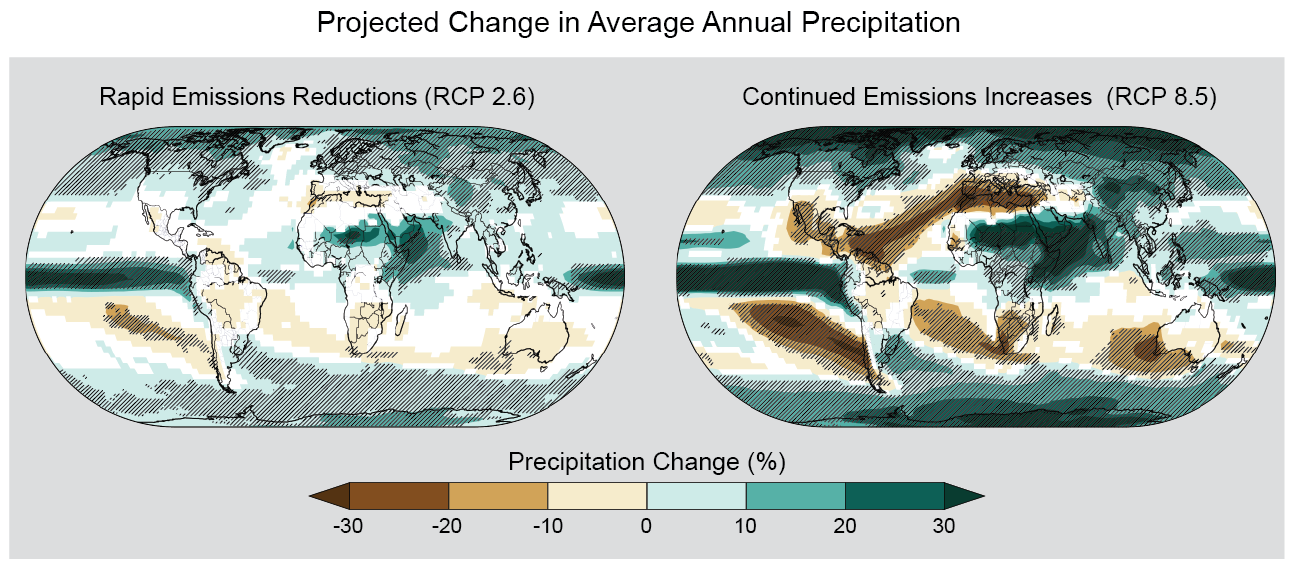
Projected Change in Average Annual Precipitation
Projected change in average annual precipitation over the period 2071-2099 (compared to the period 1970-1999) under a low scenario that assumes rapid reductions in emissions and concentrations of heat-trapping gasses (RCP 2.6), and a higher scenario that assumes continued increases in emissions (RCP 8.5). Hatched areas indicate confidence that the projected changes are significant and consistent among models. White areas indicate that the changes are not projected to be larger than could be expected from natural variability. In general, northern parts of the U.S. (especially the Northeast and Alaska) are projected to receive more precipitation, while southern parts (especially the Southwest) are projected to receive less. (Figure source: NOAA NCEI / CICS-NC).
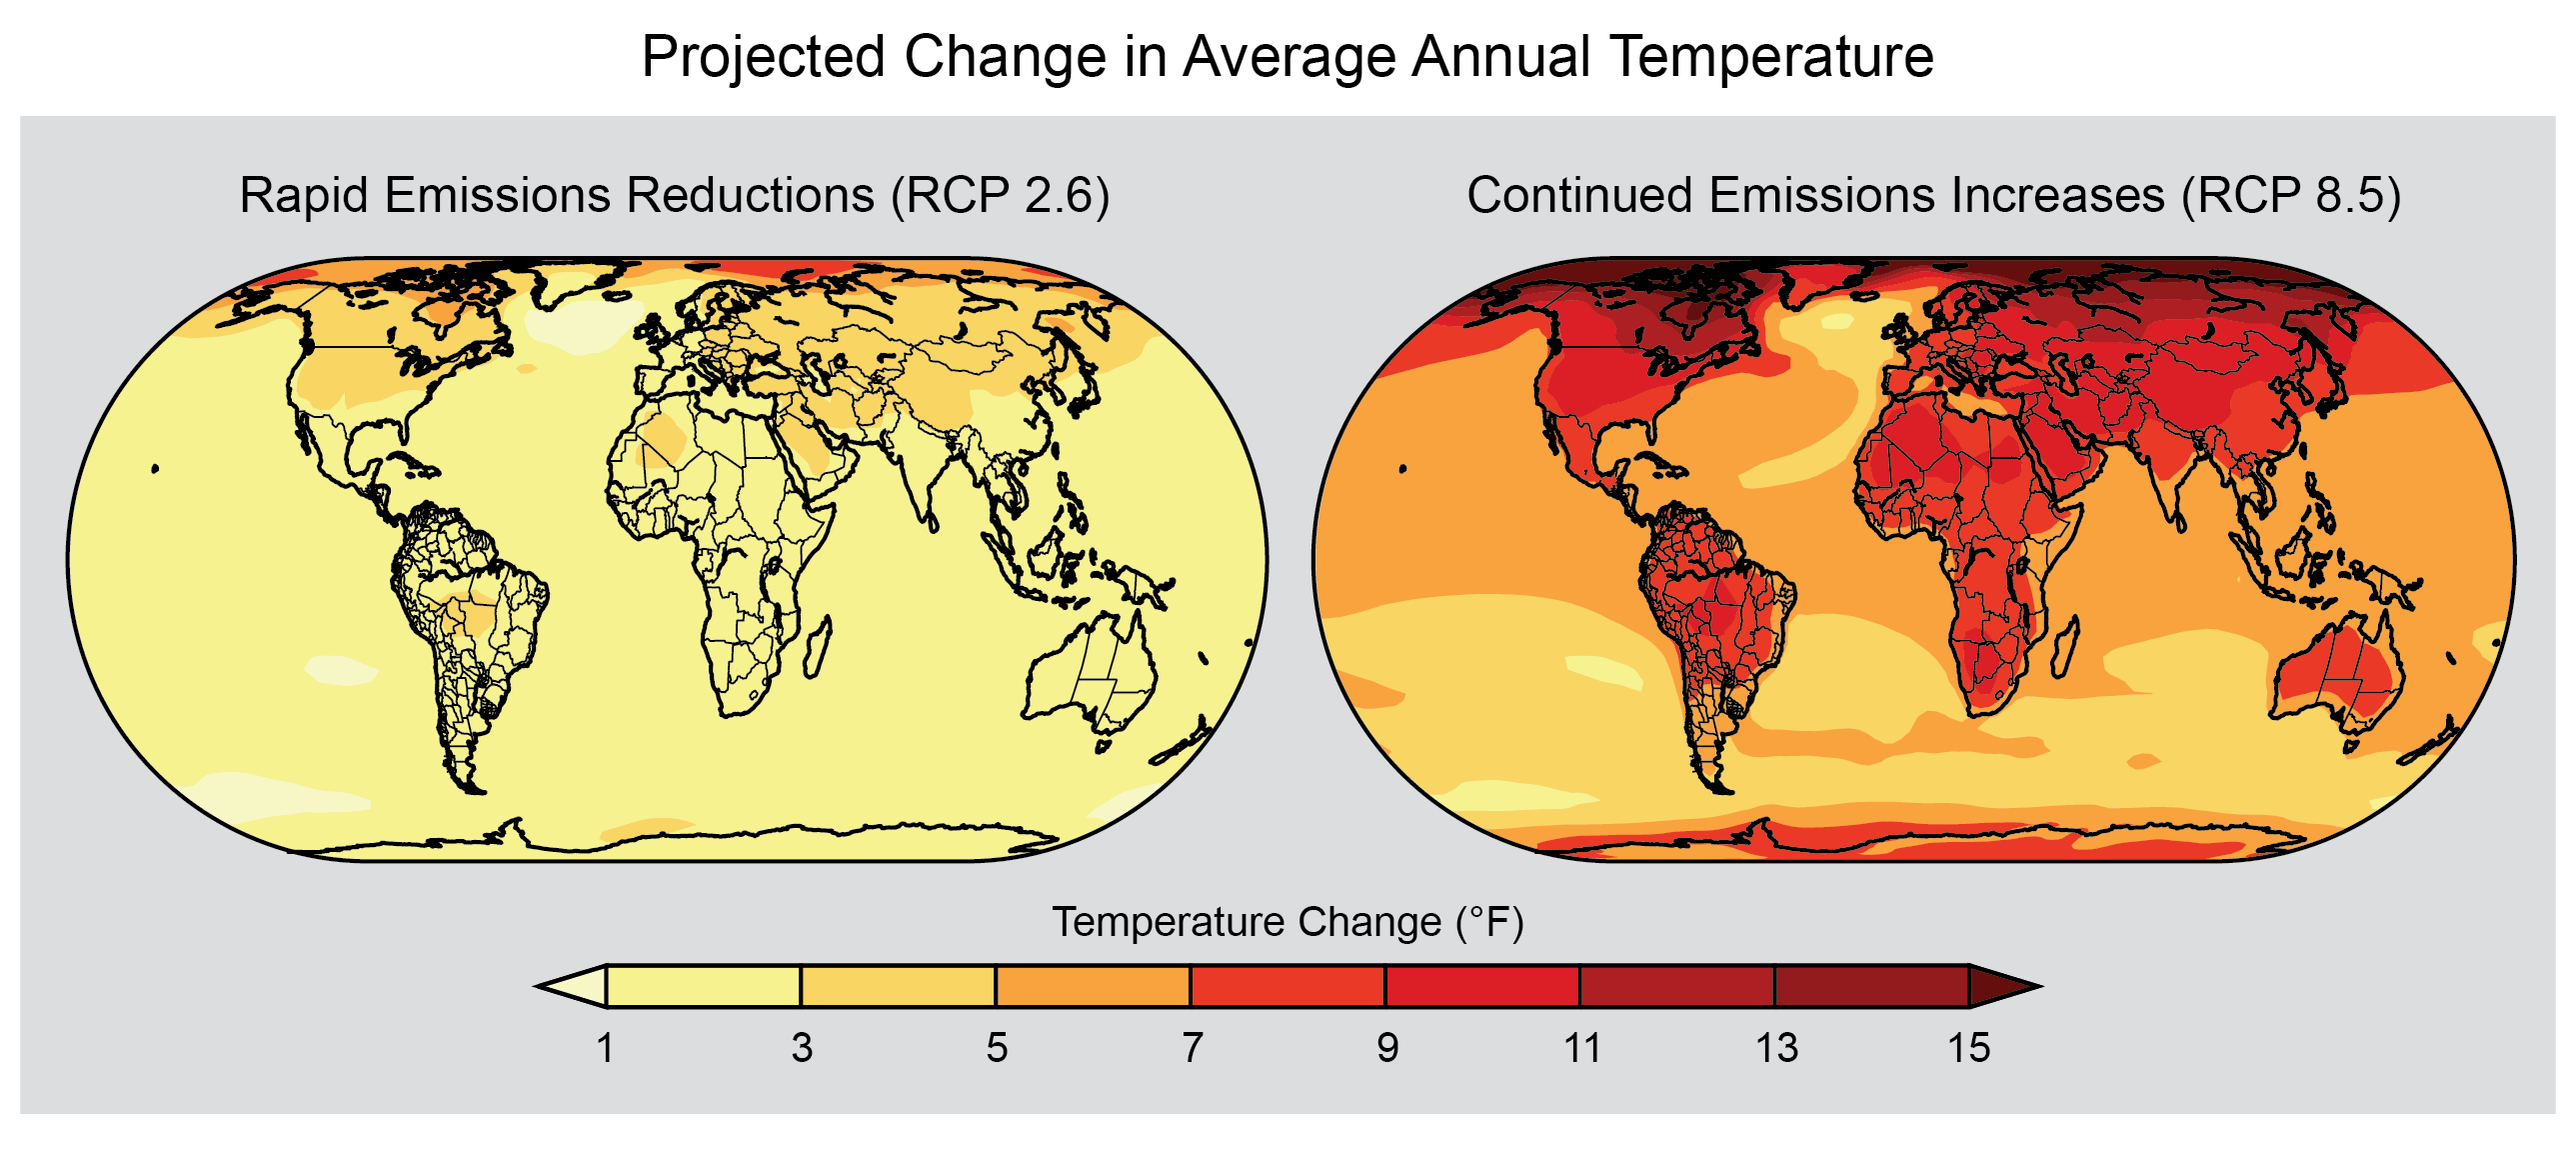
Projected Change in Average Annual Temperature
Projected change in average annual temperature over the period 2071-2099 (compared to the period 1970-1999) under a low scenario that assumes rapid reductions in emissions and concentrations of heat-trapping gases (RCP 2.6), and a higher scenario that assumes continued increases in emissions (RCP 8.5). (Figure source: NOAA NCEI / CICS-NC).
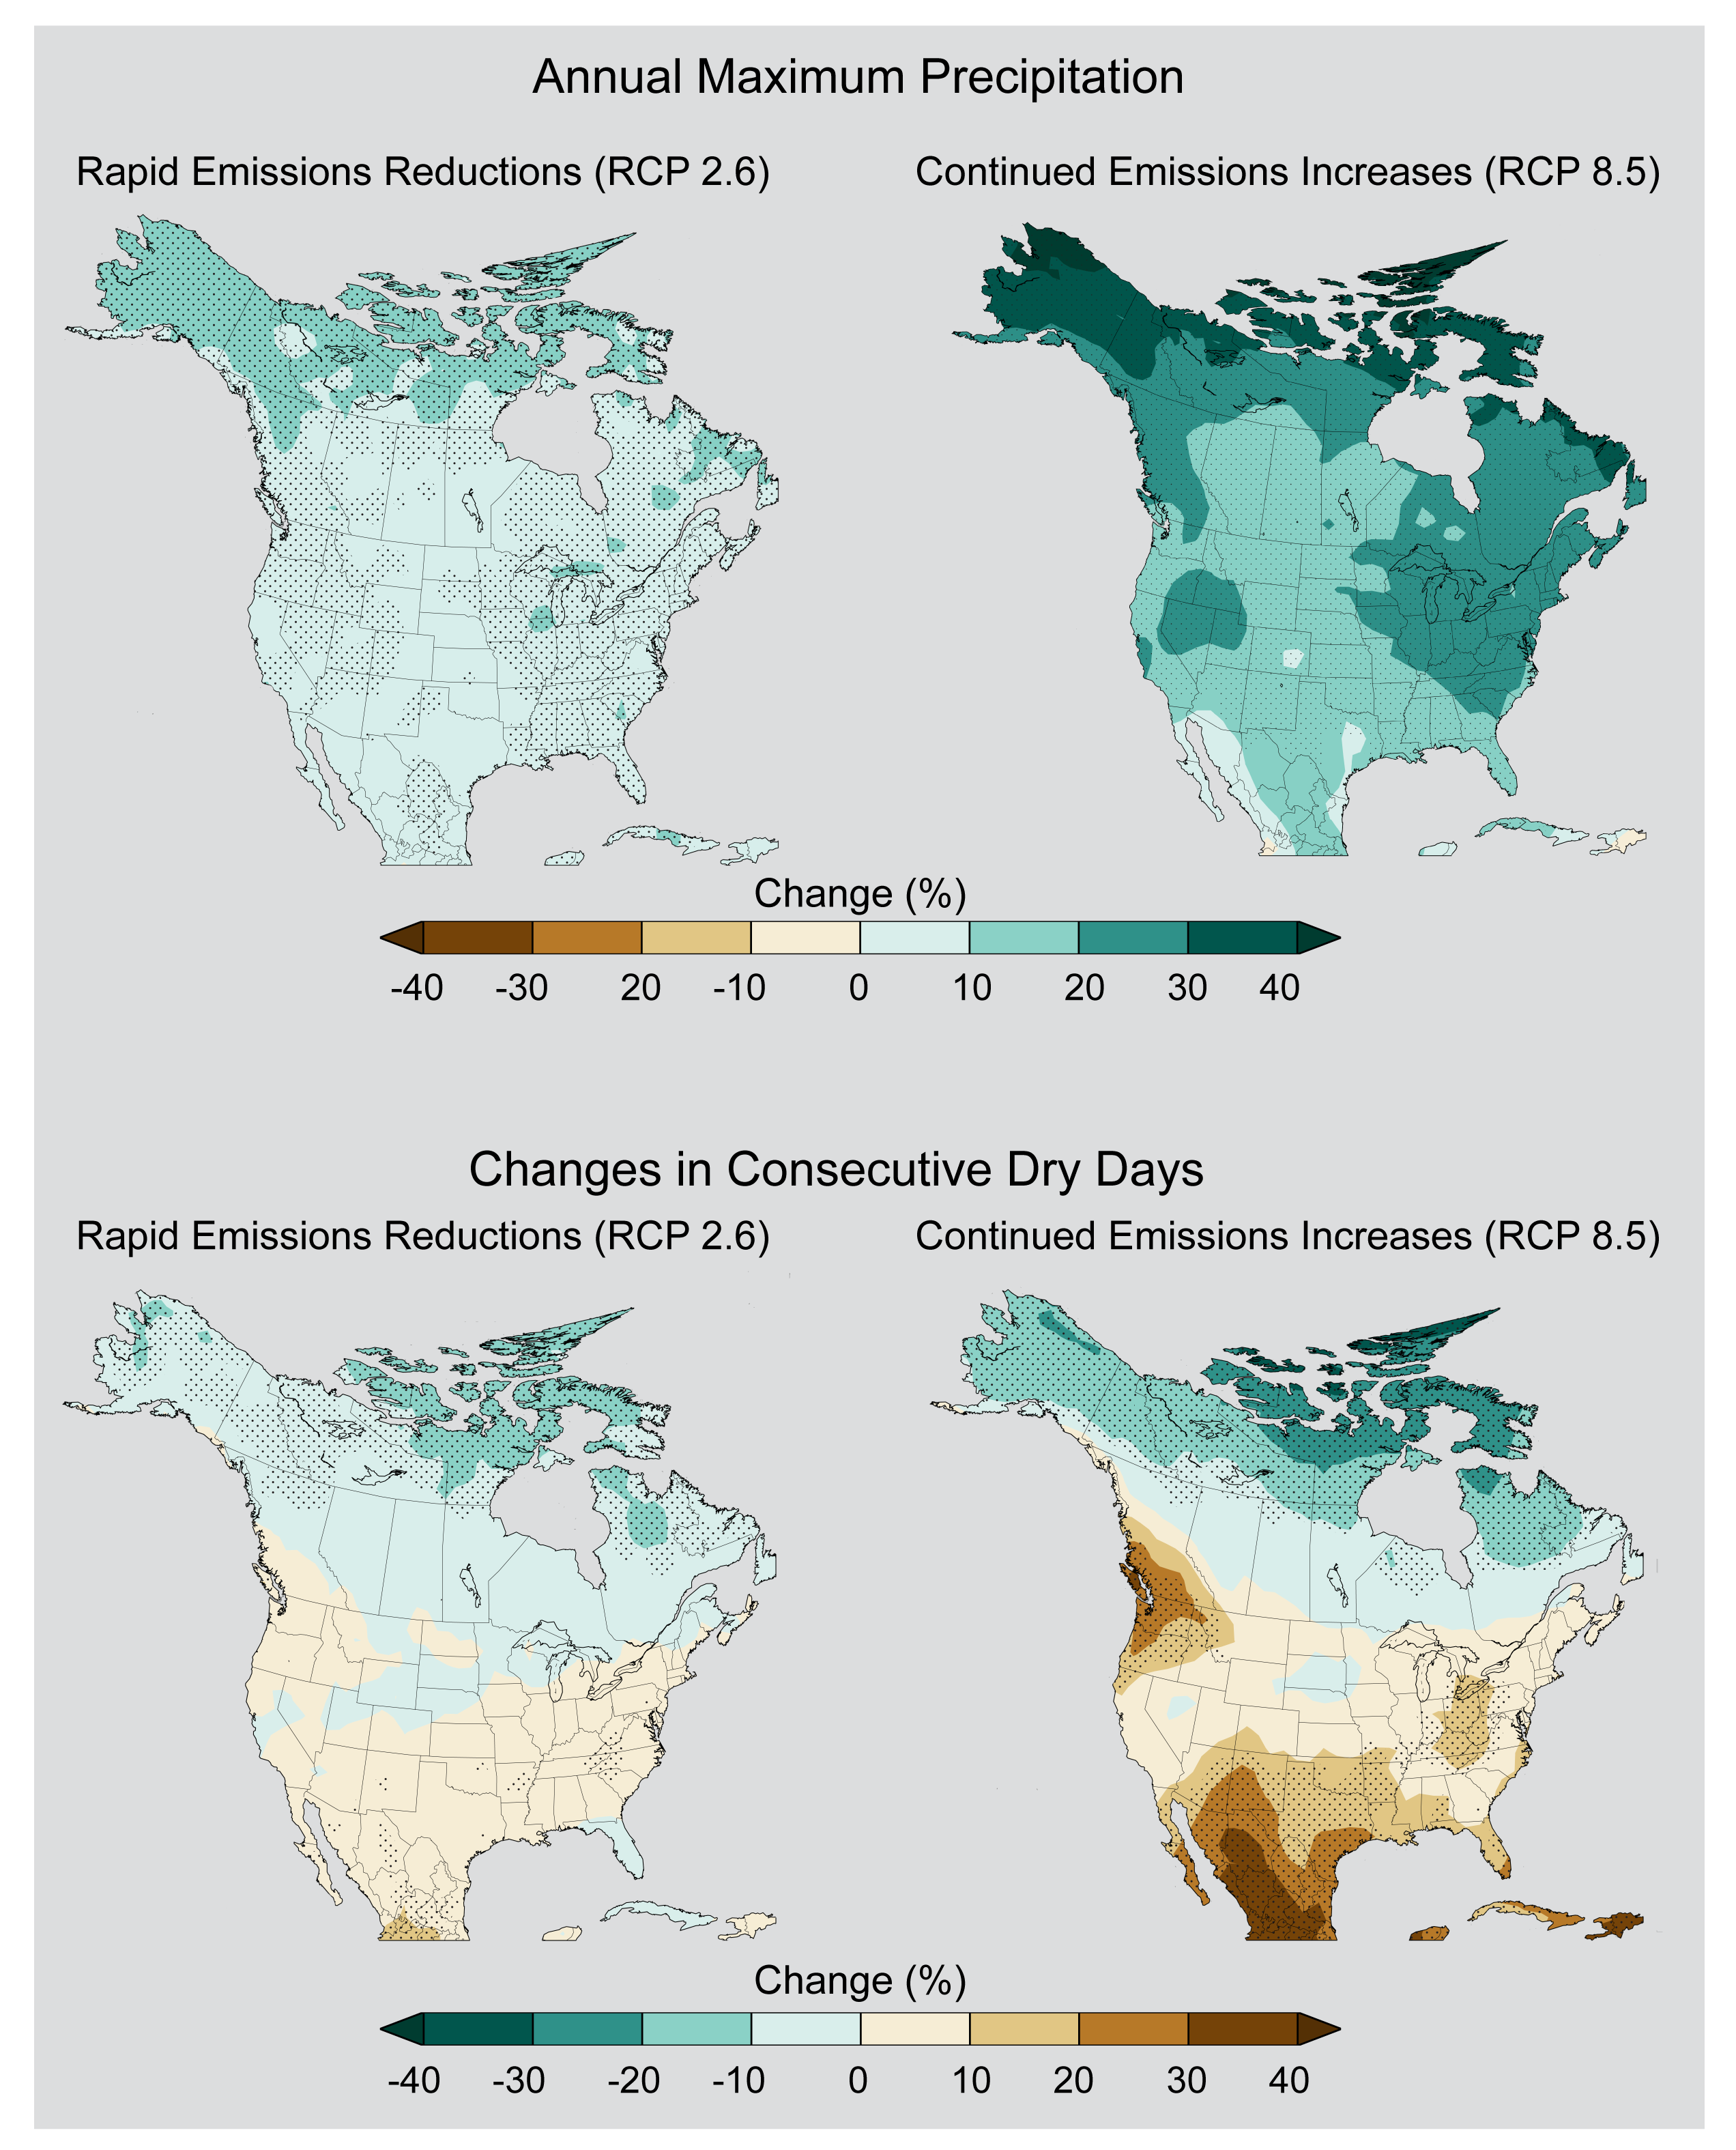
Annual Maximum Precipitation and Changes in Consecutive Dry Days
Left panel shows simulated changes in the average amount of precipitation falling on the wettest day of the year for the period 2070-2099 as compared to 1971-2000 under a scenario that assumes rapid reductions in emissions (RCP 2.6) and one that assumes continued emissions increases (RCP 8.5). Right panel shows simulated changes in the annual maximum number of consecutive dry days (days receiving less than 0.04 inches (1 mm) of precipitation) under the same two scenarios. Simulations are from CMIP5 models. Stippling indicates areas where changes are consistent among at least 80% of the models used in this analysis. (Figure source: NOAA NCEI / CICS-NC).
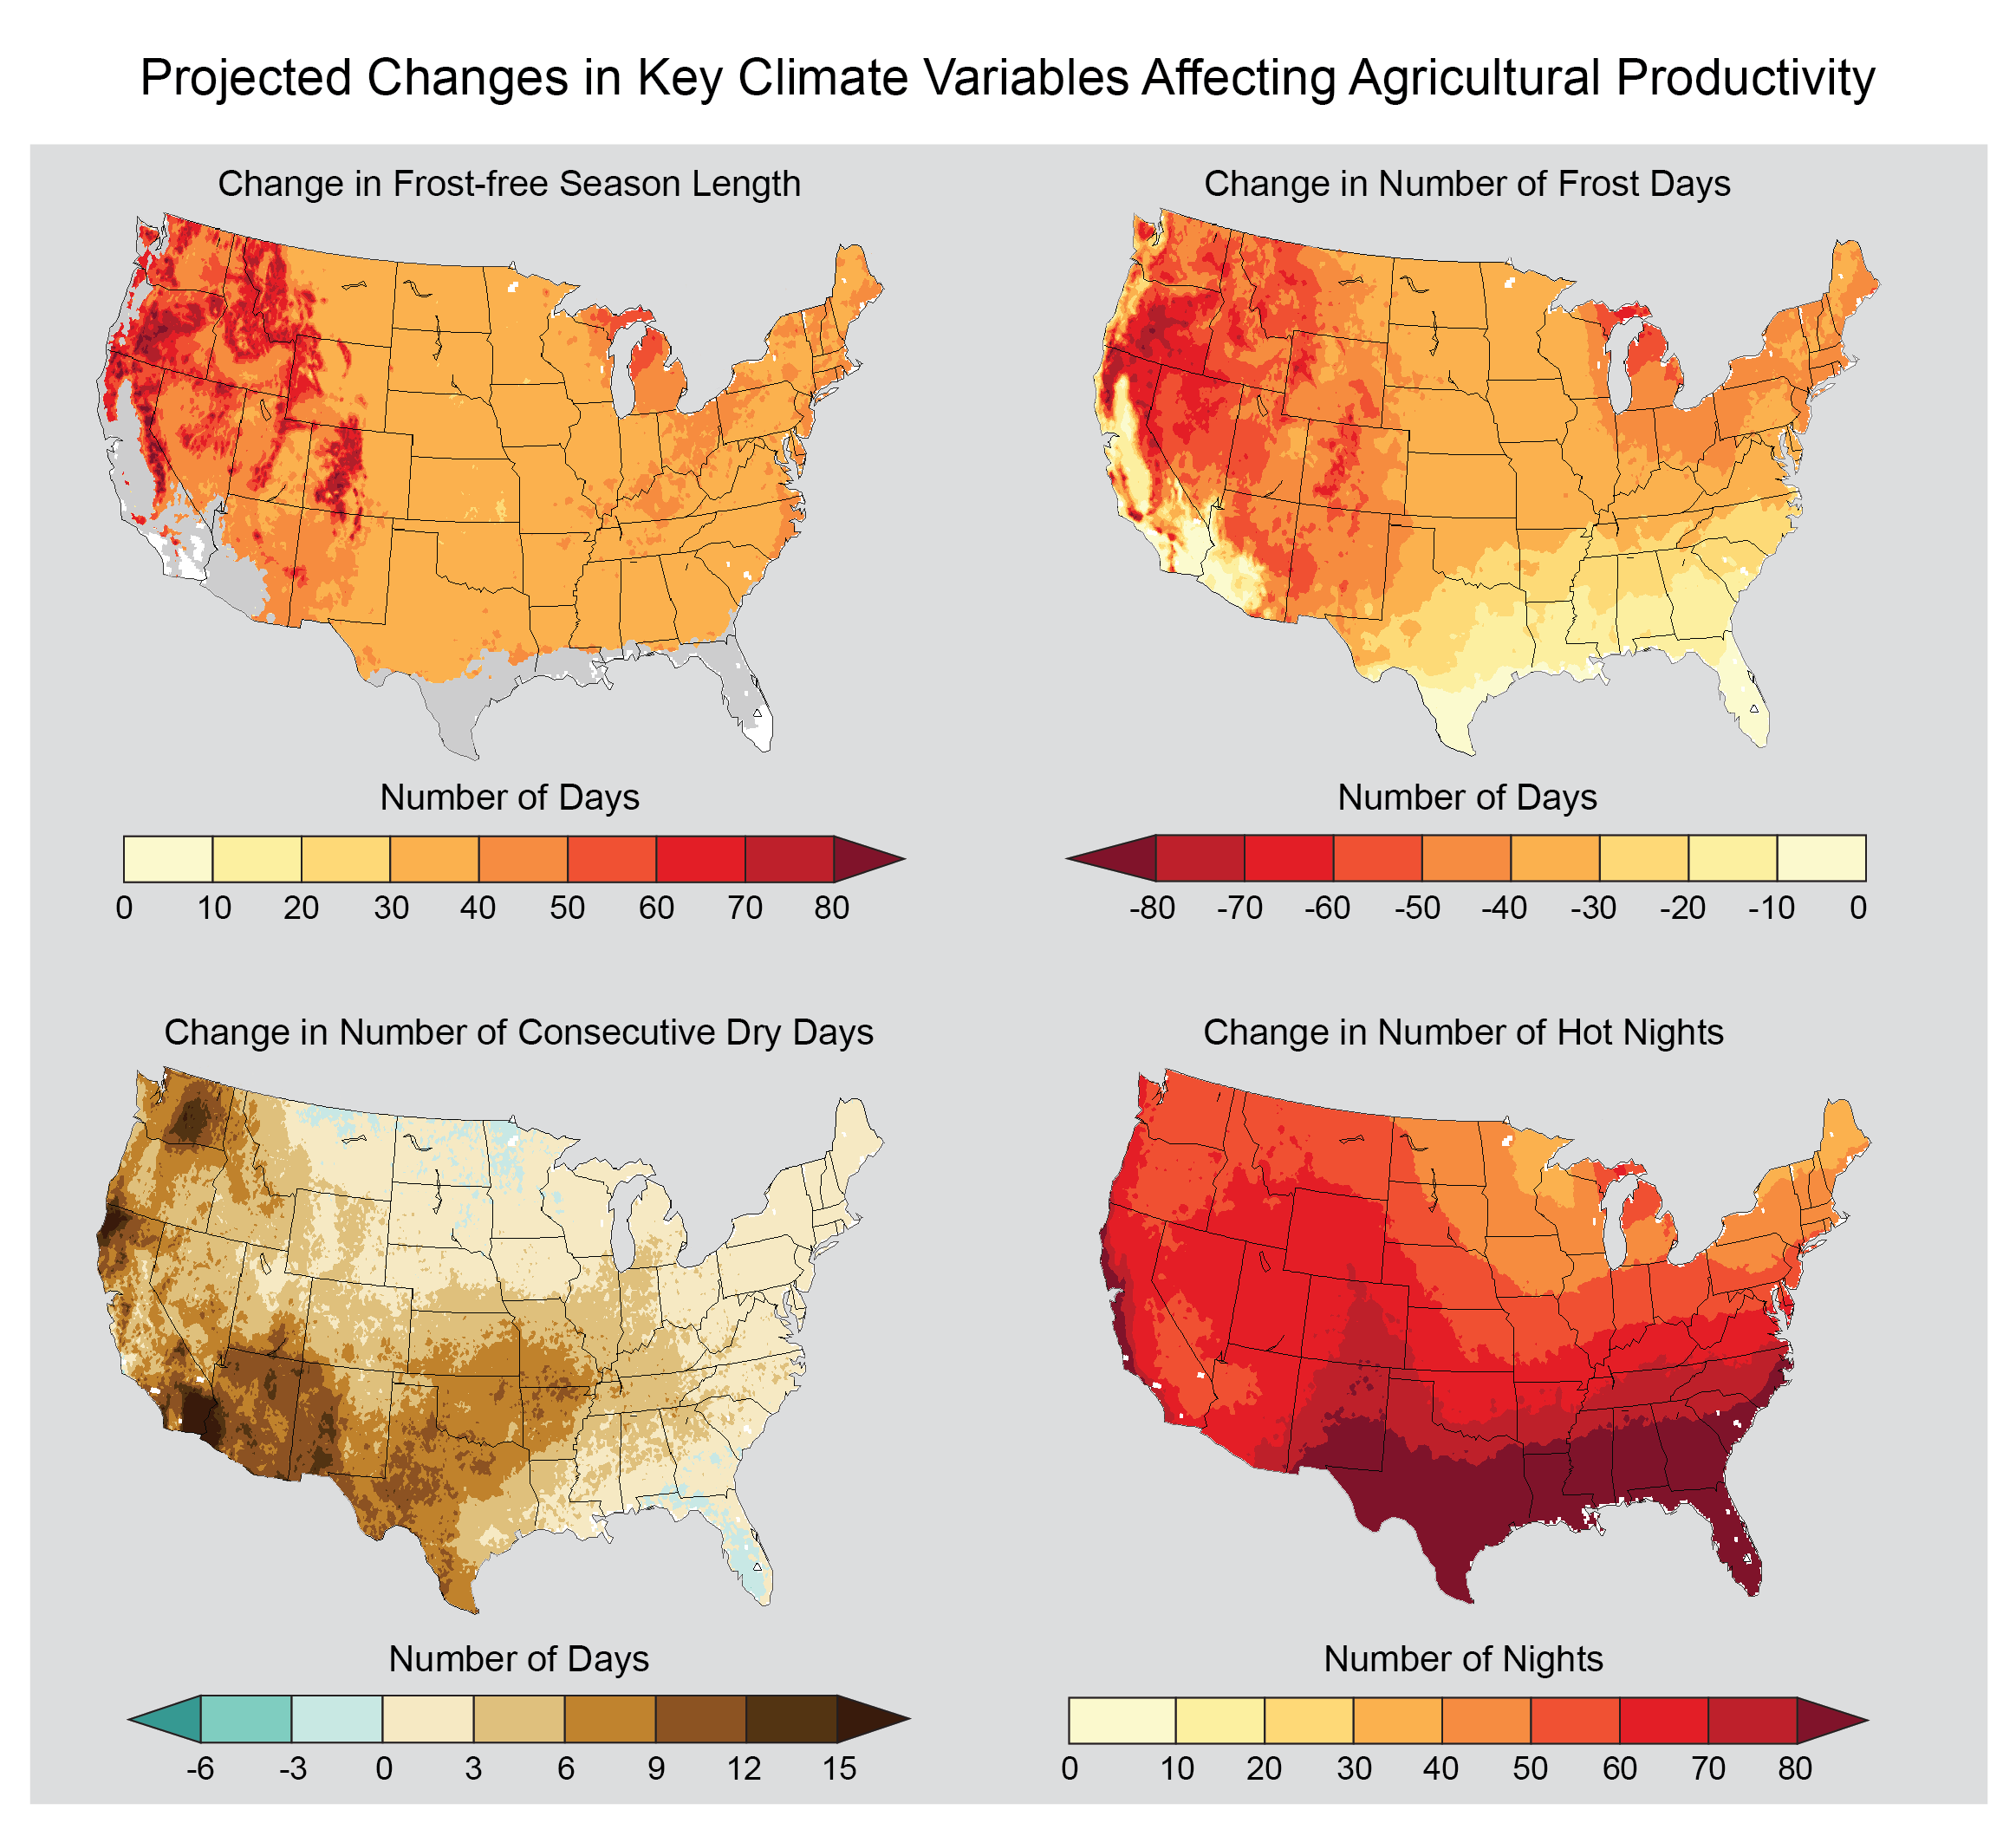
Projected Changes in Key Climate Variables Affecting Agricultural Productivity
Many climate variables affect agriculture. The maps above show projected changes in key climate variables affecting agricultural productivity for the end of the century (2070-2099) compared to 1971-2000. Changes in climate parameters critical to agriculture show lengthening of the frost-free or growing season and reductions in the number of frost days (days with minimum temperatures below freezing), under an emissions scenario that assumes continued increases in heat-trapping gases (A2). Changes in these two variables are not identical, with the length of the growing season increasing across most of the United States and more variation in the change in the number of frost days. Warmer-season crops, such as melons, would grow better in warmer areas, while other crops, such as cereals, would grow more quickly, meaning less time for the grain itself to mature, reducing productivity. Taking advantage of the increasing length of the growing season and changing planting dates could allow planting of more diverse crop rotations, which can be an effective adaptation strategy. On the frost-free map, white areas are projected to experience no freezes for 2070-2099, and gray areas are projected to experience more than 10 frost-free years during the same period. In the lower left graph, consecutive dry days are defined as the annual maximum number of consecutive days with less than 0.01 inches of precipitation. In the lower right graph, hot nights are defined as nights with a minimum temperature higher than 98% of the minimum temperatures between 1971 and 2000. (Figure source: NOAA NCEI / CICS-NC).

Increasing Numbers of Cooling Degree Days
These maps show projected average changes in cooling degree days for two future time periods: 2021-2050 and 2070-2099 (as compared to the period 1971-2000). The higher emissions scenario (A2) assumes climate change associated with continued increases in emissions of heat-trapping gases, while the lower emissions scenario (B1) assumes significant reductions. The projections show significant regional variations, with the greatest increases in the southern United States by the end of this century under the higher emissions scenario. Furthermore, population projections suggest continued shifts toward areas that require air conditioning in the summer, thereby increasing the impact of temperature changes on increased energy demand. (Figure source: NOAA NCEI / CICS-NC).

Observed U.S. Temperature Change
The colors on the map show temperature changes over the past 22 years (1991-2012) compared to the 1901-1960 average, and compared to the 1951-1980 average for Alaska and Hawai‘i. The bars on the graphs show the average temperature changes by decade for 1901-2012 (relative to the 1901-1960 average) for each region. The far right bar in each graph (2000s decade) includes 2011 and 2012. The period from 2001 to 2012 was warmer than any previous decade in every region. (Figure source: NOAA NCEI / CICS-NC).
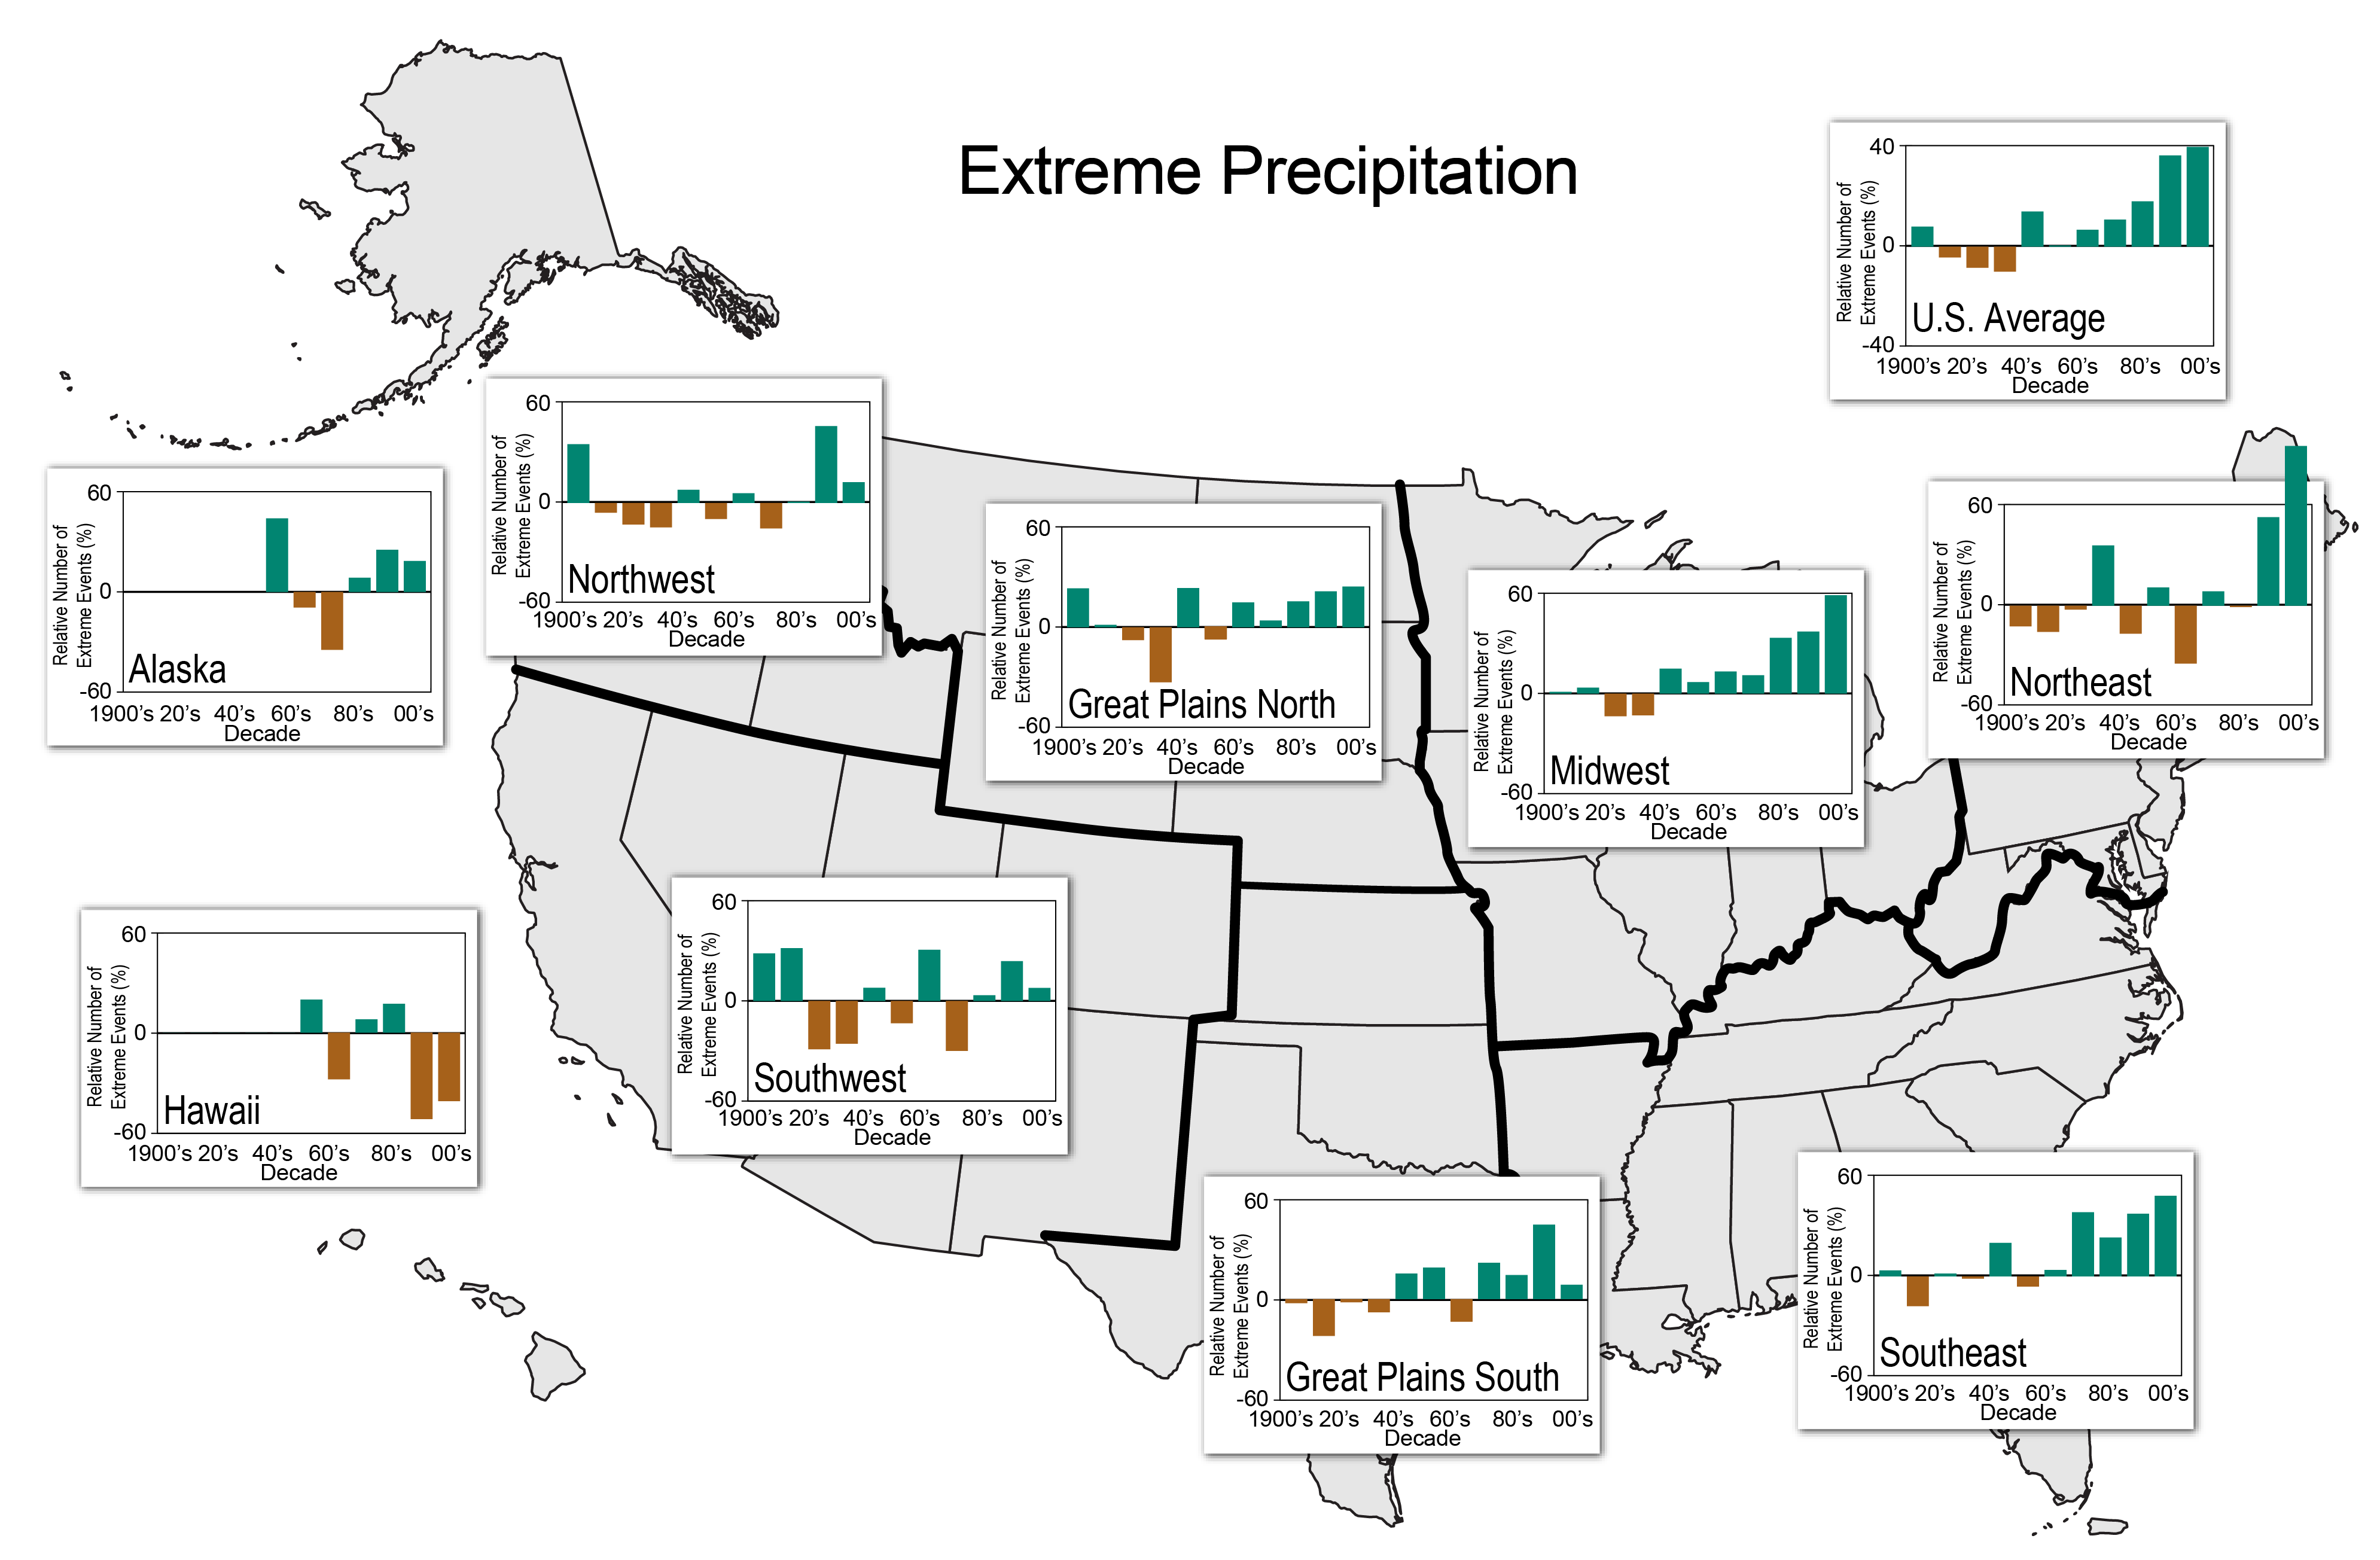
Observed Change in Very Heavy Precipitation
Percent changes in the annual amount of precipitation falling in very heavy events, defined as the heaviest 1% of all daily events from 1901 to 2012 for each region. The far right bar is for 2001-2012. In recent decades there have been increases nationally, with the largest increases in the Northeast, Great Plains, Midwest, and Southeast. Changes are compared to the 1901-1960 average for all regions except Alaska and Hawai‘i, which are relative to the 1951-1980 average. (Figure source: NOAA NCEI / CICS-NC).
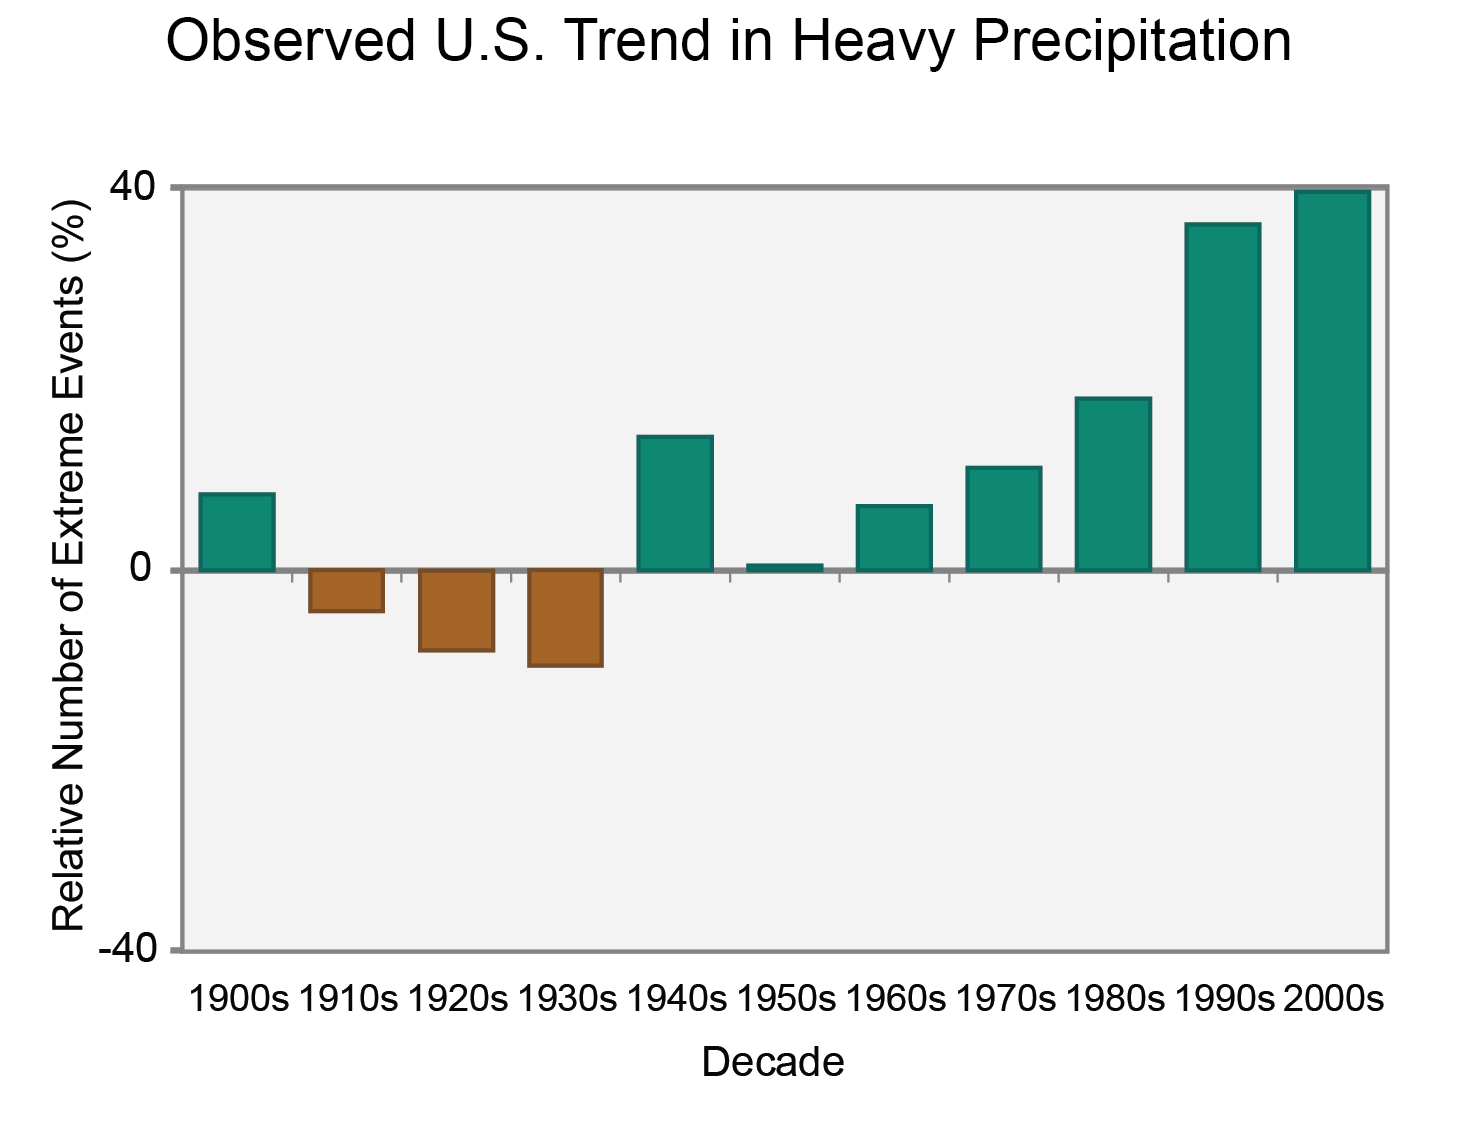
Observed U.S. Trend in Heavy Precipitation
One measure of a heavy precipitation event is a 2-day precipitation total that is exceeded on average only once in a five-year period, also known as a once-in-five-year event. As this extreme precipitation index for 1901-2012 shows, the occurrence of such events has become much more common in recent decades. Changes are compared to the period 1901-1960, and do not include Alaska or Hawai‘i. The 2000s decade (far right bar) includes 2001-2012. (Figure source: adapted from Kunkel et al. 2013)

Observed U.S. Precipitation Change
The colors on the map show annual total precipitation changes for 1991-2012 compared to the 1901-1960 average, and show wetter conditions in most areas. The bars on the graphs show average precipitation differences by decade for 1901-2012 (relative to the 1901-1960 average) for each region. The far right bar in each graph is for 2001-2012. (Figure source: adapted from Peterson et al. 2013)
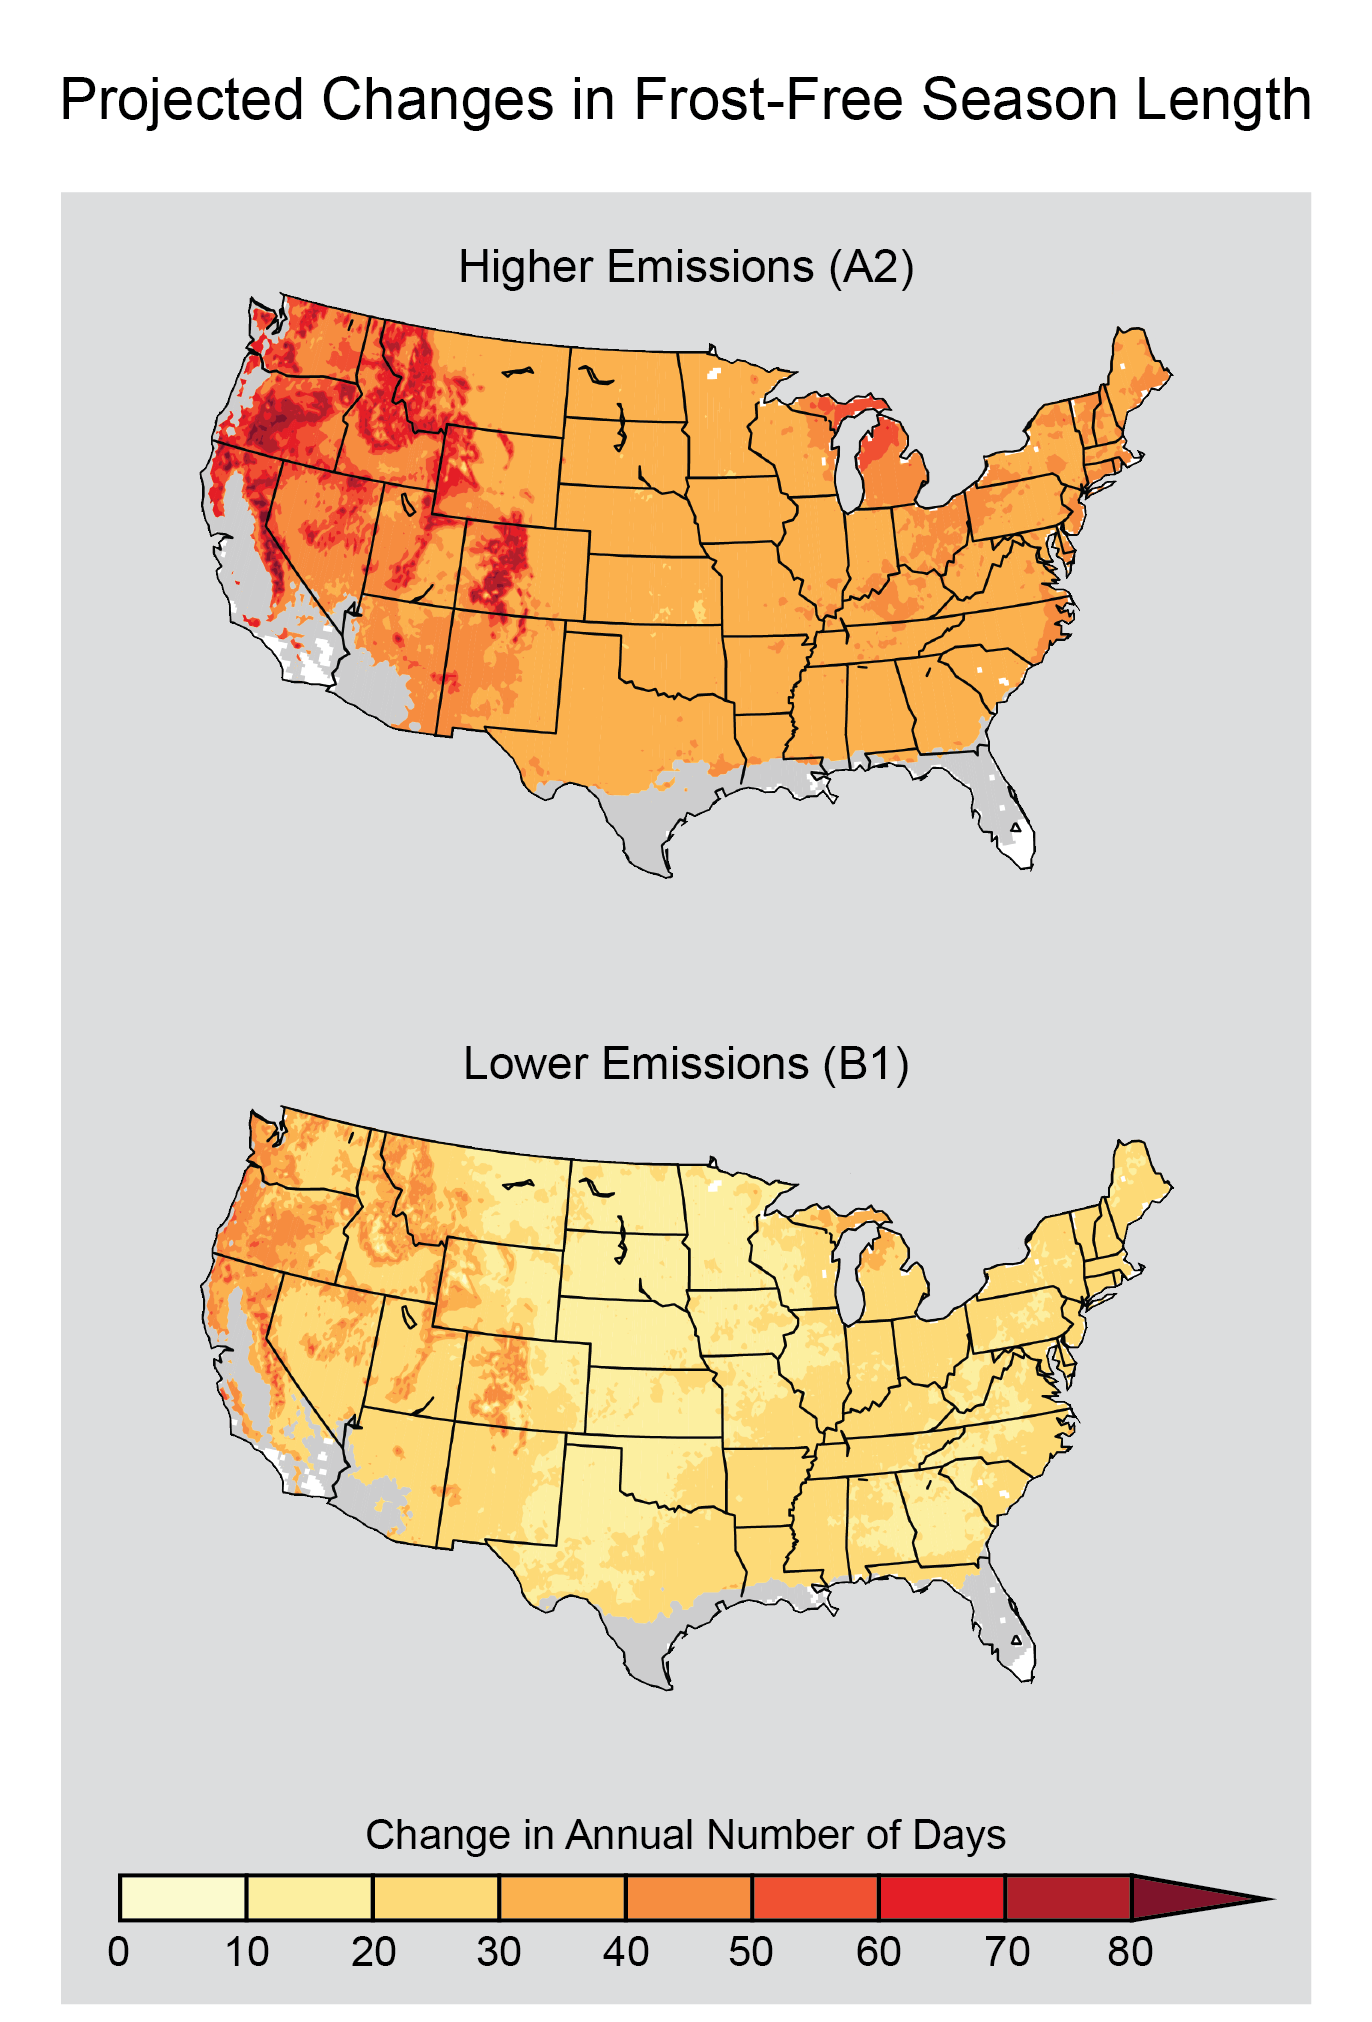
Projected Changes in Frost-Free Season Length
The maps show projected increases in frost-free season length for the last three decades of this century (2070-2099 as compared to 1971-2000) under two emissions scenarios, one in which heat-trapping gas emissions continue to grow (A2) and one in which emissions peak in 2050 (B1). Increases in the frost-free season correspond to similar increases in the growing season. White areas are projected to experience no freezes for 2070-2099, and gray areas are projected to experience more than 10 frost-free years during the same period. (Figure source: NOAA NCEI / CICS-NC).
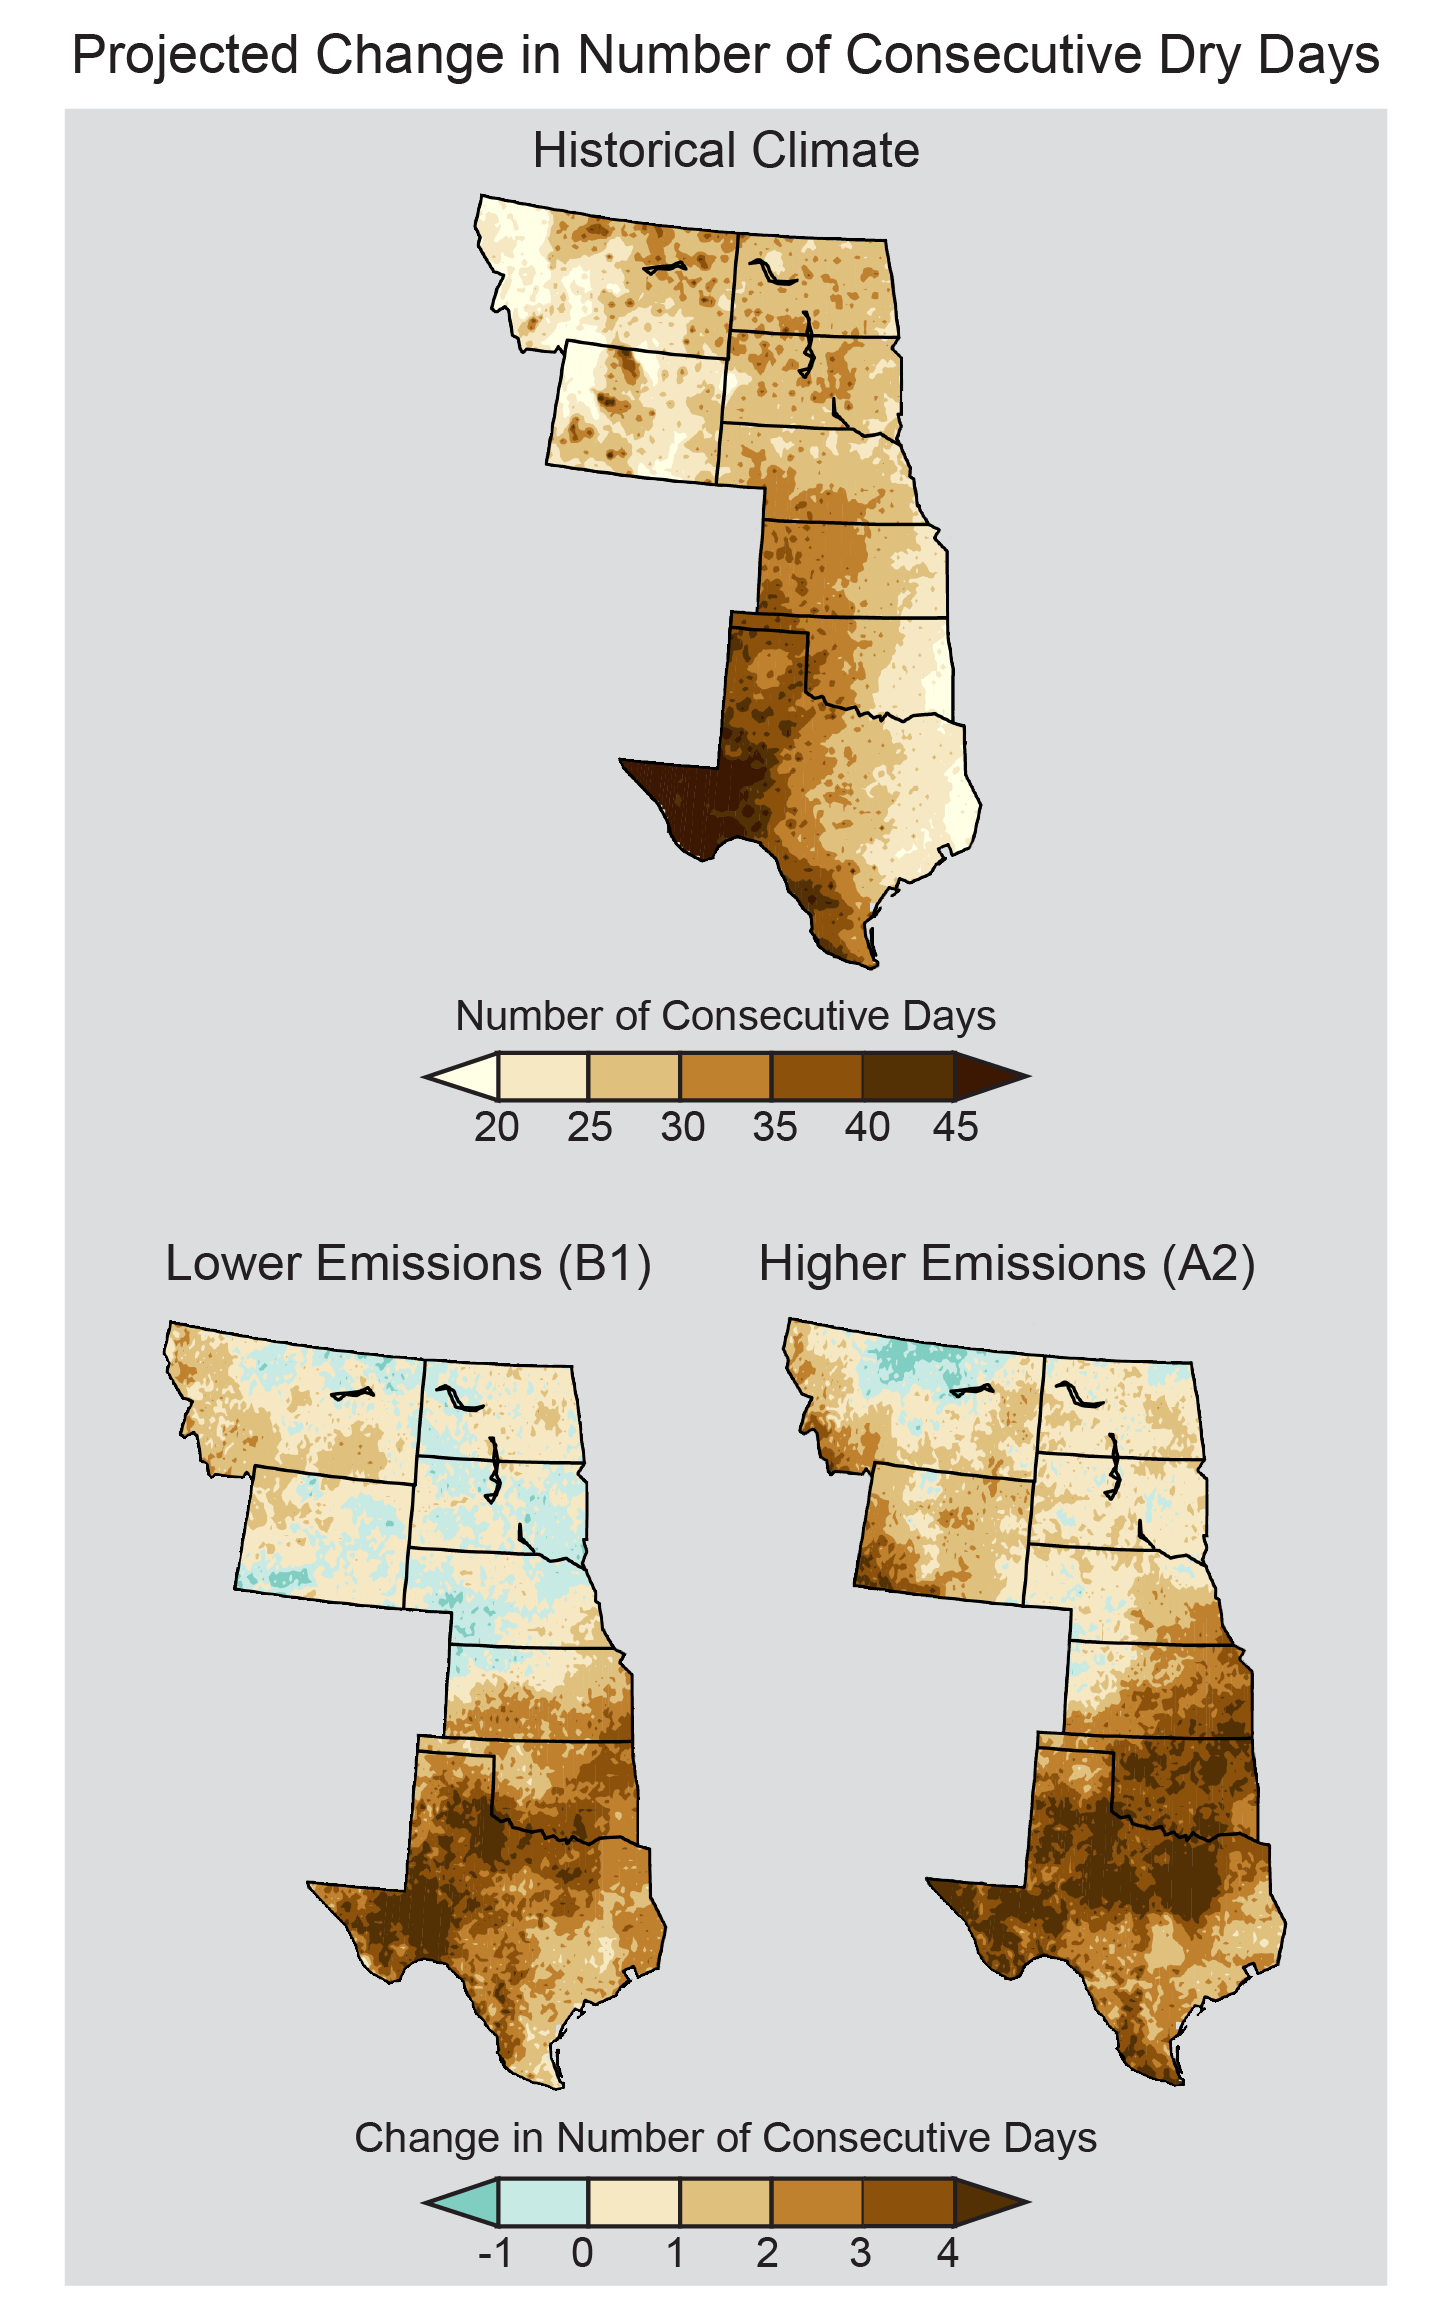
Projected Change in Number of Consecutive Dry Days
Current regional trends of a drier south and a wetter north are projected to become more pronounced by mid-century (2041-2070 as compared to 1971-2000 averages). Maps show the maximum annual number of consecutive days in which limited (less than 0.01 inches) precipitation was recorded on average from 1971 to 2000 (top), projected changes in the number of consecutive dry days assuming substantial reductions in emissions (B1), and projected changes if emissions continue to rise (A2). The southeastern Great Plains, which is the wettest portion of the region, is projected to experience large increases in the number of consecutive dry days. (Figure source: NOAA NCEI / CICS-NC).
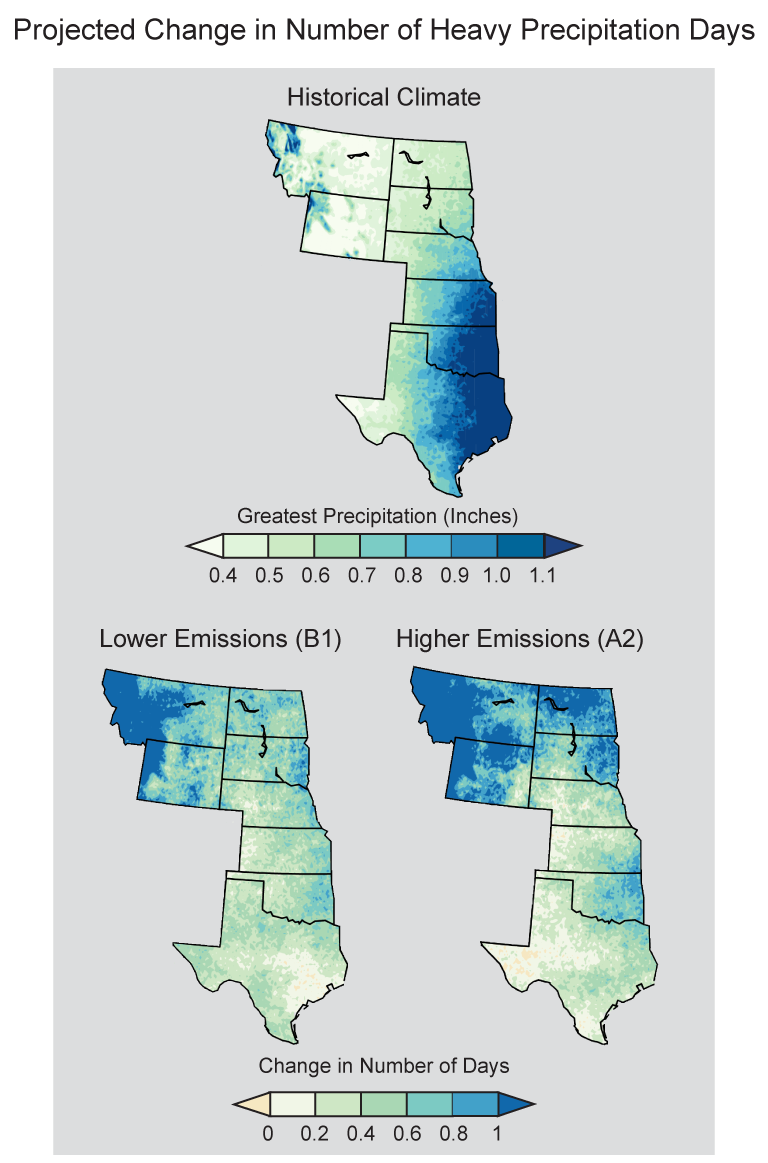
Projected Change in Number of Heavy Precipitation Days
The number of days with the heaviest precipitation is not projected to change dramatically. The historical (1971-2000) distribution of the greatest 2% of daily precipitation (Top: about seven days each year) echoes the regional east-west gradient in average precipitation. By mid-century (2041-2070), the projected change in days exceeding those precipitation amounts remains greatest in the northern area for both the lower emissions scenario (B1) and for the higher emissions scenario (A2). (Figure source: NOAA NCEI / CICS-NC).
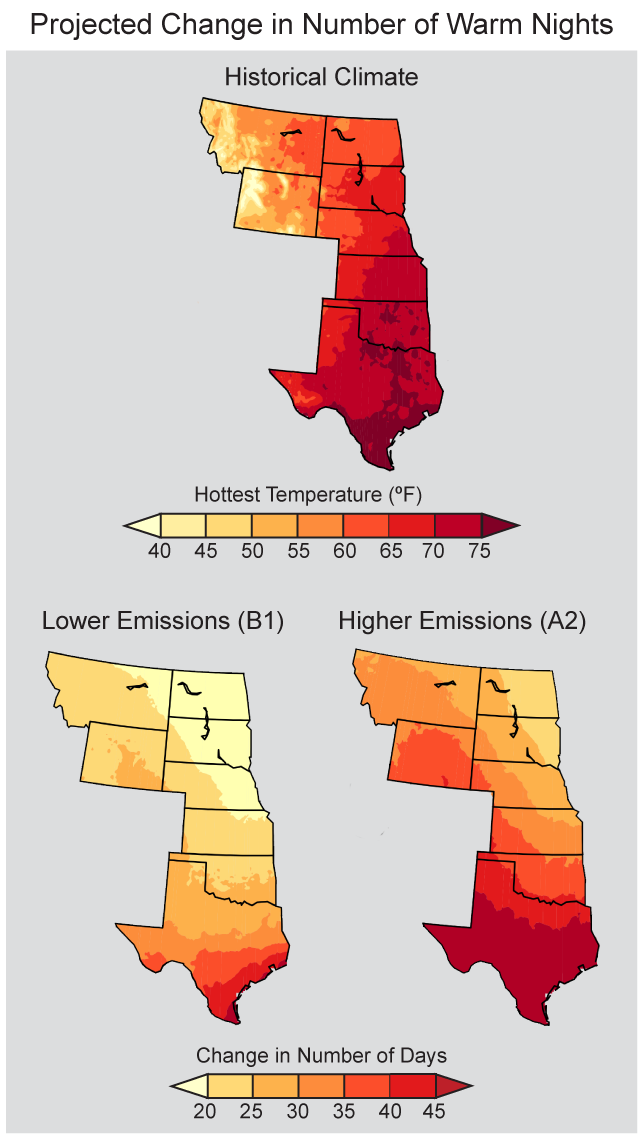
Projected Change in Number of Warm Nights
The number of nights with the warmest temperatures is projected to increase dramatically. The historical (1971-2000) distribution of temperature for the warmest 2% of nights (Top: about seven days each year) echoes the distinct north-south gradient in average temperatures. By mid-century (2041-2070), the projected change in number of nights exceeding those warmest temperatures is greatest in the south for both the lower emissions scenario (B1) and for the higher emissions scenario (A2). (Figure source: NOAA NCEI / CICS-NC).
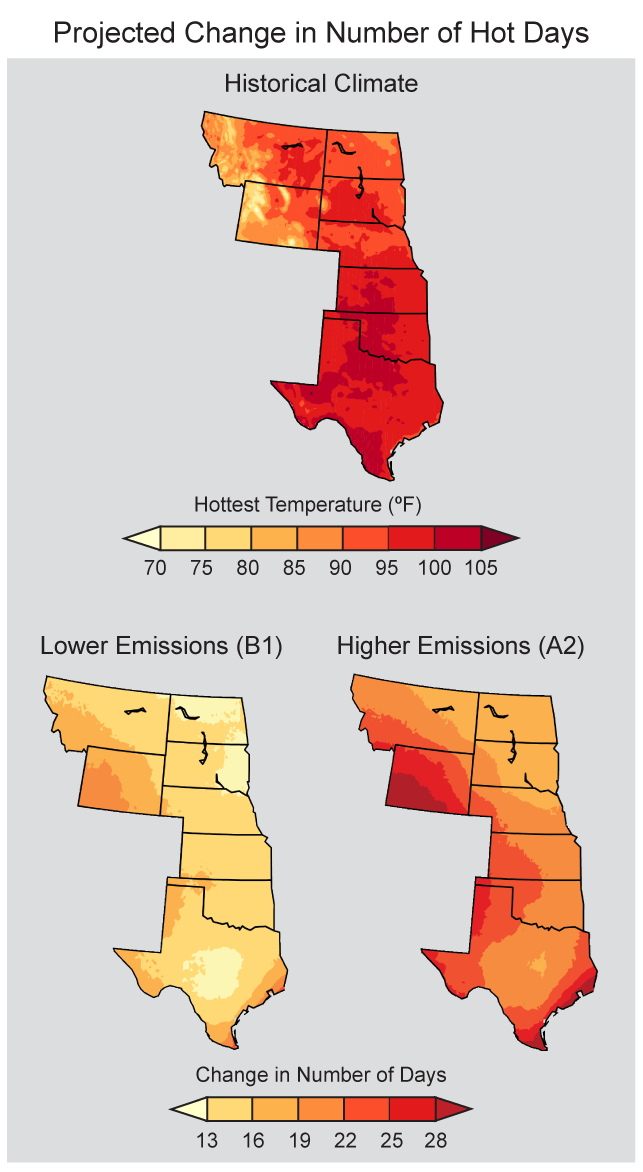
Projected Change in Number of Hot Days
The number of days with the hottest temperatures is projected to increase dramatically. The historical (1971-2000) distribution of temperature for the hottest 2% of days (about seven days each year) echoes the distinct north-south gradient in average temperatures. However, by mid-century (2041-2070), the projected change in number of days exceeding those hottest temperatures is greatest in the western areas and Gulf Coast for both the lower emissions scenario (B1) and for the higher emissions scenario (A2). (Figure source: NOAA NCEI / CICS-NC).
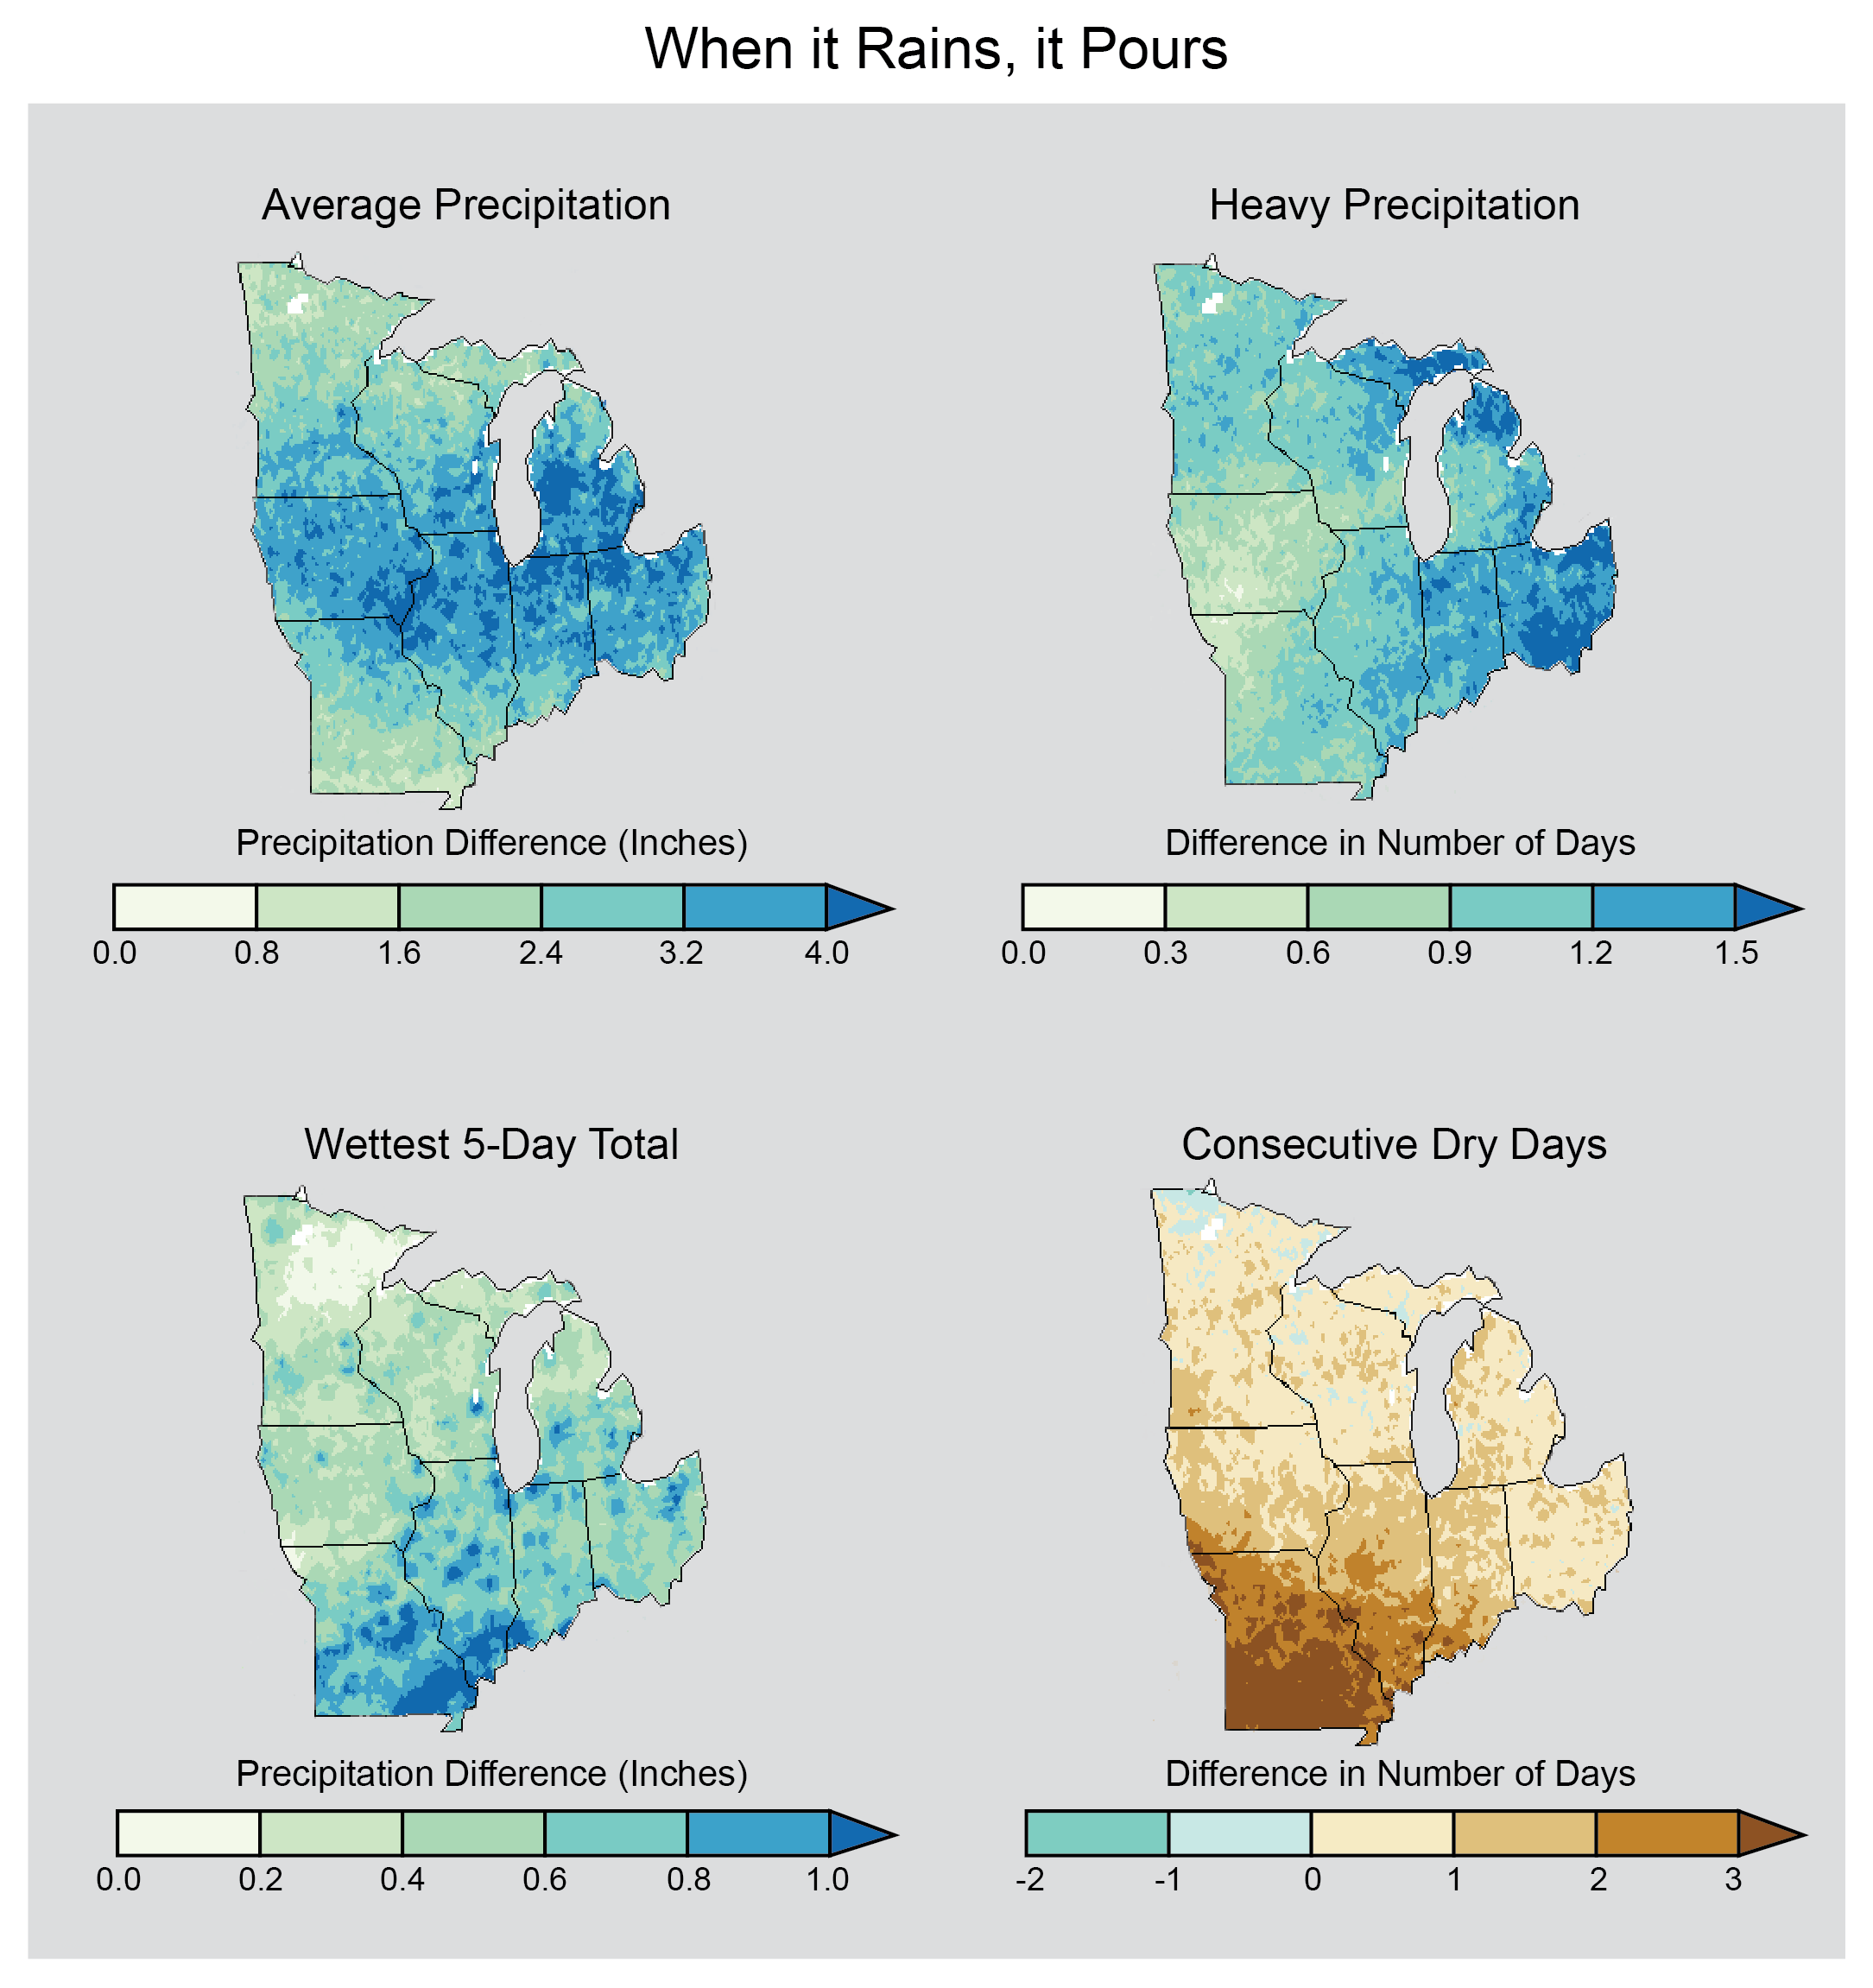
When it Rains, it Pours
Precipitation patterns affect many aspects of life, from agriculture to urban storm drains. These maps show projected changes for the middle of the current century (2041-2070) relative to the end of the last century (1971-2000) across the Midwest under continued emissions (A2 scenario). Top left: the changes in total annual average precipitation. Across the entire Midwest, the total amount of water from rainfall and snowfall is projected to increase. Top right: increase in the number of days with very heavy precipitation (top 2% of all rainfalls each year). Bottom left: increases in the amount of rain falling in the wettest 5-day period over a year. Both (top right and bottom left) indicate that heavy precipitation events will increase in intensity in the future across the Midwest. Bottom right: change in the average maximum number of consecutive days each year with less than 0.01 inches of precipitation. An increase in this variable has been used to indicate an increase in the chance of drought in the future. (Figure source: NOAA NCEI / CICS-NC).
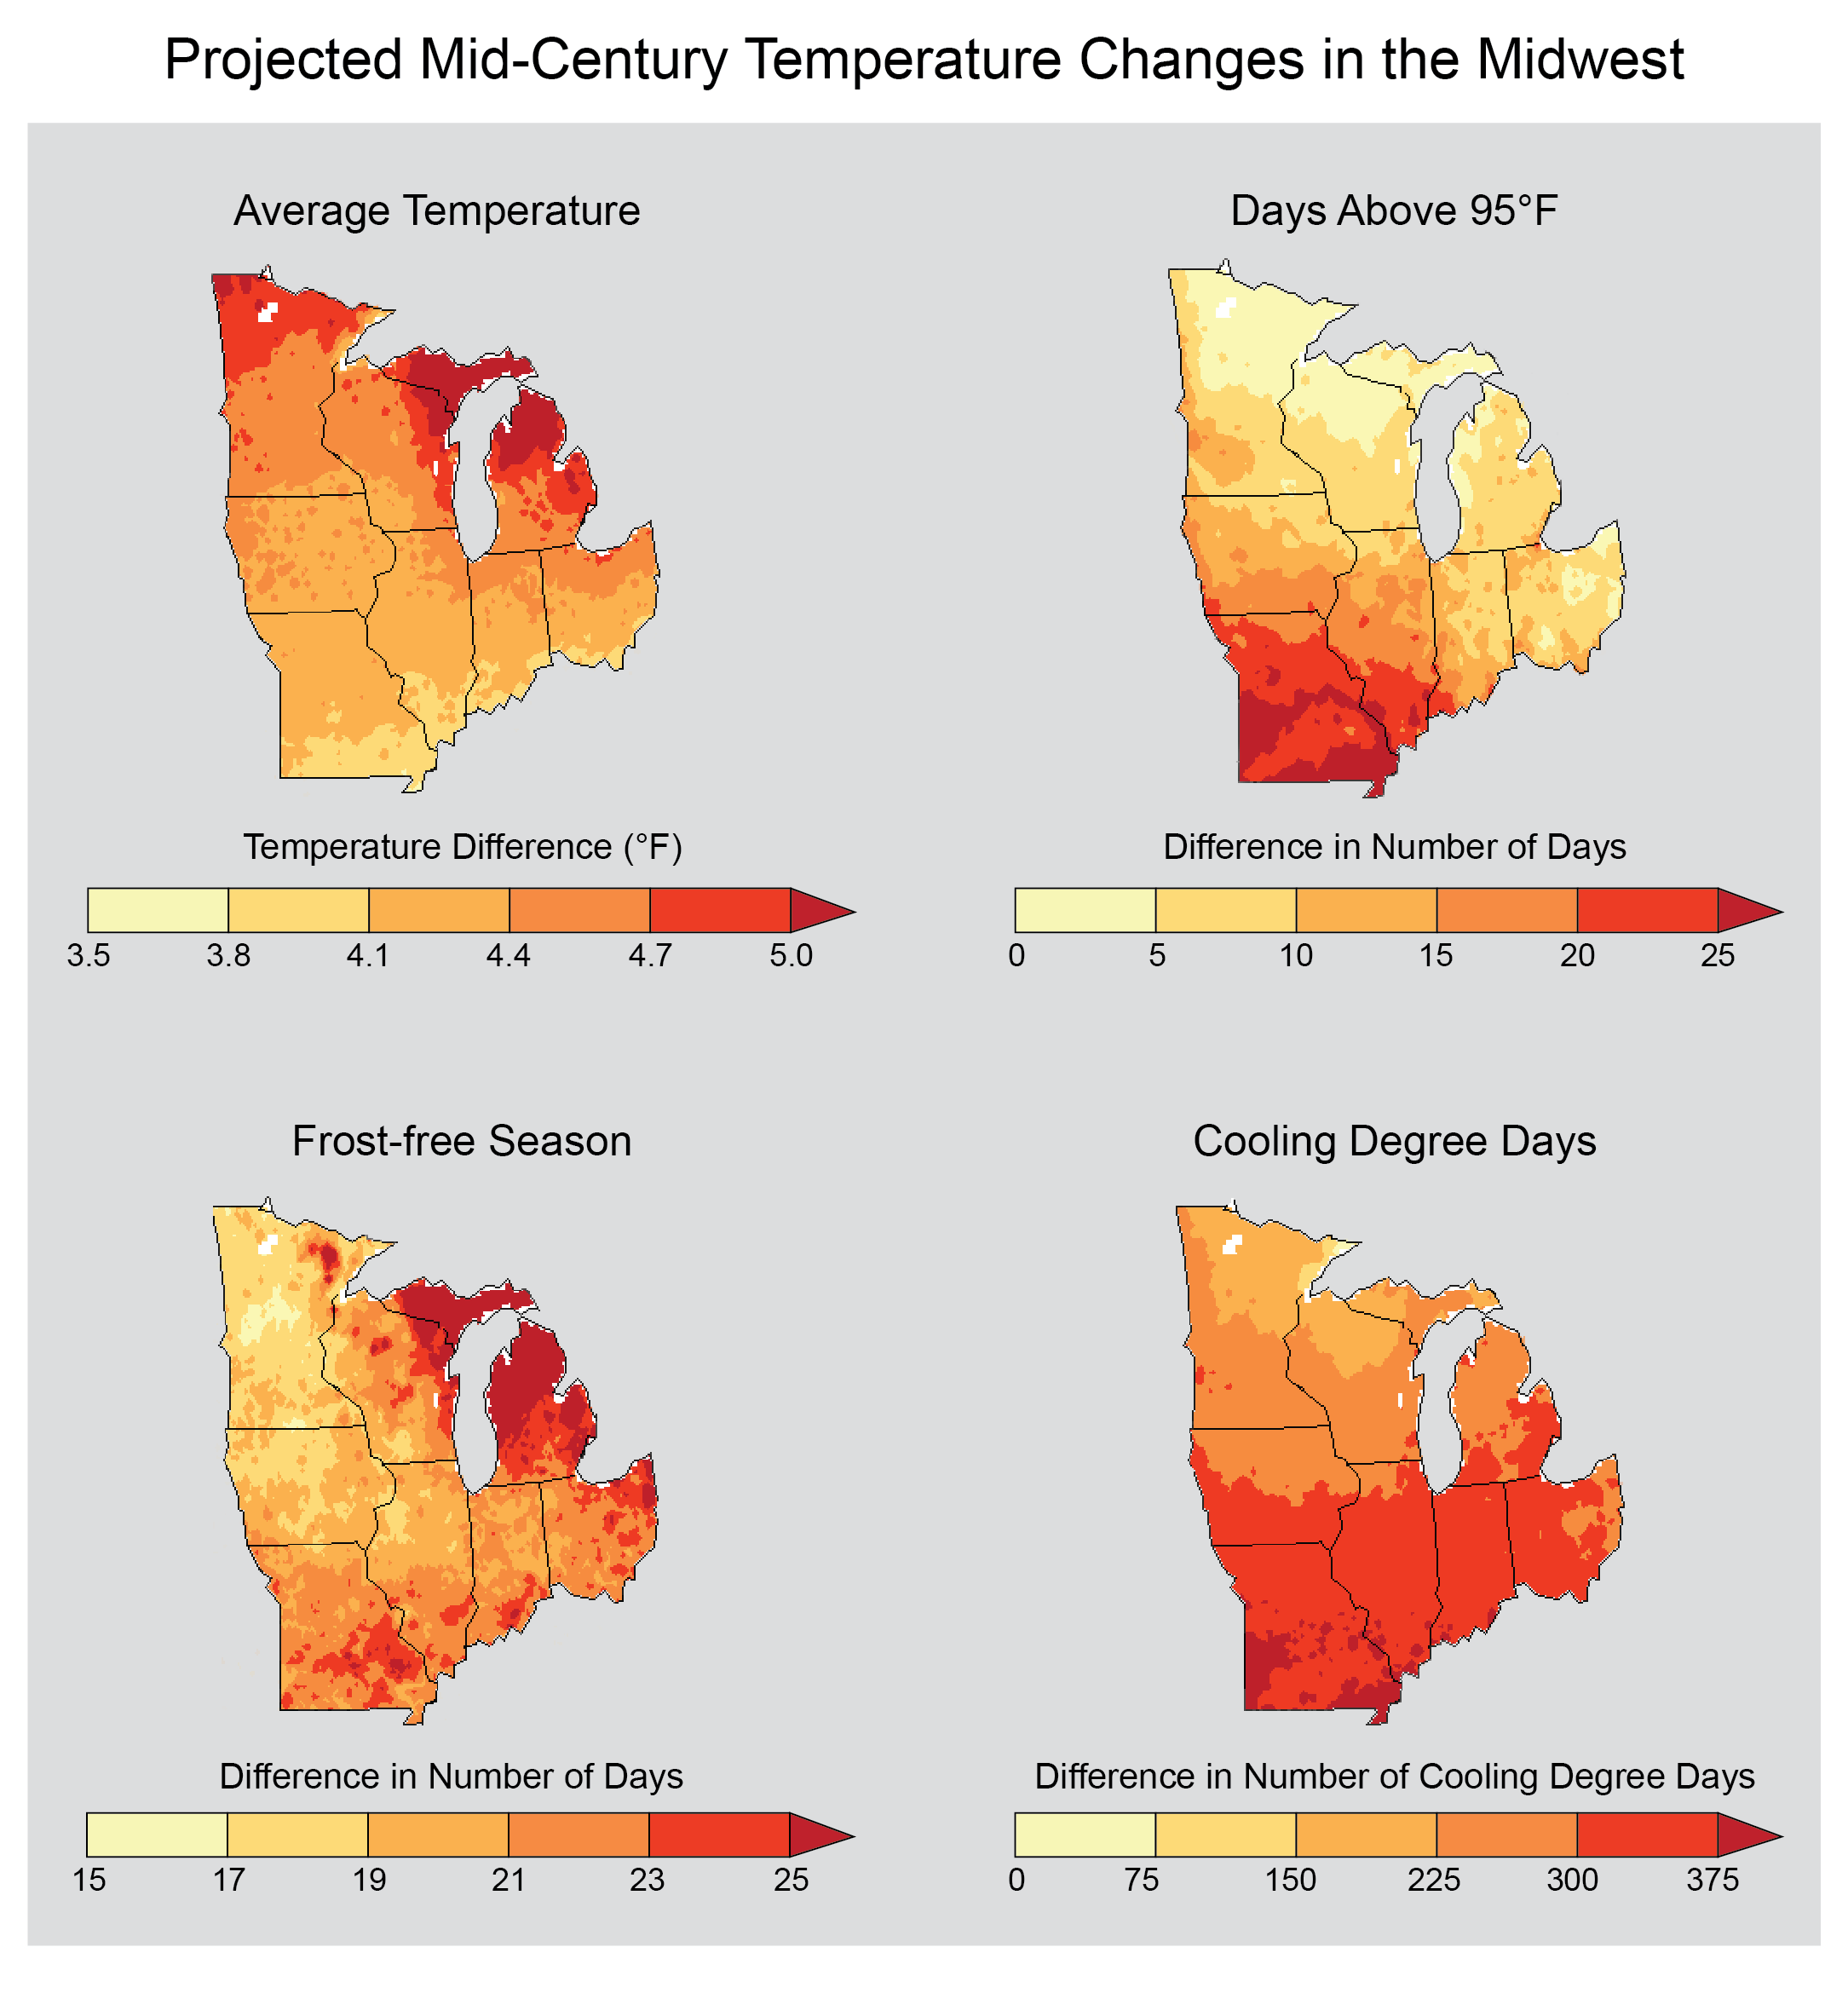
Projected Mid-Century Temperature Changes in the Midwest
Projected increase in annual average temperatures by mid-century (2041-2070) as compared to the 1971-2000 period tell only part of the climate change story. Maps also show annual projected increases in the number of the hottest days (days over 95°F), longer frost-free seasons, and an increase in cooling degree days, defined as the number of degrees that a day’s average temperature is above 65°F, which generally leads to an increase in energy use for air conditioning. Projections are from global climate models that assume emissions of heat-trapping gases continue to rise (A2 scenario). (Figure source: NOAA NCEI / CICS-NC).

Projected Change in Number of Nights Below 32°F
Projected average number of days per year with temperatures less than 32°F for 2041-2070 compared to 1971-2000, assuming emissions continue to grow (A2 scenario). Patterns are similar, but less pronounced, assuming a reduced emissions scenario (B1). (Figure source: NOAA NCEI / CICS-NC).
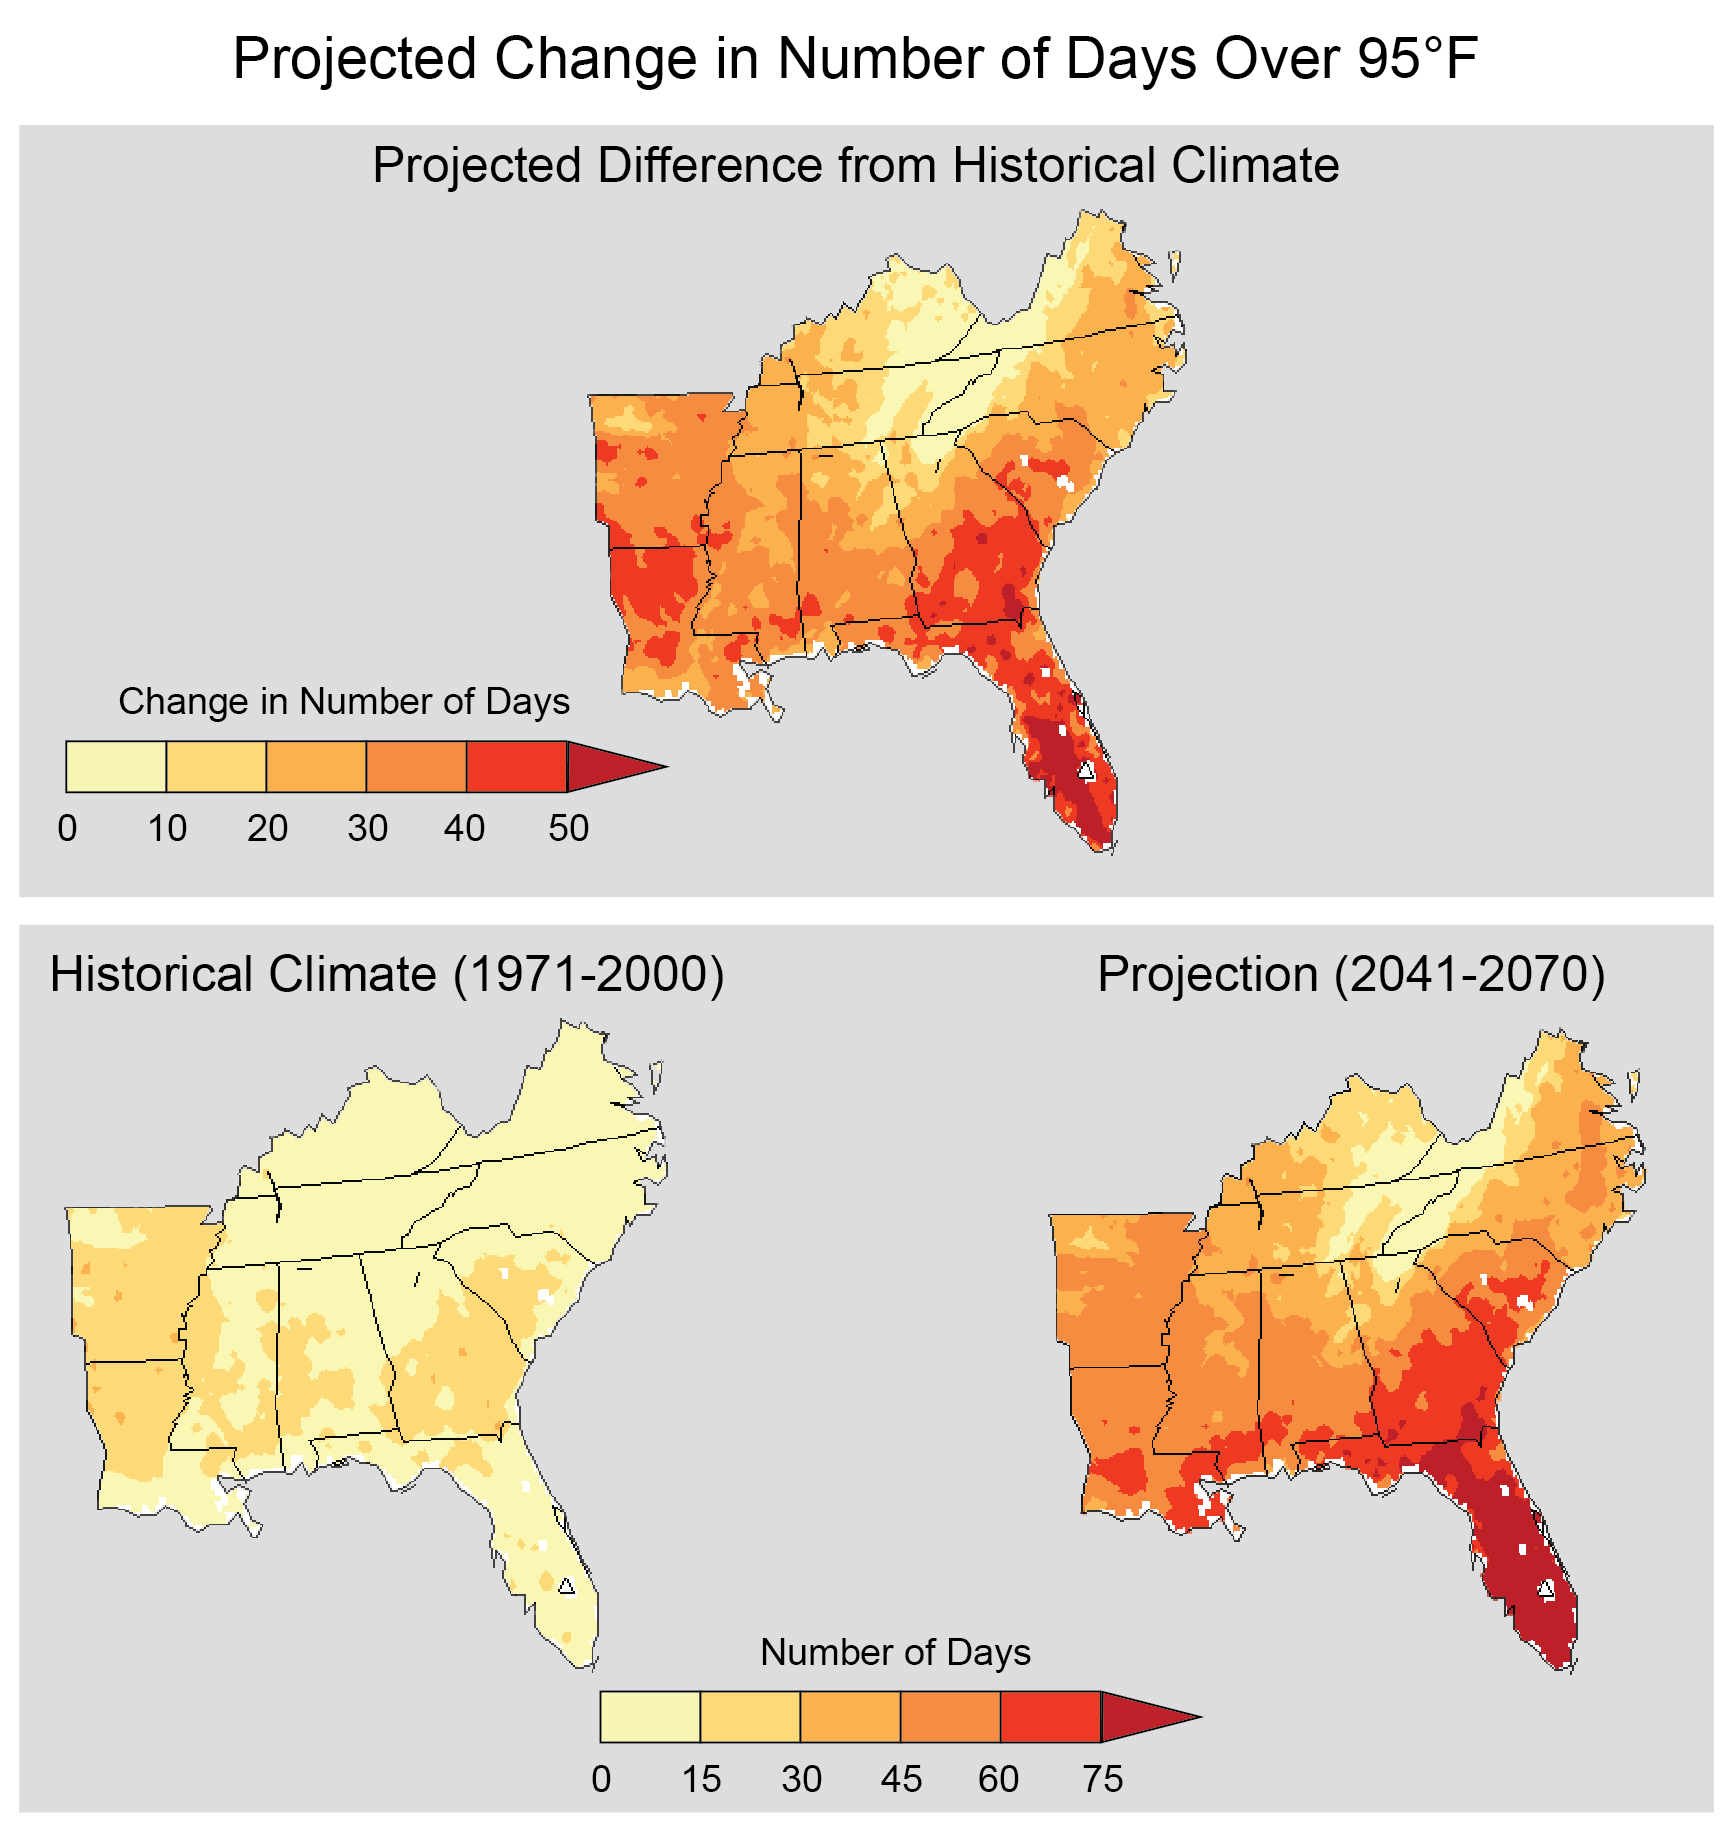
Projected Change in Number of Days Over 95°F
Projected average number of days per year with maximum temperatures above 95°F for 2041-2070 compared to 1971-2000, assuming emissions continue to grow (A2 scenario). Patterns are similar, but less pronounced, assuming a reduced emissions scenario (B1). (Figure source: NOAA NCEI / CICS-NC).

Projected Increases in the Number of Days over 90°F
Projected increase in the number of days per year with a maximum temperature greater than 90°F averaged between 2041 and 2070, compared to 1971-2000, assuming continued increases in global emissions (A2) and substantial reductions in future emissions (B1). (Figure source: NOAA NCEI / CICS-NC).
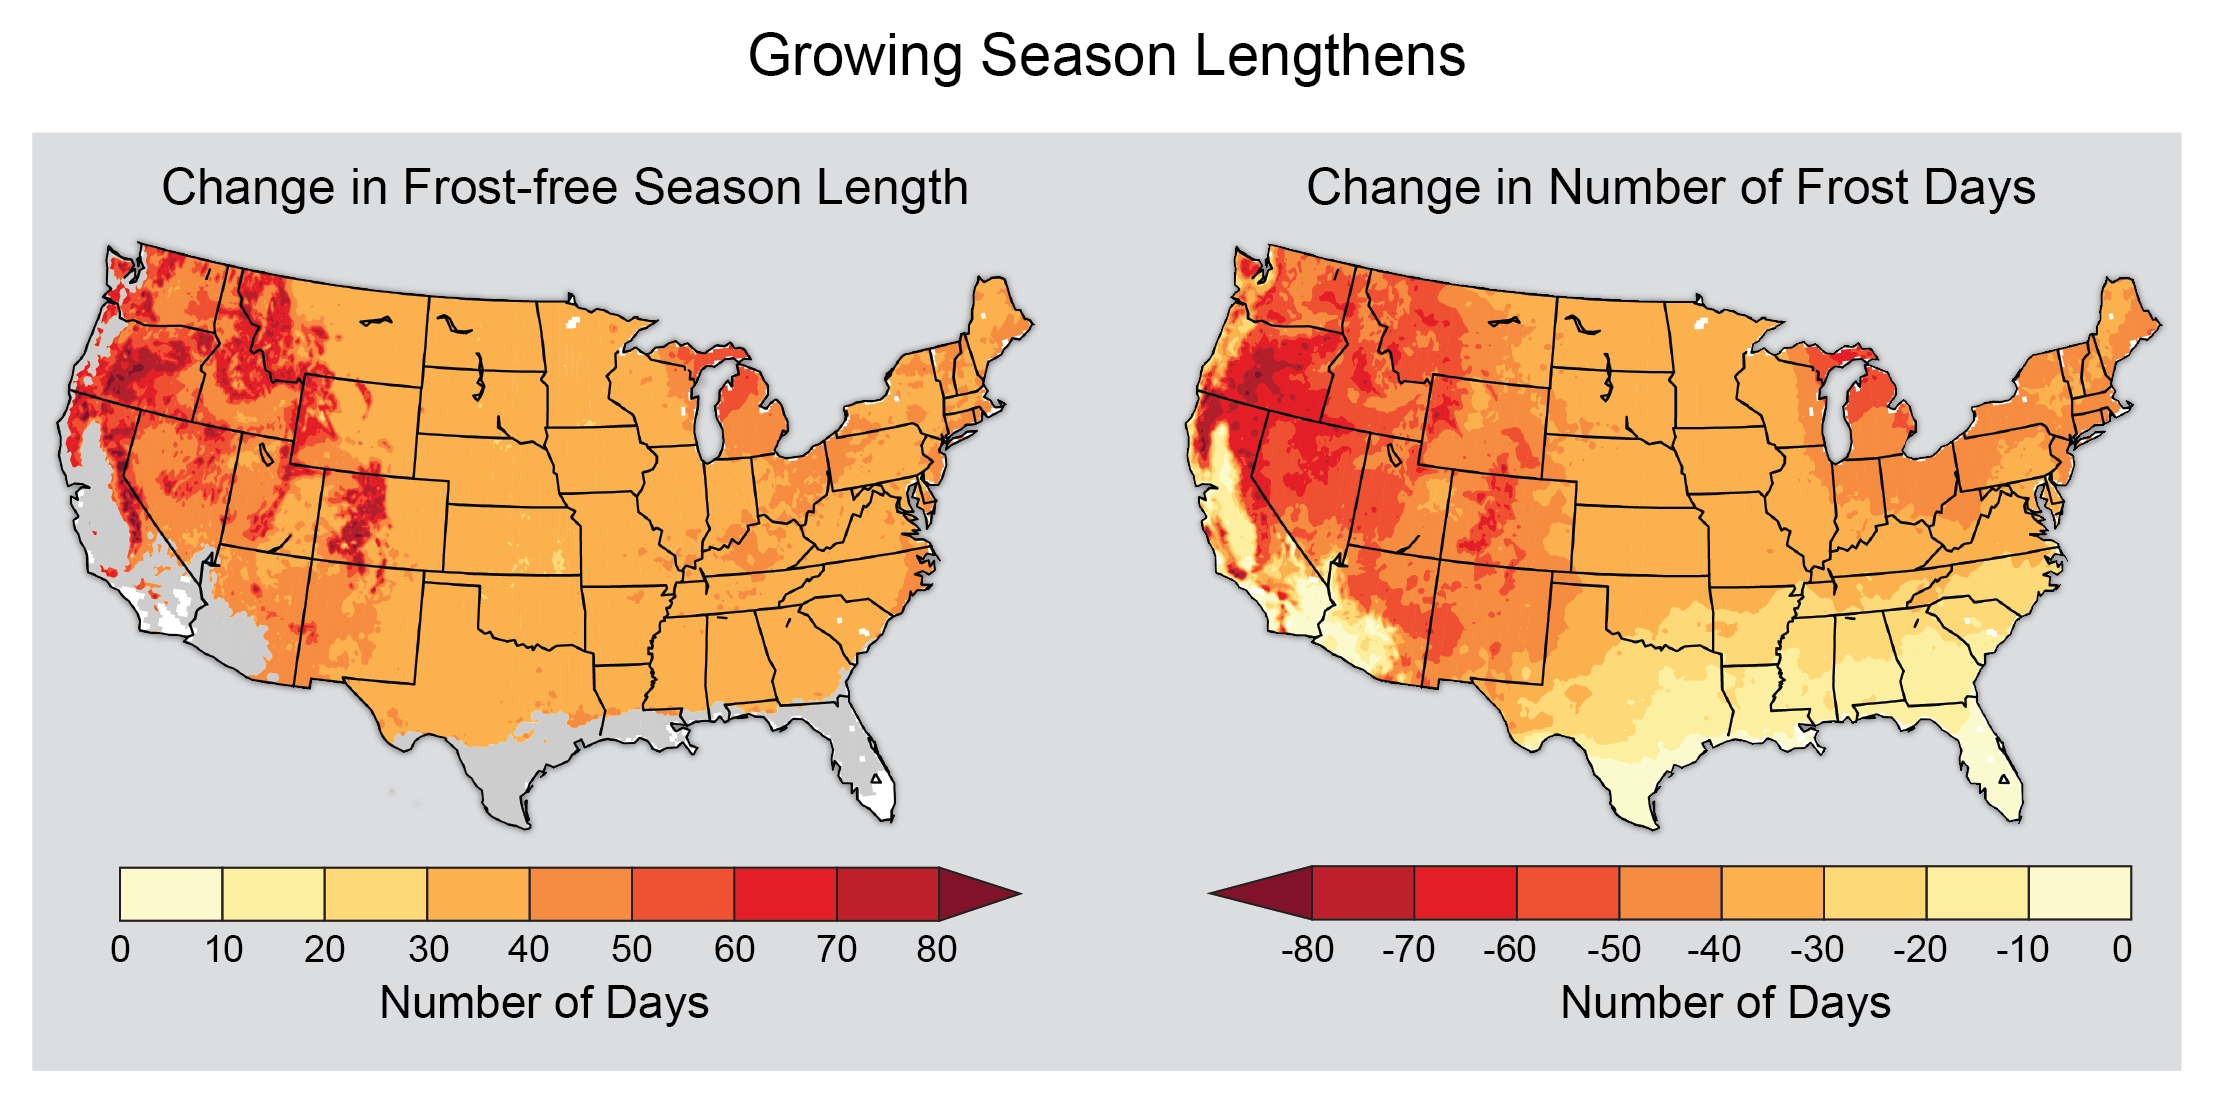
Growing Season Lengthens
The left map shows that if emissions continue to increase (A2 scenario), the U.S. growing season (or frost-free season) will lengthen by as much as 30 to 80 days by the end of the century (2070-2099 as compared to 1971-2000). The right map shows a reduction in the number of frost days (days with minimum temperatures below freezing) by 20 to 80 days in much of the United States in the same time period. While changes in the growing season may have positive effects for some crops, reductions in the number of frost days can result in early bud-bursts or blooms, consequently damaging some perennial crops grown in the United States (See also Ch. 6: Agriculture). White areas are projected to experience no freezes for 2070-2099, and gray areas are projected to experience more than 10 freeze-free years during the same period. (Figure source: NOAA NCEI / CICS-NC).