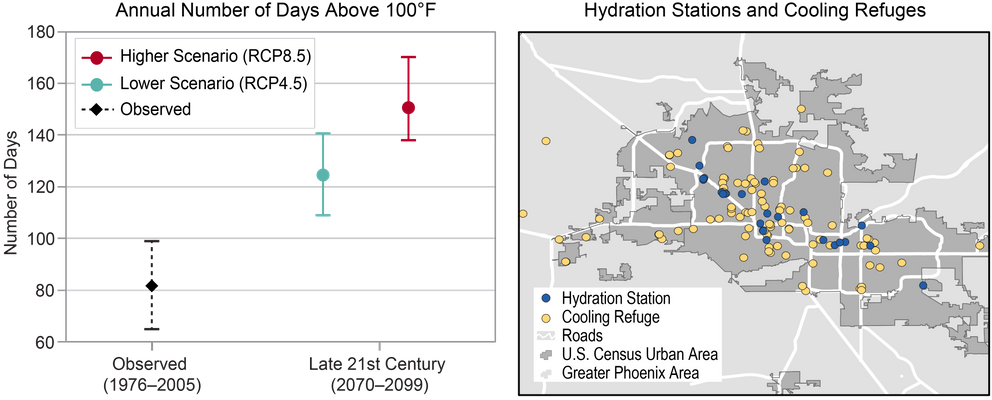
Projected Change in Very Hot Days by 2100 in Phoenix, Arizona
(left) The chart shows the average annual number of days above 100°F in Phoenix, Arizona, for 1976–2005, and projections of the average number of days per year above 100°F through the end of the 21st century (2070–2099) under the lower (RCP4.5) and higher (RCP8.5) scenarios. Dashed lines represent the 5th–95th percentile range of annual observed values. Solid lines represent the 5th–95th percentile range of projected model values. (right) The map shows hydration stations and cooling refuges (cooled indoor locations that provide water and refuge from the heat during the day) in Phoenix in August 2017. Such response measures for high heat events are expected to be needed at greater scales in the coming years if the adverse health effects of more frequent and severe heat waves are to be minimized. Sources: (left) NOAA NCEI, CICS-NC, and LMI; (right) adapted from Southwest Cities Heat Refuges (a project by Arizona State University’s Resilient Infrastructure Lab), available here. Data provided by Andrew Fraser and Mikhail Chester, Arizona State University.

