A paper led by NCICS’s Kyle Wodzicki unlocks a new approach to a key heat stress metric—and detects a troubling trend
By Mark Essig
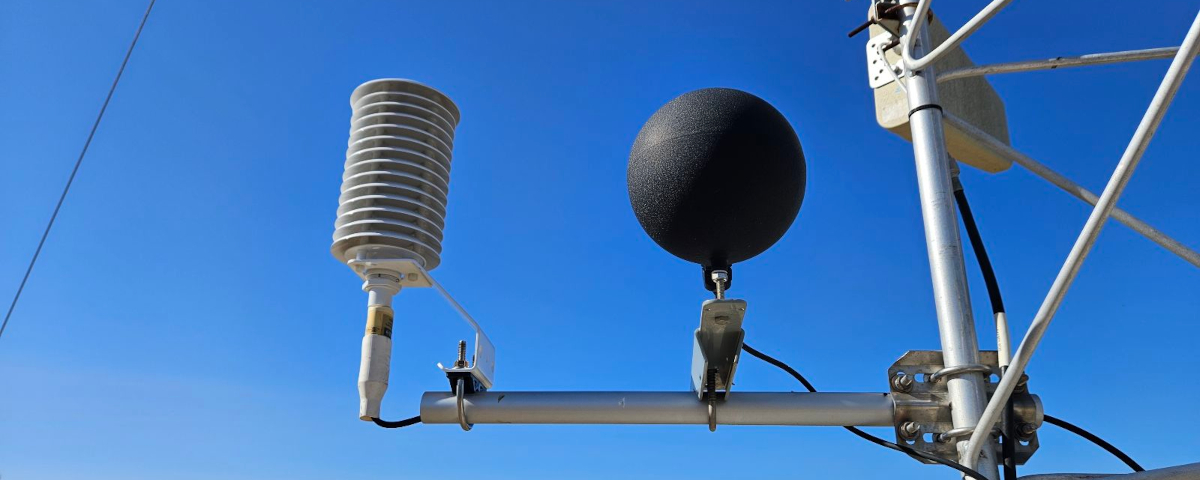
A black globe thermometer (center) and a humidity and temperature probe (left) at the NC State Climate Office’s ECONet station at Jockeys Ridge State Park. Photo courtesy of the North Carolina State Climate Office.
It’s not just the heat, it’s the humidity, as the saying goes. But what about blazing sunlight and a gentle breeze? The heat index, familiar to many, draws on temperature and relative humidity. But there’s a better metric, known as wet-bulb globe temperature (WBGT), that captures not only those two factors but also wind and solar radiation.
“The idea of WBGT is to better mimic how the body responds to heat, giving a more accurate indication of health risks,” according to Kyle Wodzicki, an atmospheric scientist and software engineer with NCICS and lead author of “Heat Stress Metrics, Trends, and Extremes in the Southeastern United States,” published in the Journal of Applied Meteorology and Climatology.
Use of WBGT has been limited because it relies on specialized instruments not found at most weather stations.
The new paper offers a fresh approach. Wodzicki and his coauthors first evaluated methods of estimating WBGT through the use of widely available weather variables, thereby dodging the need for rare instruments. They then used those estimation techniques to study trends in WBGT in the Southeast over the past seven decades—and found alarming evidence that climate change is increasing the health risks of extreme heat in the Southeast.
Wodzicki’s coauthors include North Carolina State Climatologist Kathie Dello and her colleagues Corey Davis, Sean Heuser, and Lily Raye from the State Climate Office, as well as scientists with Embry-Riddle Aeronautical University, White Sands Missile Range, and Colorado State University.
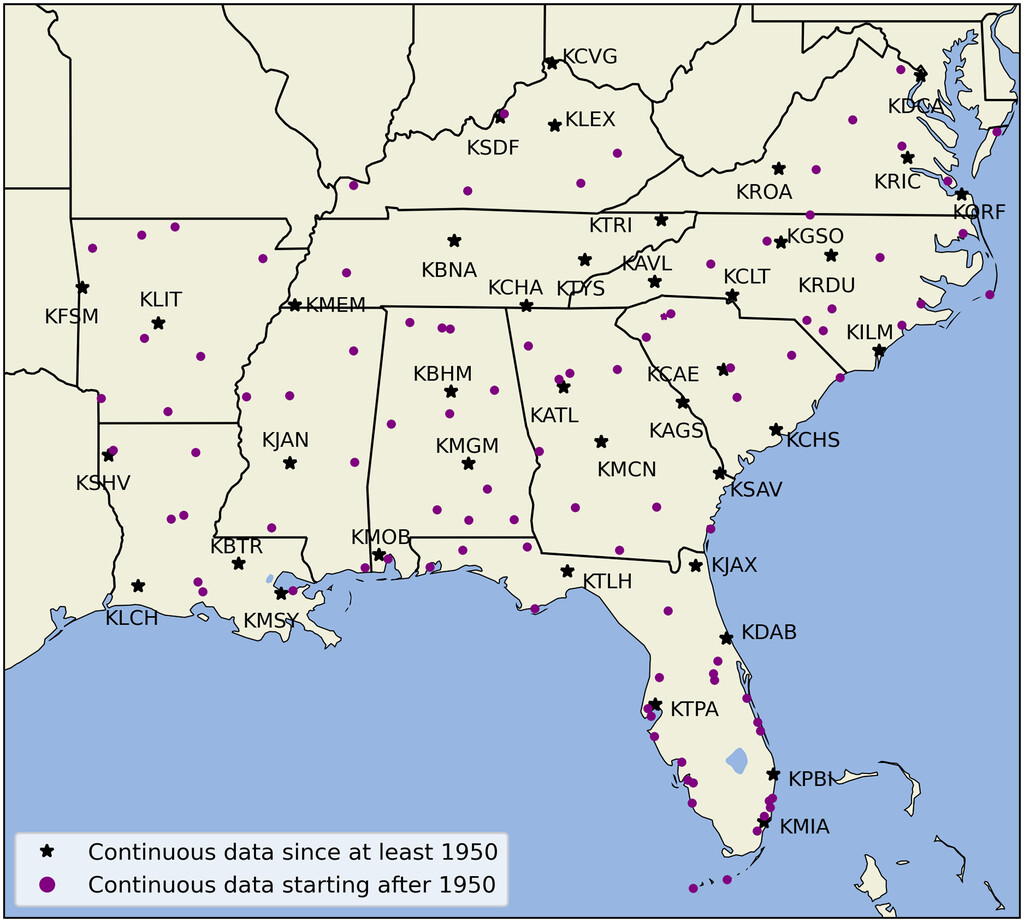
Current Automated Surface Observing Systems locations in the Southeast with continuous NOAA NCEI Integrated Surface Database data since at least 1999. The 39 locations marked with a black star had continuous hourly data back to at least 1950 and were selected for the trends and extremes analyses in this study. From Wodzicki et al. 2024.
Wet bulbs and black globes
WBGT is not new. The US military developed it in the 1950s as a way to measure environmental heat and reduce heat-related illness in training camps. The Occupational Safety and Health Administration (OSHA) recommends it as a way to determine heat risk at workplaces, and some sports programs use it as well.
But its widespread adoption has been hampered because it requires devices known as a black globe and a wet bulb. The first is a thermometer inside a black ball—typically a 6-inch copper sphere painted black—which absorbs solar radiation, capturing how hot it feels in direct sunlight. A wet bulb consists of a thermometer embedded in a cloth wick that extends down into a container of water. Capillary action draws water up the wick, where it can evaporate, cooling the thermometer much as perspiration cools the human body.
Wind affects both wet bulb and black globe temperatures—by dissipating heat on the black globe and by increasing evaporation on the wet bulb. Both factors reduce WBGT. (Note: the Wodzicki study used the variable known as natural wet bulb temperature; this is different from the more typical psychrometric wet bulb temperature, which is measured in the absence of solar radiation and, to an extent, wind; it tends to report lower values.)
As Wodzicki explains, “Those readings get combined in a simple equation—70% natural wet bulb plus 20% black globe plus 10% standard ambient air temperature—to calculate wet-bulb globe temperature.”
Though the equation is simple, finding the right data is not: black globes are rare and natural wet bulbs are even rarer, in part because it is difficult to maintain a constant water supply and keep the wick clean.
As a result, meteorologists have long sought ways to estimate WBGT from typical weather station variables, relying on complex algorithms.
Finding the right algorithm
In the new study, Wodzicki and colleagues sought to determine the best algorithm for estimating WBGT in the Southeast, where high humidity can increase heat risks.
The team acquired data from a 2021 WBGT measurement project by the US military’s Range Commanders Council Meteorology Group, which involved 13 sites across the country, including three in the Southeast.
“They had a field campaign where they went out with the actual sensors—natural wet bulb, black globe, and dry bulb—and took measurements throughout the summer,” Wodzicki says. That project provided the “truth data” against which the algorithms could be tested.
Each of the algorithms requires five meteorological variables: air temperature, humidity, atmospheric pressure, wind speed, and solar radiation. (Solar radiation often is not measured at weather stations, Wodzicki explains, but “we can get a relatively good value based on the angle of the sun.”)
The authors fed the military data into three algorithms, known as Bernard, Liljegren, and Dimiceli. An algorithm is simply a set of instructions; in this case, they define how the five measured weather variables should be combined to estimate WBGT. (A Python package containing the three algorithms is available on github.)
For example, weather stations generally take measurements of temperature and humidity at a height of 2 meters (about 6.5 feet), whereas wind speed is measured at 10 meters. The algorithms generated estimates of wind at 2 meters in order to model how wind would affect the natural wet bulb and black globe instruments; each uses a slightly different approach. To take another example, the Liljegren algorithm explicitly models wet bulb temperature using the thermodynamic processes of water evaporating from the wick and the influence of radiation, whereas Bernard and Dimiceli rely on other techniques.
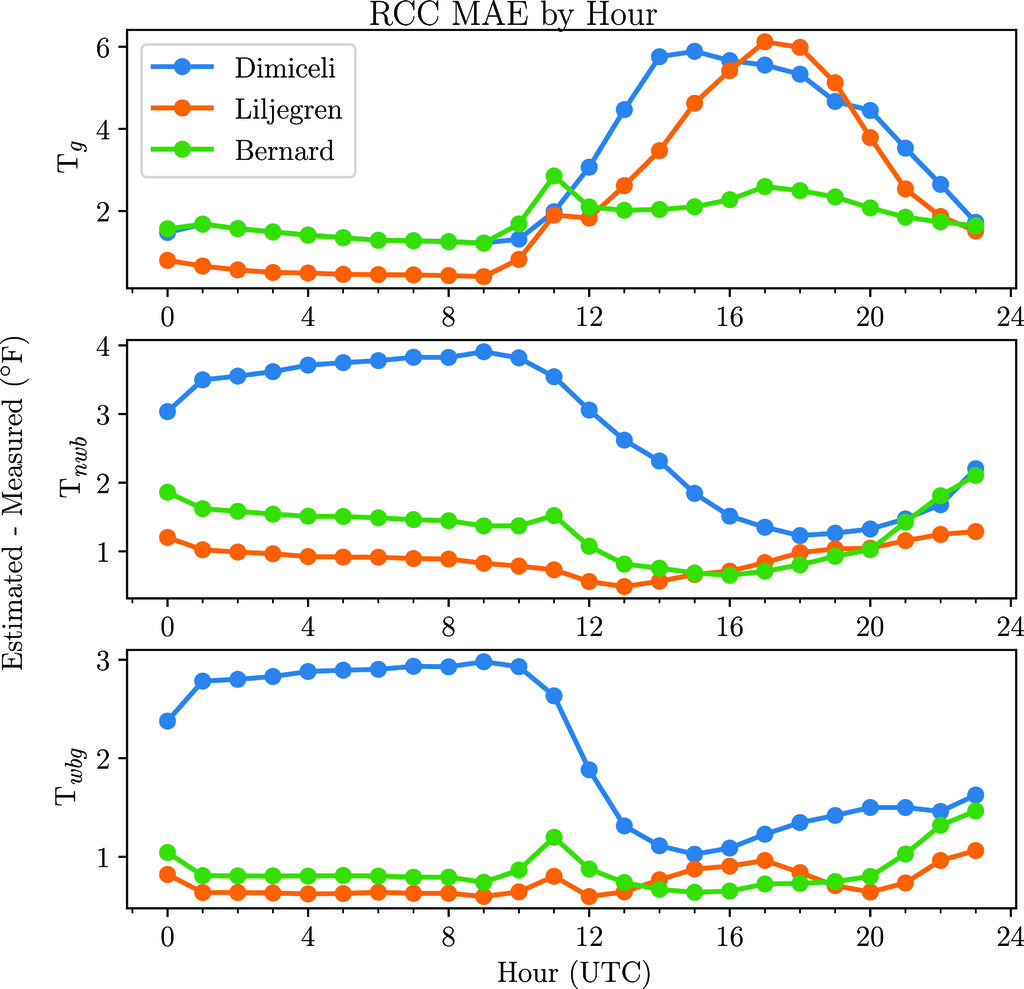
Hourly (in UTC, or Coordinated Universal Time) average mean absolute errors (MAEs) in black globe temperature (Tg), natural wet bulb temperature (Tnwb), and wet-bulb globe temperature (Twbg) across all of the US military’s Range Commanders Council (RCC) observing stations for the entire period of interest. From Wodzicki et al. 2024.
Because the algorithms use different ways of estimating WBGT, they give different results. And that’s where the military WBGT measurement campaign proved vital, allowing the authors to test the algorithms’ estimates against the military’s measured wet bulb, black globe, and WBGT values. “We could compare the algorithms’ estimates to the truth values that they had sampled at the sites,” Wodzicki said.
They found that the Liljegren algorithm provided the most accurate WBGT estimates. (Liljegren also proved to be the most computationally expensive, but that is the price of accuracy.)
The authors also relied on 2018–2022 data from 40 stations in the NC State Climate Office’s Environment & Climate Observing Network (ECONet)—which offers directly measured black globe but not wet bulb values—to perform “a secondary, longer-term check,” Wodzicki explained. That review confirmed the Liljegren algorithm’s accuracy.
Liljegren was then used to evaluate summer WBGT trends and extremes at 39 Southeast weather stations that offered continuous data records stretching back to 1950.
The study shows that WBGT has increased throughout much of the region during that period, with larger increases at night than during the day. A few high-elevation locations showed big jumps in WBGT, but the largest increases were in Florida and Louisiana, especially in cities including New Orleans, Tampa, and Miami.
And that spells public health risk, given that extreme heat is the deadliest weather-related hazard in the US. According to the authors, study results “suggest that as the climate continues to warm, heat stress may become an increasing threat to human health and industry throughout the Southeast.”
For more details on this study, read the blog post from the State Climate Office, which offers more details on WBGT, including trends in North Carolina.
Wodzicki, K. R., Ennis, K. E., Knight, D. A., Milrad, S. M., Dello, K. D., Davis, C., Heuser, S., Thomas, B., & Raye, L., 2024. Heat Stress Metrics, Trends, and Extremes in the Southeastern United States. Journal of Applied Meteorology and Climatology, 63(10), 1137–1156. https://doi.org/10.1175/JAMC-D-24-0009.1