A new paper by scientists from NCICS and Appalachian State University suggests that meteorological conditions may have had some influence on the transmission of COVID-19 in several U.S cities. The authors’ innovative choices of statistical model and meteorological dataset suggest a path forward for continued research to better inform public health planning and decisions.
A growing body of research shows that weather conditions can influence the prevalence of some respiratory diseases and that the lower temperatures and humidity common in winter may have direct effects on both virus transmission and human susceptibility. With the emergence of the COVID-19 pandemic, researchers from around the world have been working to understand whether the SARS-CoV-2 virus responsible for COVID-19 might exhibit a similar response to temperature, humidity, or other environmental conditions.
In a new study published in Science of the Total Environment, a multidisciplinary team of researchers from NCICS and Appalachian State University combined an innovative modeling technique with a high-resolution weather dataset to analyze the potential influences of temperature, specific humidity (the mass of water vapor per unit mass of air, in grams of water vapor per kilogram of air), and incoming solar radiation on COVID-19 cases in eight U.S. cities.
Author Dr. Maggie Sugg of Appalachian State University notes that “contrary to our hypothesis that temperature would be the predominant factor, our results identified a significant relationship between COVID-19 transmission and humidity in three cities (Albany, GA, New Orleans, LA, and Chicago, IL).”
Co-author Dr. Jennifer Runkle of NCICS adds that “the results are preliminary and one of the first to show an association between meteorological parameters and COVID-19 cases in U.S. cities. More research relying on a longer time series, a larger number of U.S. cities, and better data to contextualize COVID-19 cases is needed before we can be more confident in our results.”
The team used case data from the Johns Hopkins Center for Systems Science and Engineering repository for eight U.S. urban areas that experienced early outbreaks of COVID-19: Seattle, WA; New York, NY; Albany GA; New Orleans, LA.; Bridgeport-Stamford-Norwalk, CT; Pittsfield, MA; Detroit, MI; and Chicago, IL. Data on near-surface air temperature, specific humidity, and solar radiation came from the European Centre for Medium-Range Weather Forecasts (ECMWF) atmospheric reanalysis dataset (ERA5). The ERA5 reanalysis combines data from ground-based weather stations, satellites, and other observing systems with outputs from weather prediction models, resulting in a dataset with finer spatial resolution and better coverage than is available from weather station observations alone.
These heatmaps suggested that COVID-19 cases were more common in conditions with low specific humidity and low temperature
As an initial step, the authors generated density “heatmaps” that plotted daily cases across all eight cities against different combinations of daily air temperature and specific humidity for various lead times between the observed weather condition and the observed case count, ranging from 0 to 14 days (Figure 1). These heatmaps suggested that COVID-19 cases were more common in conditions with low specific humidity (2–6 g/kg) and low temperature (2°–11°C, or 35.6°– 51.8°F).
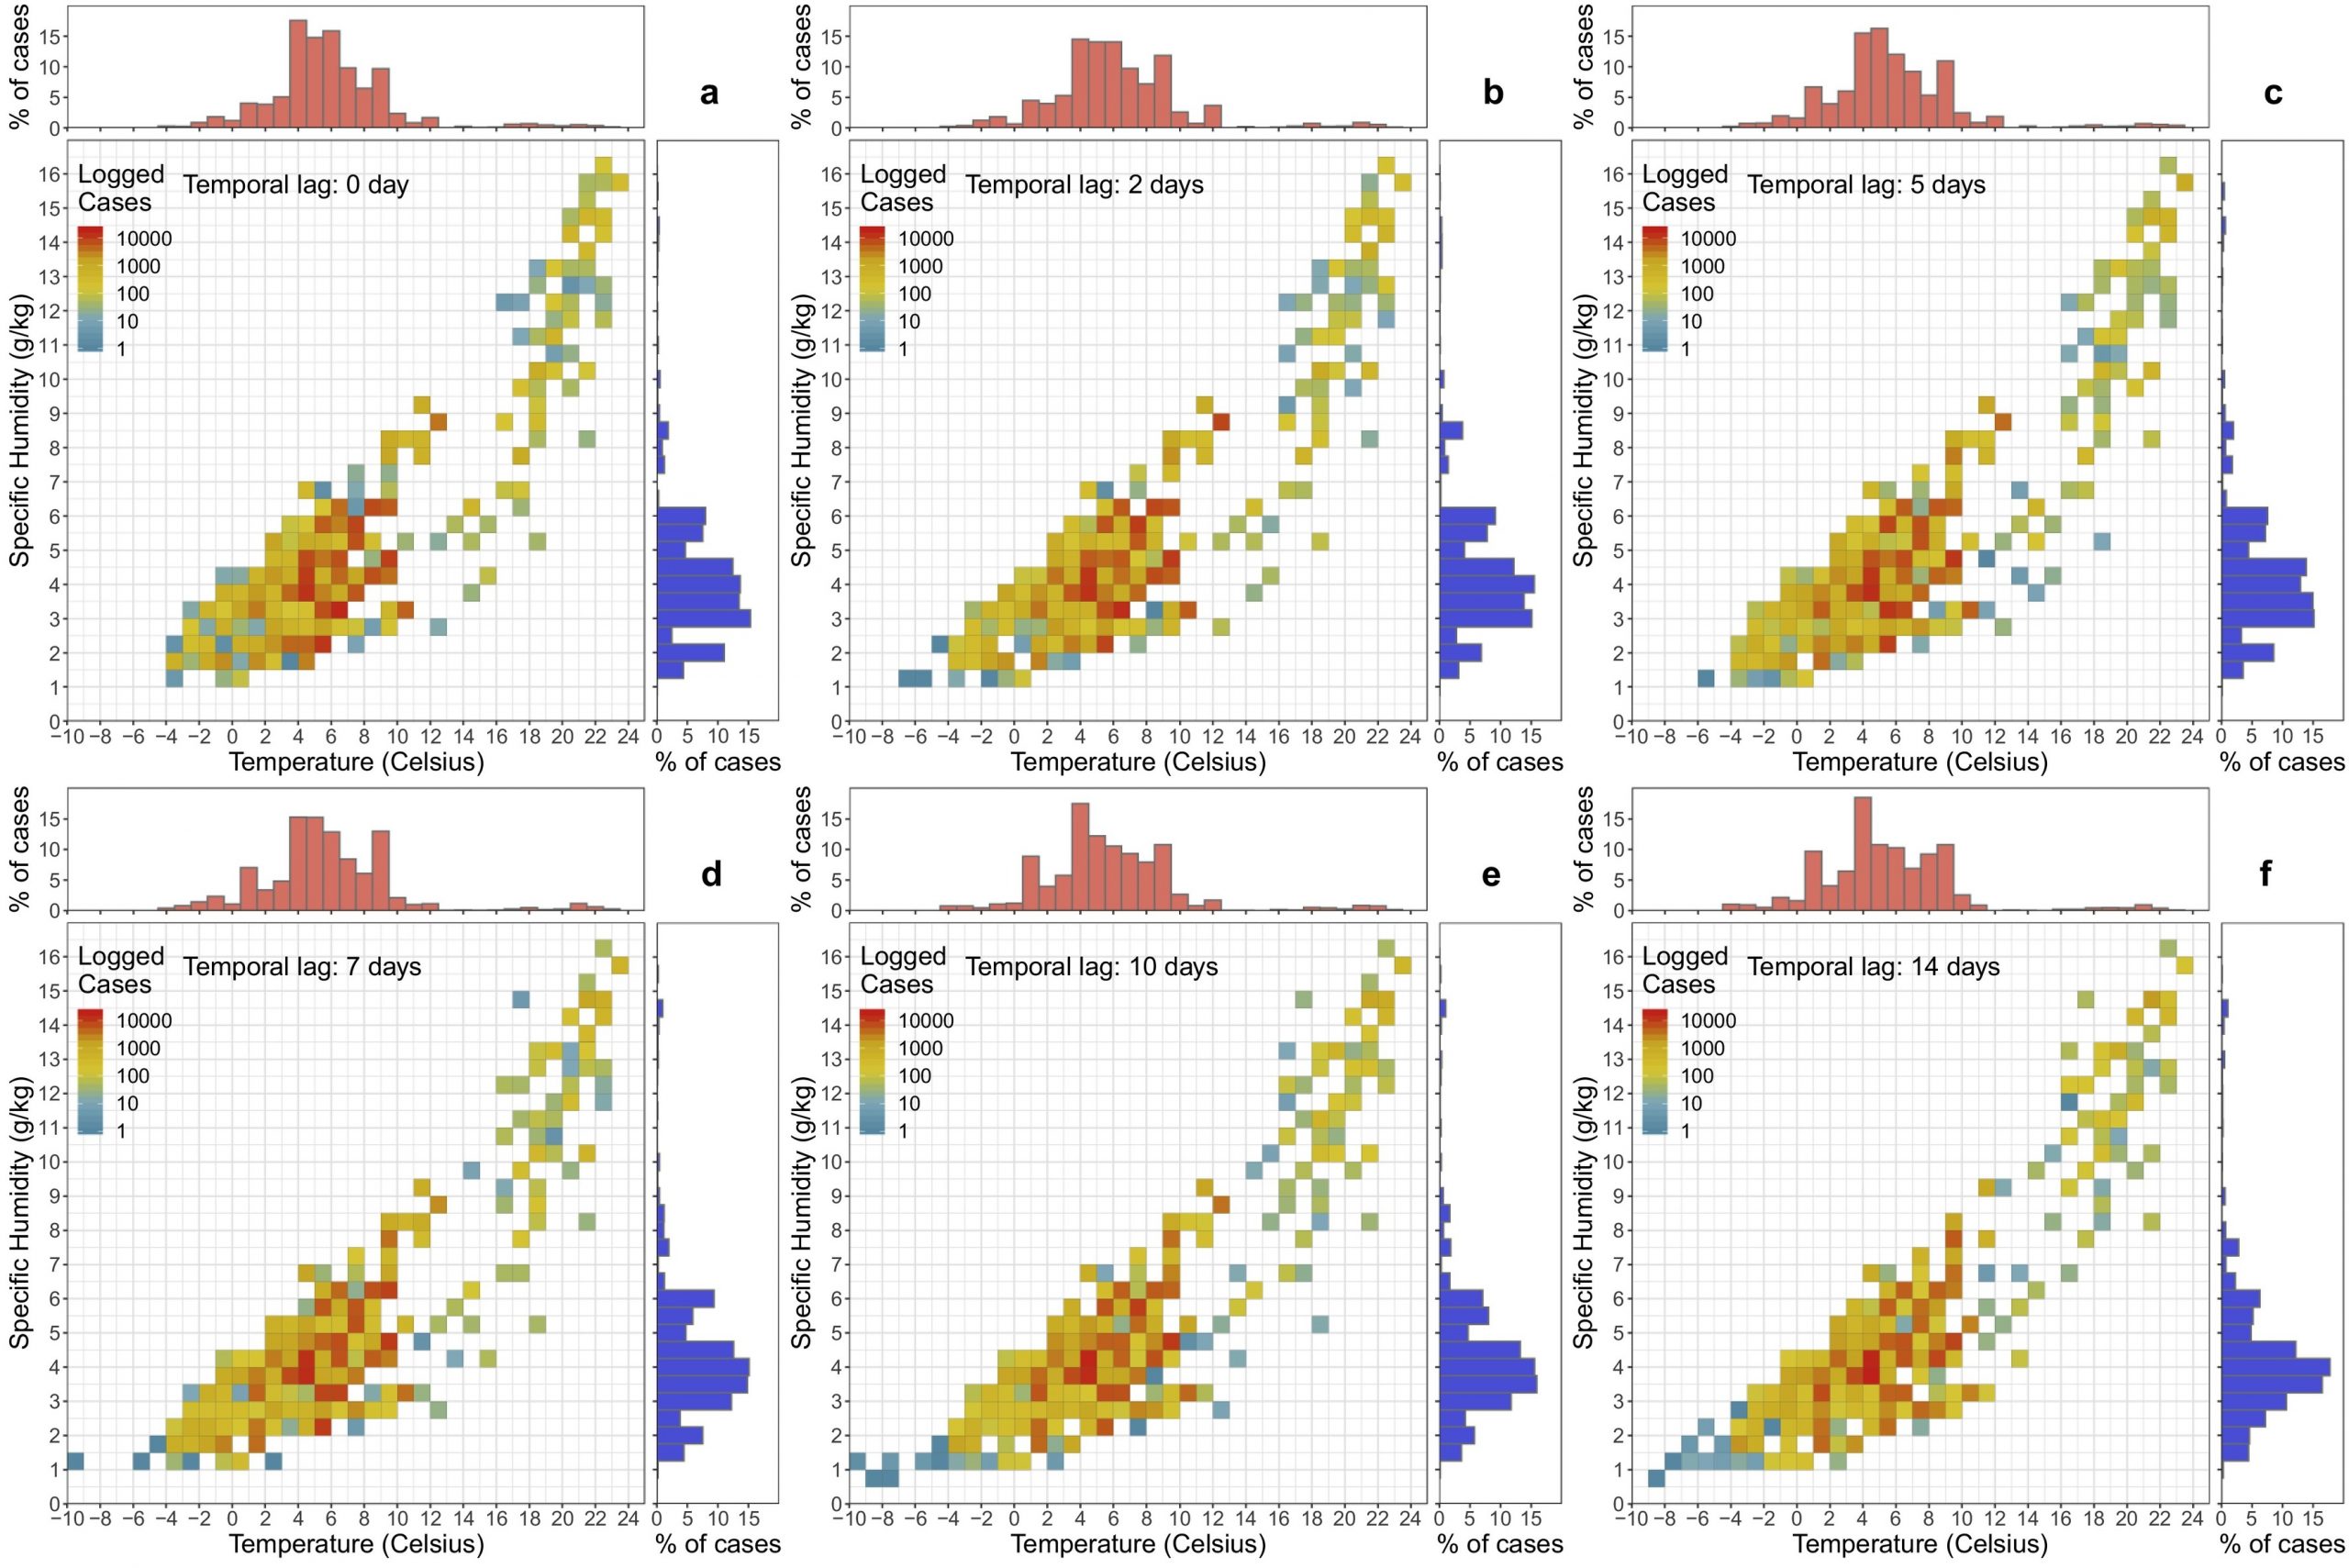
Figure 1 These density heatmaps show an association of COVID-19 cases with temperature (red histograms) and specific humidity (blue histograms) for different time lags when considering cases from all eight cities.
To explore these associations in more detail, the team then used an innovative approach that combined a case-crossover model, where each individual COVID-19 case functions as its own control, with a distributed lag non-linear model (DLNM) applied to temperature and specific humidity data from ERA5. The model also included terms to account for underlying trends and the presence or absence of social-distancing measures on a daily basis.
Dr. Runkle explained that “our group is the first to apply a sophisticated modeling approach that allowed us to simultaneously examine the delayed and nonlinear response between short-term exposure to daily weather parameters and COVID-19 transmission. To date, other U.S.-based studies have primarily relied on correlational analysis.”
Specific humidity levels in the range of 6 to 9 g/kg were a significant predictor of cases and were associated with a doubling of risk in some areas
Specific humidity showed a stronger effect than temperature across all study locations, with the majority of cities showing a nonlinear relationship between specific humidity and COVID-19 transmission (Figure 2). Specific humidity levels in the range of 6 to 9 g/kg were a significant predictor of cases and were associated with a doubling of risk in some areas. The findings are consistent with the results of other studies looking at cities in other countries that have experienced community transmission.

Figure 2. Exposure–response curves for (left) temperature, (middle) specific humidity, and (right) solar radiation for 30 days in New Orleans, LA, after adjusting for social distancing. The red lines show the estimated relative risk, and gray shading shows the 95% confidence interval range. There is a U-shaped response to humidity, with peak increases in relative risk at maximum and minimum humidities. Temperature produces a similar U-shaped curve, but model results showed humidity was the predominant predictor for the majority of study locations—adding temperature as a predictor had little effect.
It is important to note that the results do not necessarily suggest that cases of COVID-19 will decline significantly in the summer
It is important to note that the results do not necessarily suggest that cases of COVID-19 will decline significantly in the summer in the United States as a result of warmer, more humid weather. Further study involving a longer time series and COVID-19 cases across more locations is needed to confirm the influence of specific humidity. And human behavior, social interactions, local testing capacity, and public health policies will continue to play a major role in the progression of COVID-19, especially as we are still in the early stages of this pandemic.
Other environmental factors, such as air quality, may also be a factor. The authors note that social determinants of health are also important factors for understanding disparities in outcomes of COVID-19 and suggest that future research should incorporate socio-demographic data.
The authors plan to repeat the analysis later in the year, extending it to include additional geographic locations and additional case data.
Runkle, J. D., M. M. Sugg, R. D. Leeper, Y. Rao, J. L. Mathews, and J. J. Rennie, 2020: Short-term effects of weather parameters on COVID-19 morbidity in select US cities. Science of The Total Environment, 140093. http://dx.doi.org/10.1016/j.scitotenv.2020.140093
Media Contact
Tom Maycock
Science Public Information Officer
NC State’s North Carolina Institute for Climate Studies
tmaycock@ncics.org
828-271-4272