New research quantifies the relative contributions of two key factors that drive extreme precipitation events—atmospheric water vapor and upward velocity—across the continental United States. The results will help inform infrastructure planning as climate change continues to increase the frequency and intensity of heavy precipitation.
Heavy precipitation events are the product of two important ingredients: a sufficiently large amount of water vapor in the atmosphere and the upward flow of air that generates precipitation. Quantifying how each of these factors contributes to extreme precipitation events is a crucial step in understanding how extreme precipitation is changing in a warming climate.
New research published in Geophysical Research Letters shows that for the continental United States, extreme precipitation amounts generally scale linearly with precipitable water—the amount of water vapor in a column of air. But when water vapor levels are particularly high, increases in precipitable water can produce a disproportionately large increase in extreme precipitation totals.
The research team, led by Dr. Kenneth Kunkel of NC State University’s North Carolina Institute for Climate Studies, also determined that precipitable water, rather than the upward airflow generated by weather systems, is the limiting factor on the maximum amount that falls during the most intense precipitation events. These findings have important implications for designing resilient infrastructure as the climate continues to warm and the amount of moisture in the atmosphere continues to increase.
Dr. Kunkel notes that “the scientific expectation has been that extreme precipitation will increase in the future, primarily because of increases in water vapor. This research solidifies this expectation, because we see the same behavior in the historical record of extreme precipitation events.”
Accounting for the impacts of extreme precipitation events is an important component of infrastructure design. Planners often rely on NOAA’s “Atlas 14,” which provides estimated probabilities of precipitation events of various magnitudes for locations across the United States. However, climate change is increasing the frequency and intensity of heavy precipitation events in many areas, and those increases are expected to continue. As a result, the NOAA Atlas 14 design values may no longer accurately represent the likelihood and magnitude of heavy events.
Kunkel and his team knew that these observed increases in heavy precipitation are due in part to increases in water vapor. The water-holding capacity of the atmosphere increases with temperature at a rate of about 7% per degree Celsius (or 1.8 degrees Fahrenheit)—a function known as the Clausius–Clapeyron relation. So, as the climate warms, more water is available to fall as precipitation during heavy events.
But precipitation totals also depend on the dynamic behavior of the atmosphere, particularly the vertical velocity of air, which varies with the different types of weather systems associated with precipitation events and with local geographic factors, including mountain topography and proximity to ocean waters.
We found that while it was necessary that a weather system caused upward motion and initiated precipitation, the amount of precipitation was dependent on water vapor and not the magnitude of upward motion.
As Dr. Kunkel explains, the “upward movement of air causes cooling because of a decrease in pressure, and this initiates the condensation of water vapor and the formation of precipitation droplets. Low-pressure regions and fronts are weather systems that are usually accompanied by precipitation because they cause air to move upward. Regions of low pressure, such as in hurricanes and winter storms, draw air in and then upward. An advancing cold front pushes the warmer air ahead upward because the cold air is denser than the warm air.”
Given this fundamental role of upward air movement, the team was somewhat surprised by their results. Kunkel said, “We hypothesized that the strength of the weather systems, and thus the magnitude of the upward movement of air, would be correlated with the amount of heavy precipitation. Instead, we found that while it was necessary that a weather system caused upward motion and initiated precipitation, the amount of precipitation was dependent on water vapor and not the magnitude of upward motion.”
To quantify the respective roles of water vapor and vertical velocity in heavy precipitation events, the authors identified extreme precipitation events across the continental United States, using data from 3,104 observing stations in NOAA NCEI’s Global Historical Climatology Network‐Daily dataset. For each event, they derived corresponding precipitable water and vertical velocity data from two reanalysis datasets, which combine data from weather stations, satellites, and other observing systems with information from weather models.
For every station location, the team computed “amplification factors” that quantify the relationship between precipitation totals and water vapor. These amplification factors were averaged annually and for both cold and warm seasons and were aggregated by region and for the continental United States.
The team found that the average amplification factor was 2, meaning that, for example, precipitable water levels of 20–30 mm tend to produce about 40–60 mm of precipitation in an extreme event (Figure 1, top). This also means that a 15 mm increase in precipitable water produces a 30 mm increase in the amount of precipitation falling in a heavy event. There are important differences across seasons and regions of the country, largely due to variations in vertical velocity. As a result, the amplification factors vary by location from as low as 1 to as much as 3 or more in some areas. The fact that the highest extreme precipitation totals are associated with the highest precipitable water values—but not with the highest vertical velocity values (Figure 1, middle)—is a strong indication that precipitable water is the limiting factor on how much can fall in the heaviest events.
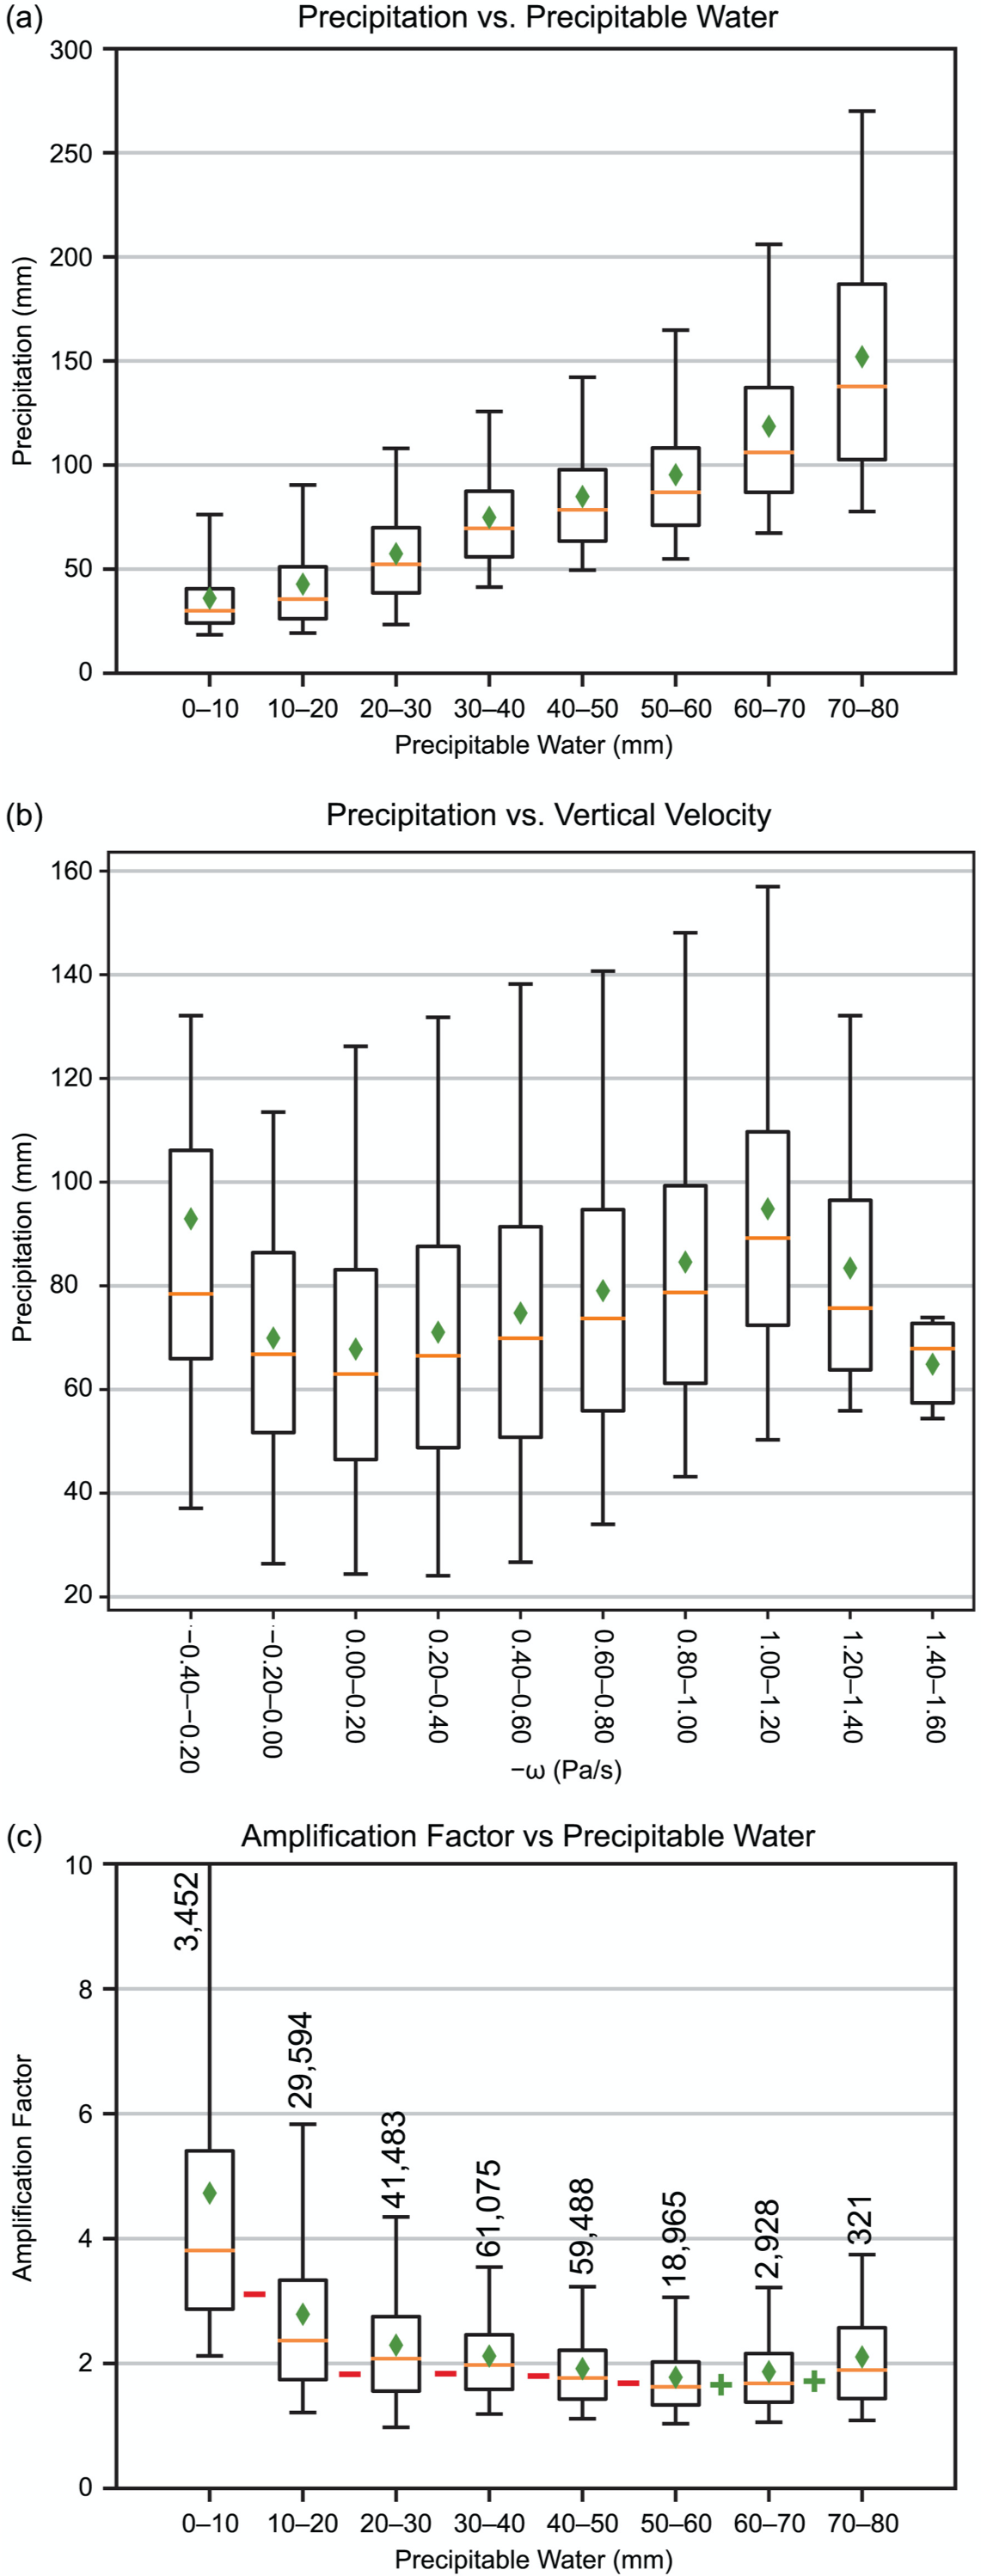
Figure 1. The first two boxplots show the relationships between extreme precipitation totals and (top) precipitable water and (middle) upward vertical velocity. Vertical velocity plays an important role in some parts of the United States and under some conditions, but there is a much stronger and more consistent relationship between precipitable water and precipitation totals. In particular, the heaviest extreme precipitation events are clearly associated with high precipitable water values but not with higher vertical velocity values, which supports the conclusion that precipitable water, rather than vertical velocity, is the limiting factor for the heaviest events. The bottom boxplot shows how the amplification factor—the amount by which extreme precipitation totals vary with precipitable water—varies at differing amounts of precipitable water. Plus and minus symbols show a statistically significant increase or decrease, respectively, in amplification factor from one precipitable water bin to the next higher bin. Amplification is strongest at low values, but there is a smaller, but important, increase at the highest values of precipitable water, which are associated with the heaviest precipitation events.
Future increases in the amounts falling in the heaviest events may outpace the rate of increase in water vapor as the climate warms.
Amplification factors vary nonlinearly at both the lower and higher ends of the precipitable water range (Figure 1, bottom). The highest amplification factors are associated with the lowest values of precipitable water, but corresponding precipitation totals are relatively small at these lower levels of precipitable water. The nonlinear response is more important when water vapor levels are higher, such as during the warm season and in the southern and eastern United States: in these cases, a given increase in water vapor has a disproportionately large effect compared to similar increases at lower levels of precipitable water.
Given this nonlinear relationship at higher water vapor levels and the finding that water vapor, rather than vertical velocity, sets the upper limit on precipitation totals during the most intense events, future increases in the amounts falling in the heaviest events may outpace the rate of increase in water vapor as the climate warms.
This research is a key component of a nearly completed, five-year Strategic Environmental Research and Development Program (SERDP) project to produce updated extreme precipitation design values for Department of Defense facilities. The project was led by Dr. Kunkel and was supported by a team of scientists from NCICS and NCEI as well as former NCEI Director Tom Karl.
Kunkel, K. E., S. E. Stevens, L. E. Stevens, and T. R. Karl, 2020: Observed climatological relationships of extreme daily precipitation events with precipitable water and vertical velocity in the contiguous United States. Geophysical Research Letters, 47, e2019GL086721. http://dx.doi.org/10.1029/2019gl086721