![]() NOAA NCEI’s Global Historical Climatology Network–Daily, or GHCN-D, dataset provides daily climate records for thousands of observing stations from around the globe, including more than 15,000 stations in the United States. Jared Rennie of NCICS has developed an innovative set of tools for accessing and displaying temperature, precipitation, heating degree days (HDD), and cooling degree days (CDD) data for GHCN-D stations in the United States. Drought monitor data are also displayed.
NOAA NCEI’s Global Historical Climatology Network–Daily, or GHCN-D, dataset provides daily climate records for thousands of observing stations from around the globe, including more than 15,000 stations in the United States. Jared Rennie of NCICS has developed an innovative set of tools for accessing and displaying temperature, precipitation, heating degree days (HDD), and cooling degree days (CDD) data for GHCN-D stations in the United States. Drought monitor data are also displayed.
Accessing the Tool
In these analyses, only stations with at least 50 years of data are included, and stations flagged as having a quality control issue are omitted.
Using the Tool
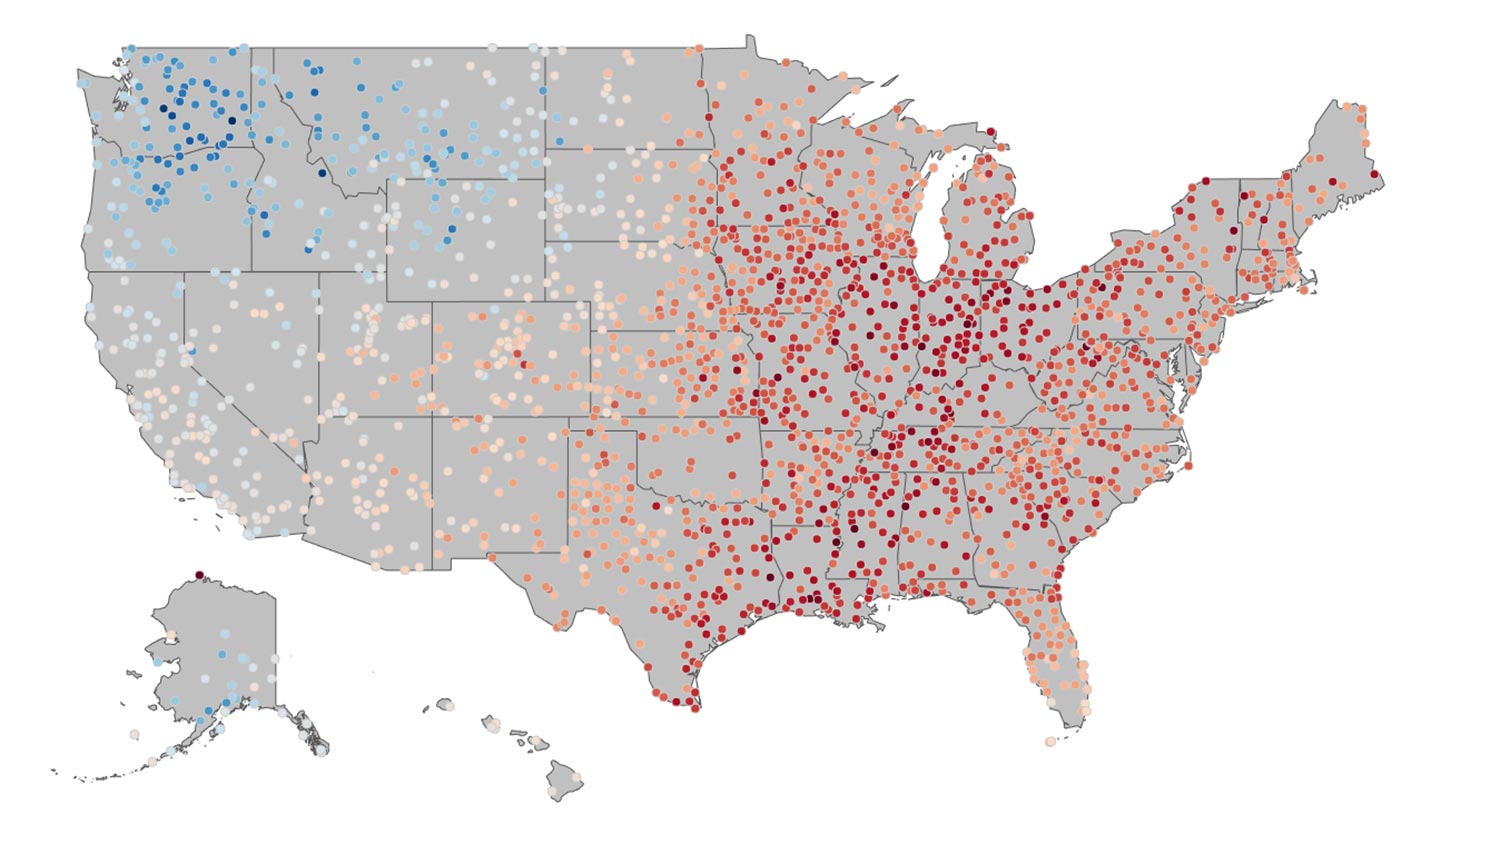
- The dots on the map show departures from the 1981–2010 averages. Temperatures are shown as departures from average in degrees Fahrenheit, while precipitation, heating degree day, and cooling degree day data are displayed as percentage departures from normal using the same base period. For the year-to-date maps, departures are based on the normal average observed as of that date.
- You can hover over an individual station to view the station ID and the current departure from normal value for that station.
- Click on any station to view a detailed plot for the year to date or previous full year.
- The temperature plots show observed daily maximum and minimum temperatures, the 1981–2010 average maximum and minimum temperature range, and the record maximum and minimum range. New records observed in the current year are indicated with colored dots.
- The precipitation, HDD, and CDD plots show accumulated precipitation over the course of the year. Values for the current year are drawn in black, with the average values and maximum and minimum years indicated using colors as shown in the key at the bottom of each graph.
Archive
Comments, questions, and feedback welcome, via email to Jared Rennie.