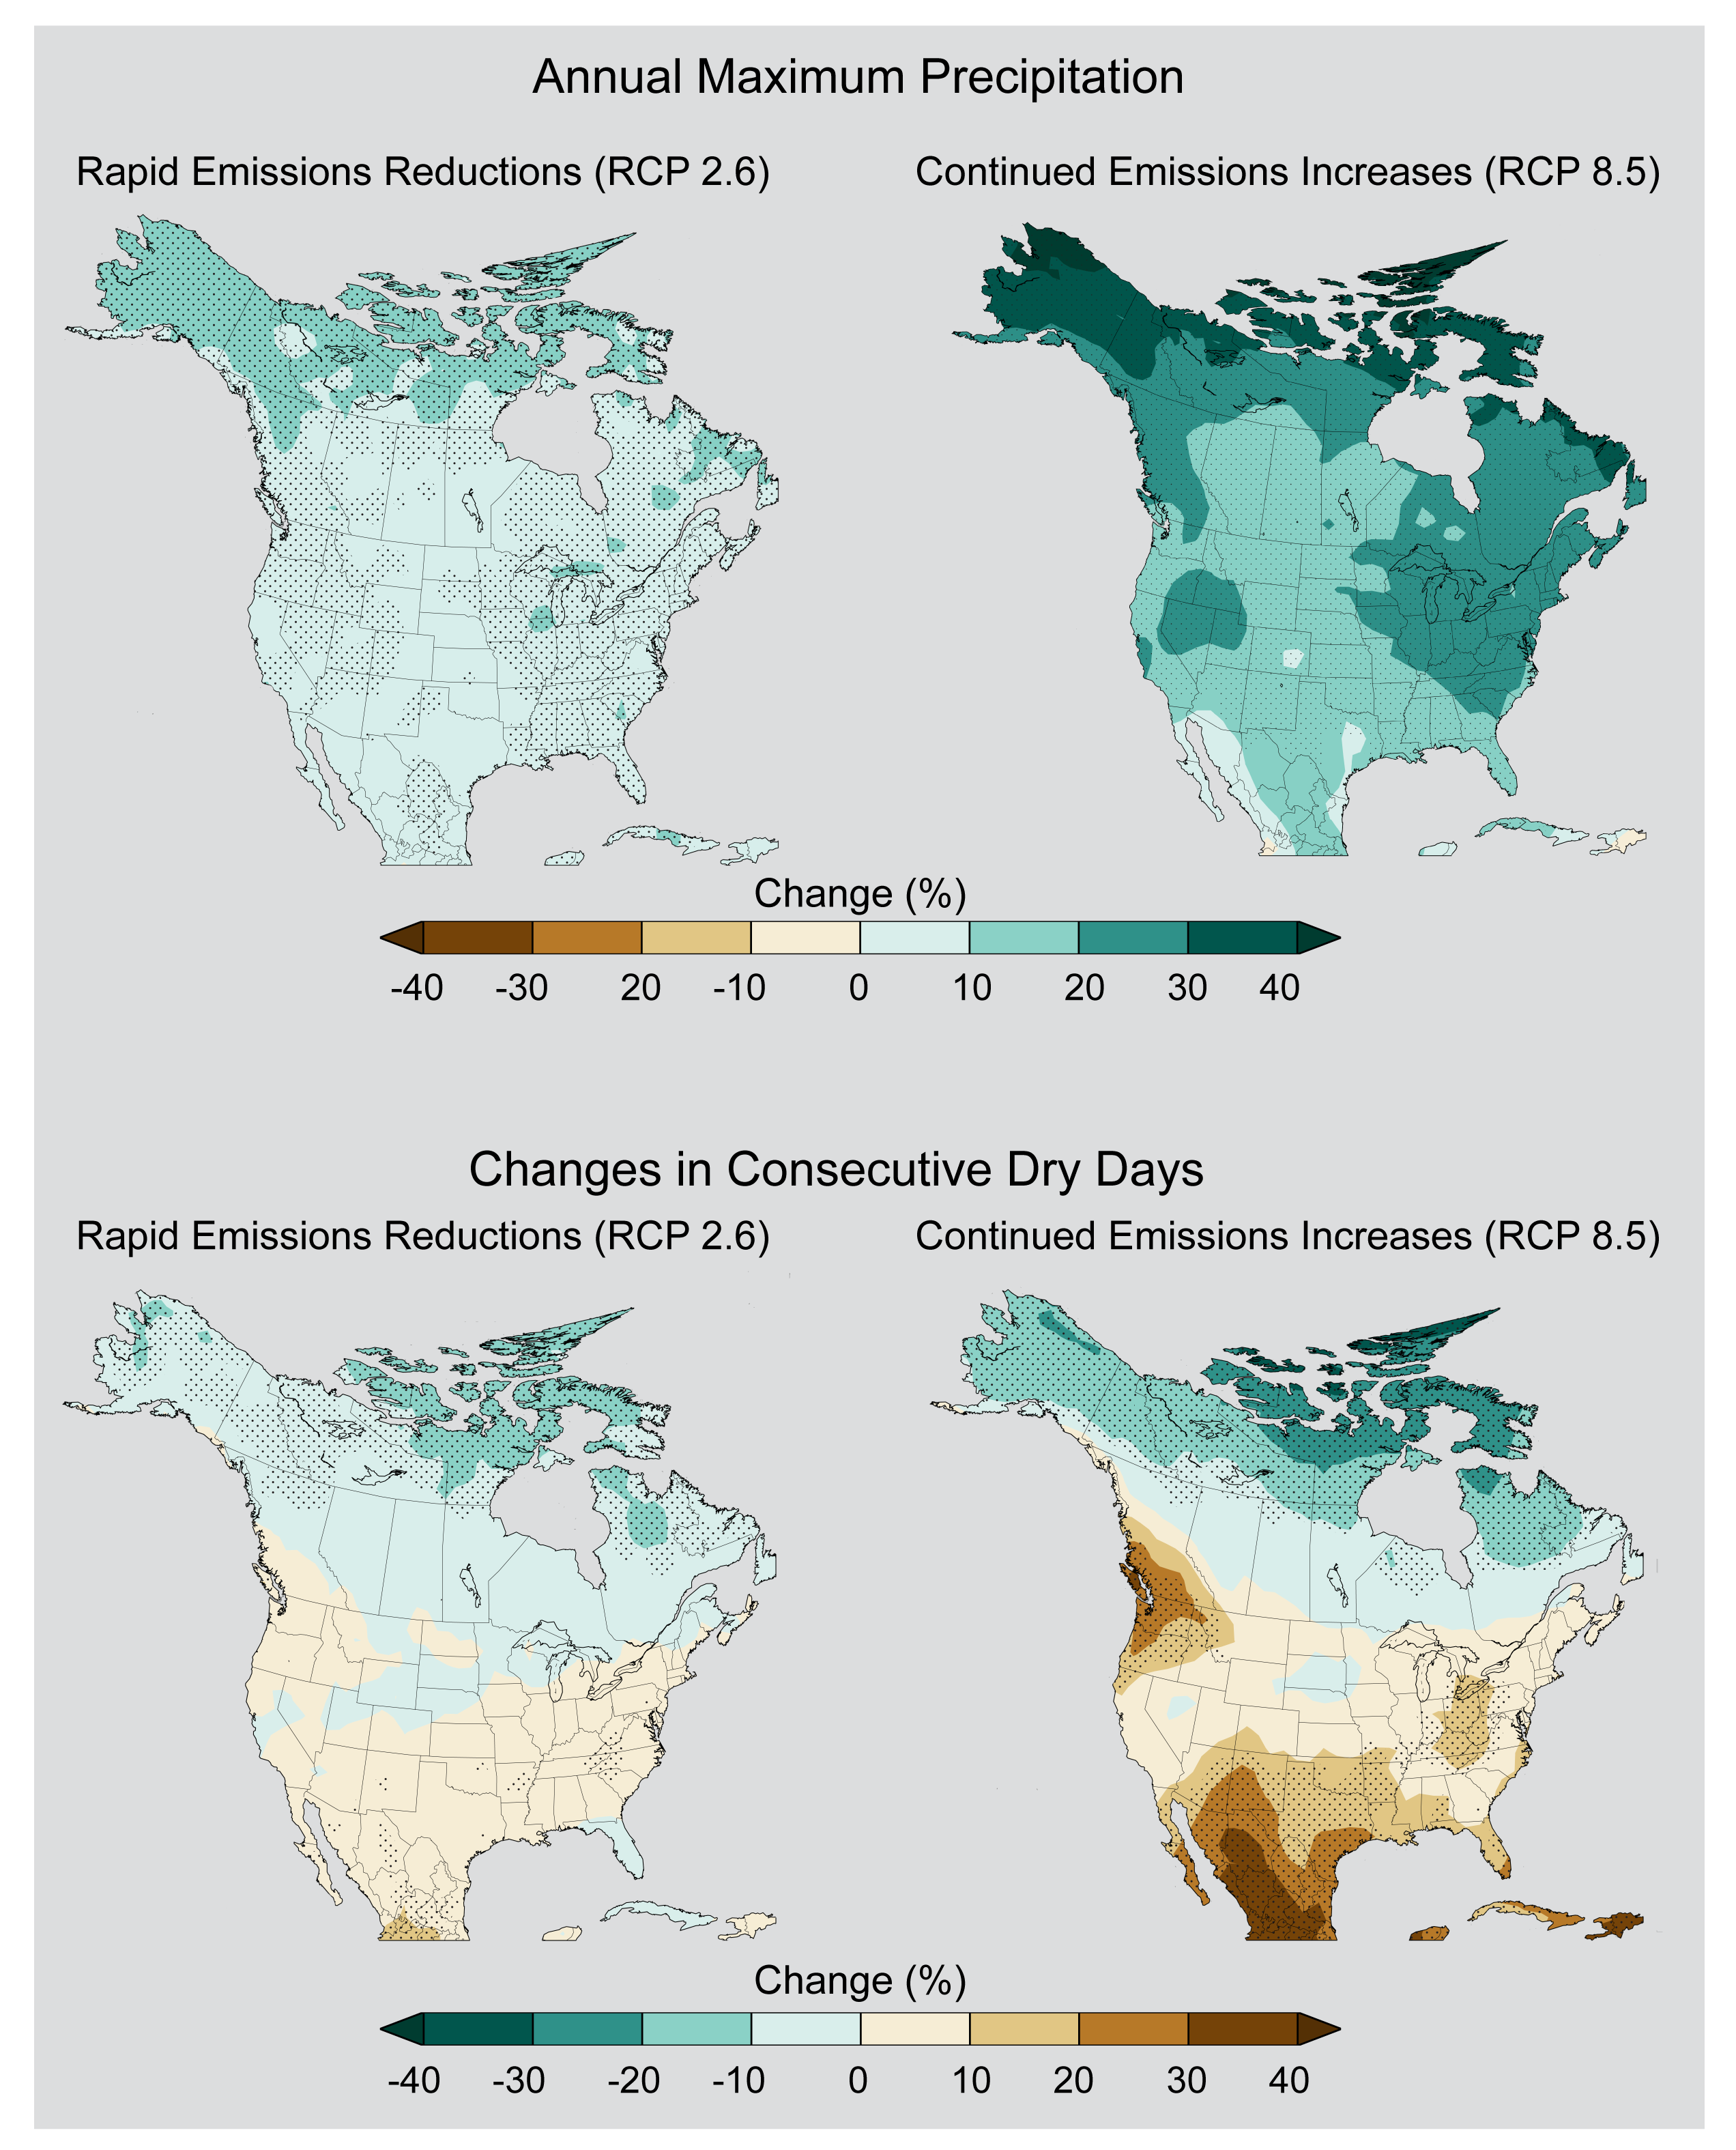
Annual Maximum Precipitation and Changes in Consecutive Dry Days
Left panel shows simulated changes in the average amount of precipitation falling on the wettest day of the year for the period 2070-2099 as compared to 1971-2000 under a scenario that assumes rapid reductions in emissions (RCP 2.6) and one that assumes continued emissions increases (RCP 8.5). Right panel shows simulated changes in the annual maximum number of consecutive dry days (days receiving less than 0.04 inches (1 mm) of precipitation) under the same two scenarios. Simulations are from CMIP5 models. Stippling indicates areas where changes are consistent among at least 80% of the models used in this analysis. (Figure source: NOAA NCEI / CICS-NC).

