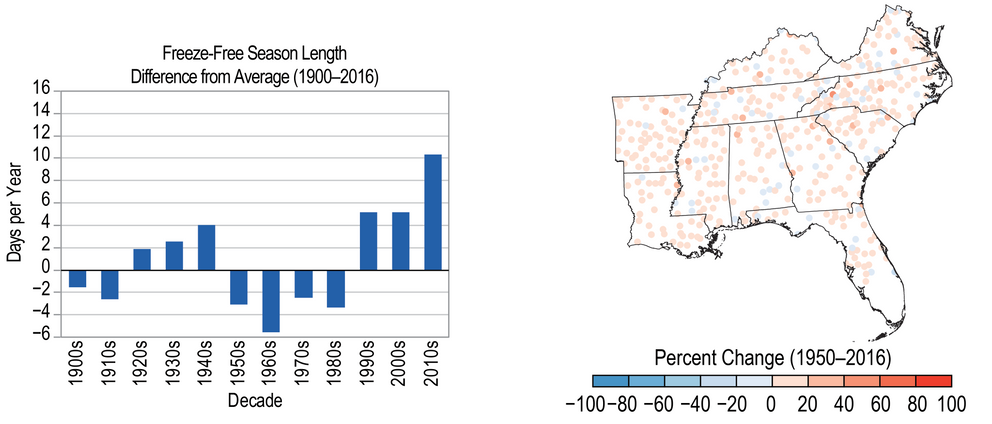
Historical Change in Freeze-Free Season Length
The figure shows the variability and change in the length of the freeze-free season. (left) The bar chart shows differences in the length of the freeze-free season by decade (1900–2016) as compared to the long-term average for the Southeast. (right) The map shows trends over 1950–2016 for individual weather stations. The length of the freeze-free season has increased at most stations, particularly since the 1980s. Sources: NOAA NCEI and CICS-NC.

