Historical Changes in Hot Days and Warm Nights
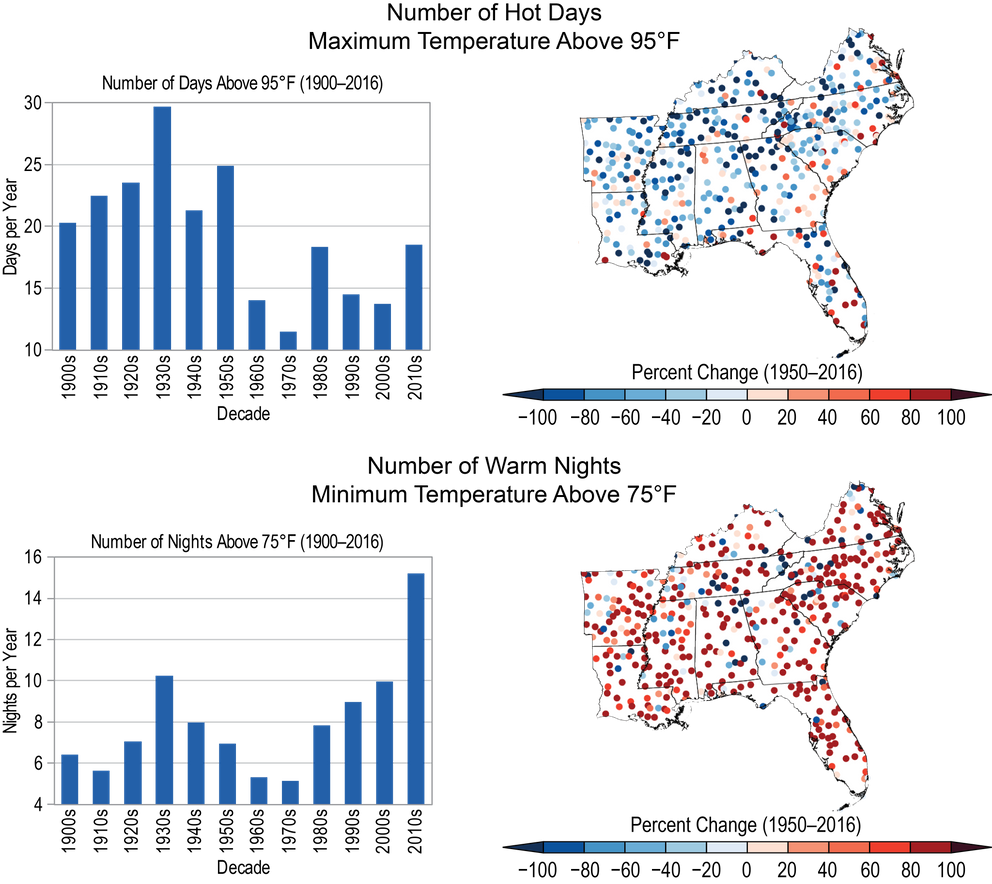
Sixty-one percent of major Southeast cities are exhibiting some aspects of worsening heat waves, which is a higher percentage than any other region of the country.{{< tbib '12' '4b55e347-52cb-4301-9eea-ad3858c6fc1d' >}} Hot days and warm nights together impact human comfort and health and result in the need for increased cooling efforts. Agriculture is also impacted by a lack of nighttime cooling. Variability and change in (top) the annual number of hot days and (bottom) warm nights are shown. The bar charts show averages over the region by decade for 1900–2016, while the maps show the trends for 1950–2016 for individual weather stations. Average summer temperatures during the most recent 10 years have been the warmest on record, with very large increases in nighttime temperatures and more modest increases in daytime temperatures, as indicated by contrasting changes in hot days and warm nights. (top left) The annual number of hot days (maximum temperature above 95°F) has been lower since 1960 than the average during the first half of the 20th century; (top right) trends in hot days since 1950 are generally downward except along the south Atlantic coast and in Florida due to high numbers during the 1950s but have been slightly upward since 1960, following a gradual increase in average daytime maximum temperatures during that time. (bottom left) Conversely, the number of warm nights (minimum temperature above 75°F) has doubled on average compared to the first half of the 20th century and (bottom right) locally has increased at most stations. Sources: NOAA NCEI and CICS-NC.

