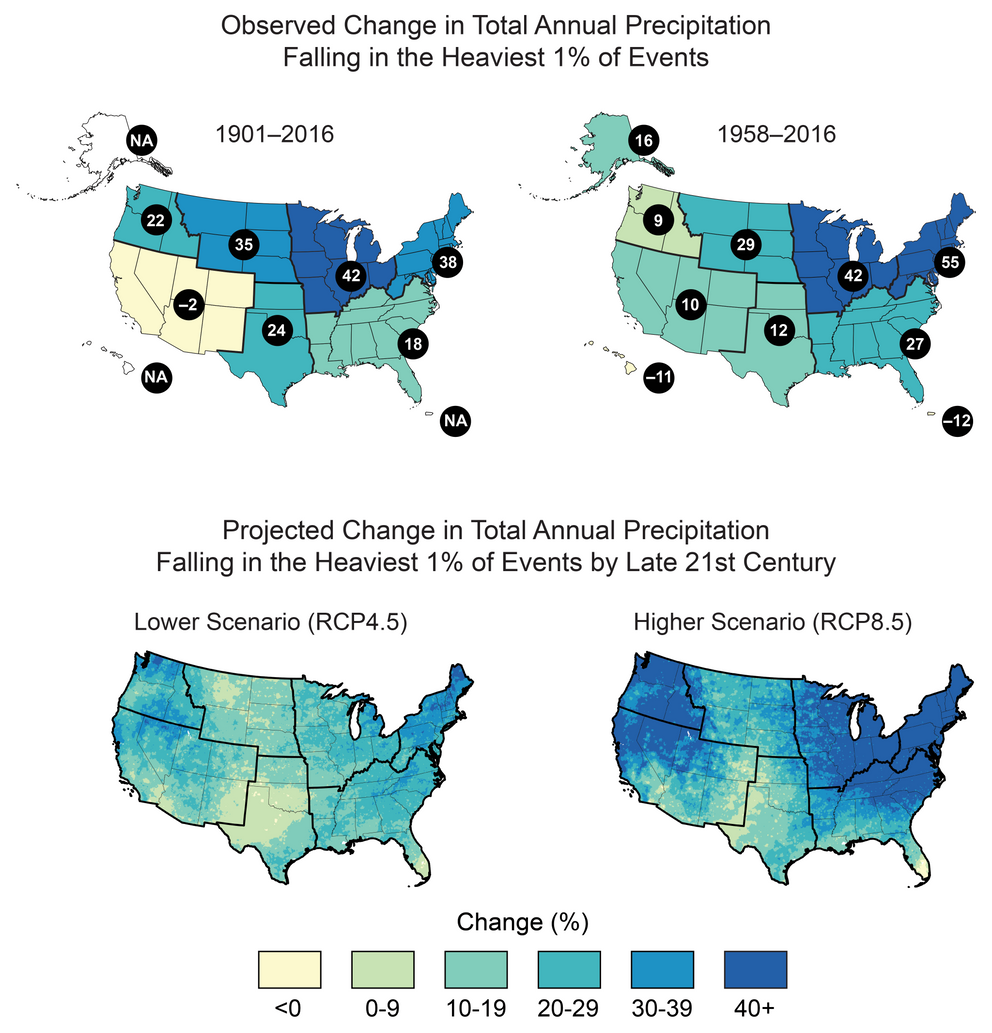
Observed and Projected Change in Heavy Precipitation
Heavy precipitation is becoming more intense and more frequent across most of the United States, particularly in the Northeast and Midwest, and these trends are projected to continue in the future. This map shows the observed (top; numbers in black circles give the percentage change) and projected (bottom) change in the amount of precipitation falling in the heaviest 1% of events (99th percentile of the distribution). Observed historical trends are quantified in two ways. The observed trend for 1901–2016 (top left) is calculated as the difference between 1901–1960 and 1986–2016. The values for 1958–2016 (top right), a period with a denser station network, are linear trend changes over the period. The trends are averaged over each National Climate Assessment region. Projected future trends are for a lower (RCP4.5, left) and a higher (RCP8.5, right) scenario for the period 2070–2099 relative to 1986–2015. Source: adapted from Easterling et al. 2017.{{< tbib '94' 'e8089a19-413e-4bc5-8c4a-7610399e268c' >}} Data for projected changes in heavy precipitation were not available for Alaska, Hawai‘i, or the U.S. Caribbean. Sources: (top) adapted from Easterling et al. 2017; (bottom) NOAA NCEI, CICS-NC, and NEMAC.

