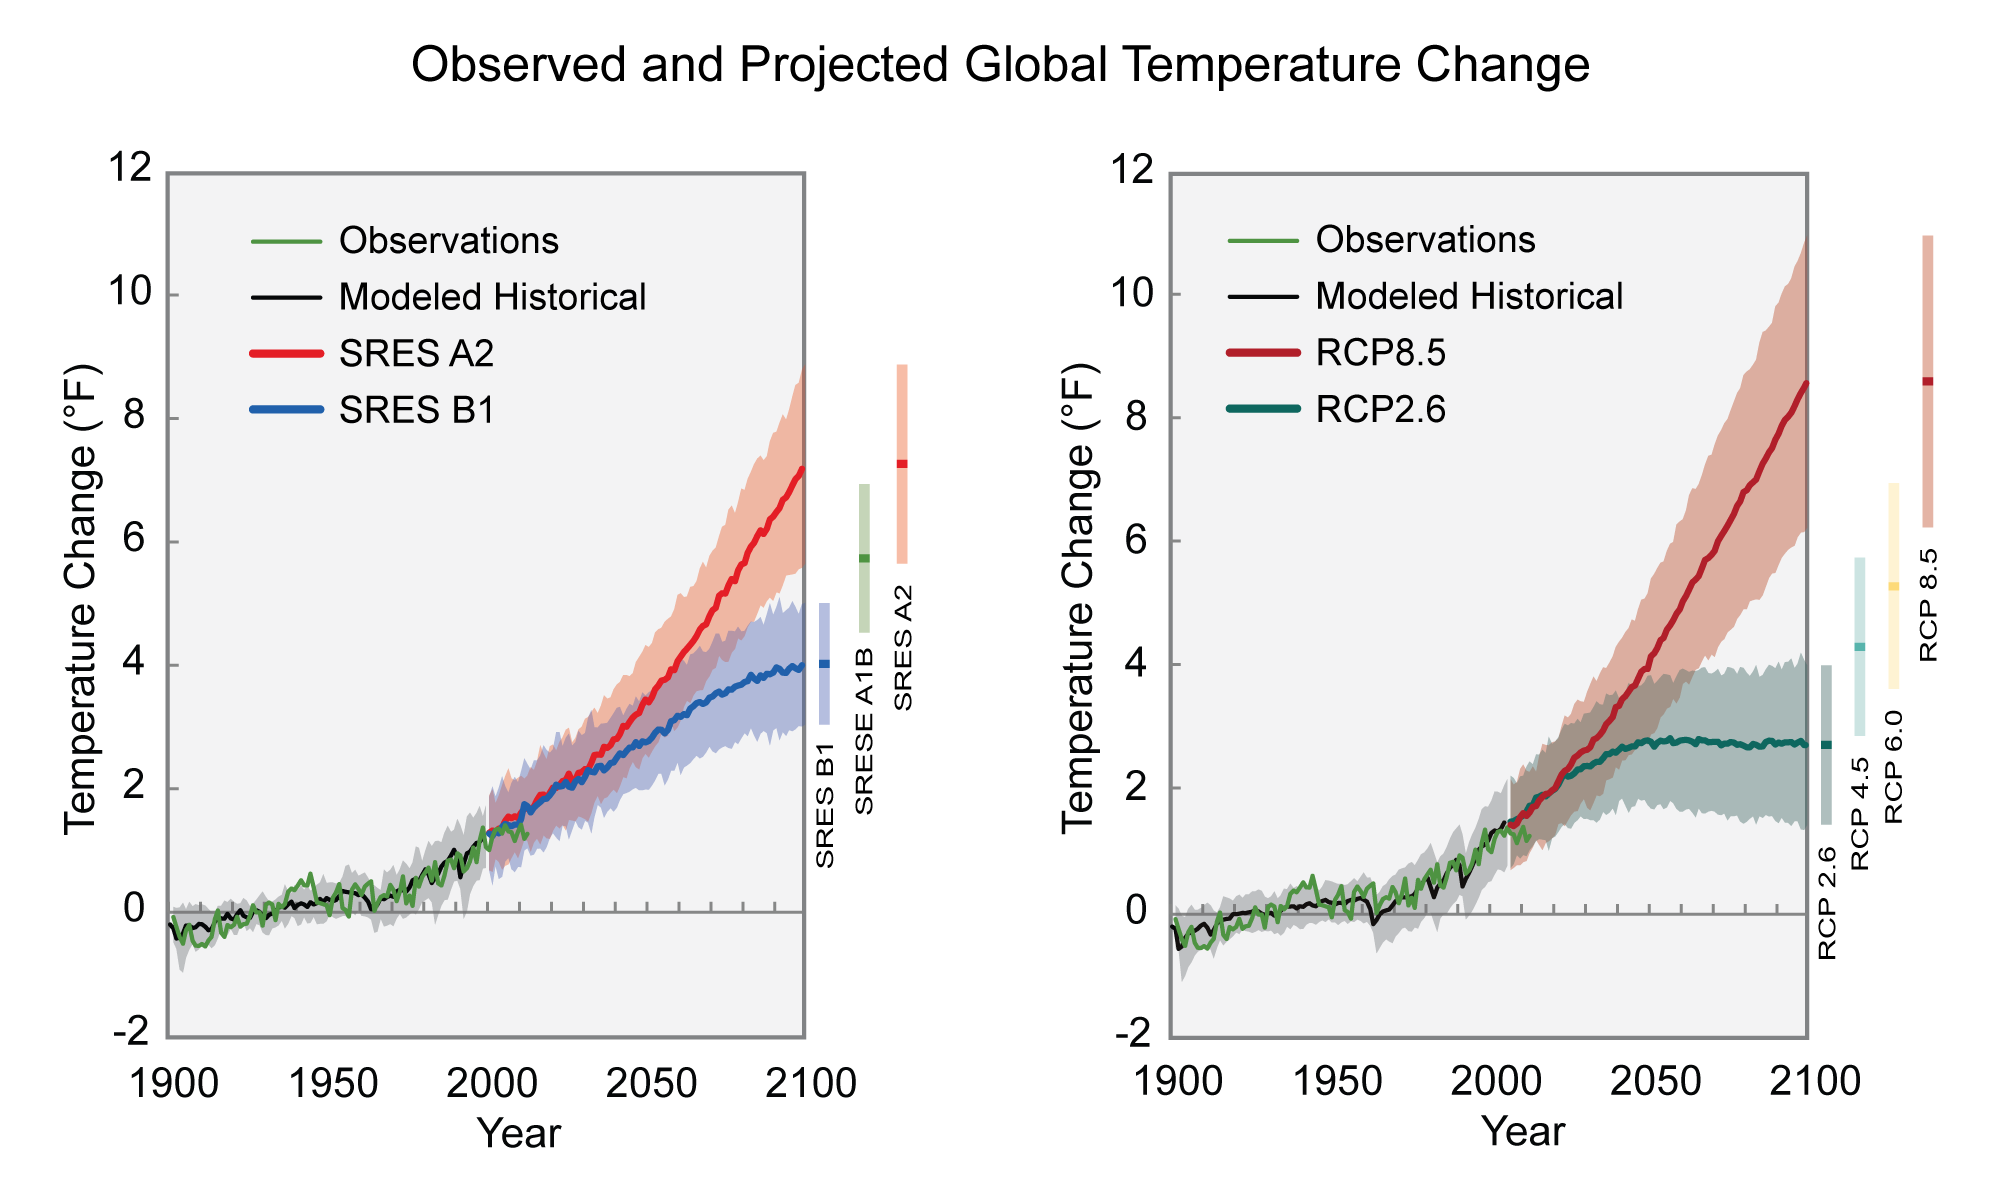
Observed and Projected Global Temperature Change
Time series of global average temperature changes (relative to the 1901–1960 average) for specific emissions pathways. Shading indicates the range (5th to 95th percentile) of results from a suite of climate models. Projections in 2099 for additional emissions pathways are indicated by the bars to the right of each panel. The left panel shows the CMIP3 simulations for the SRES A2 and B1 scenarios. The right panel shows the CMIP5 simulations for the RCP8.5 and 2.6 scenarios. The thick solid lines show the multi-model mean values. The thin green line shows the observed global temperature. Figure source: Adapted from Melillo et al. (2014).
URL: http://nca2014.globalchange.gov/report/our-changing-climate/future-climate-change#narrative-page-16565

