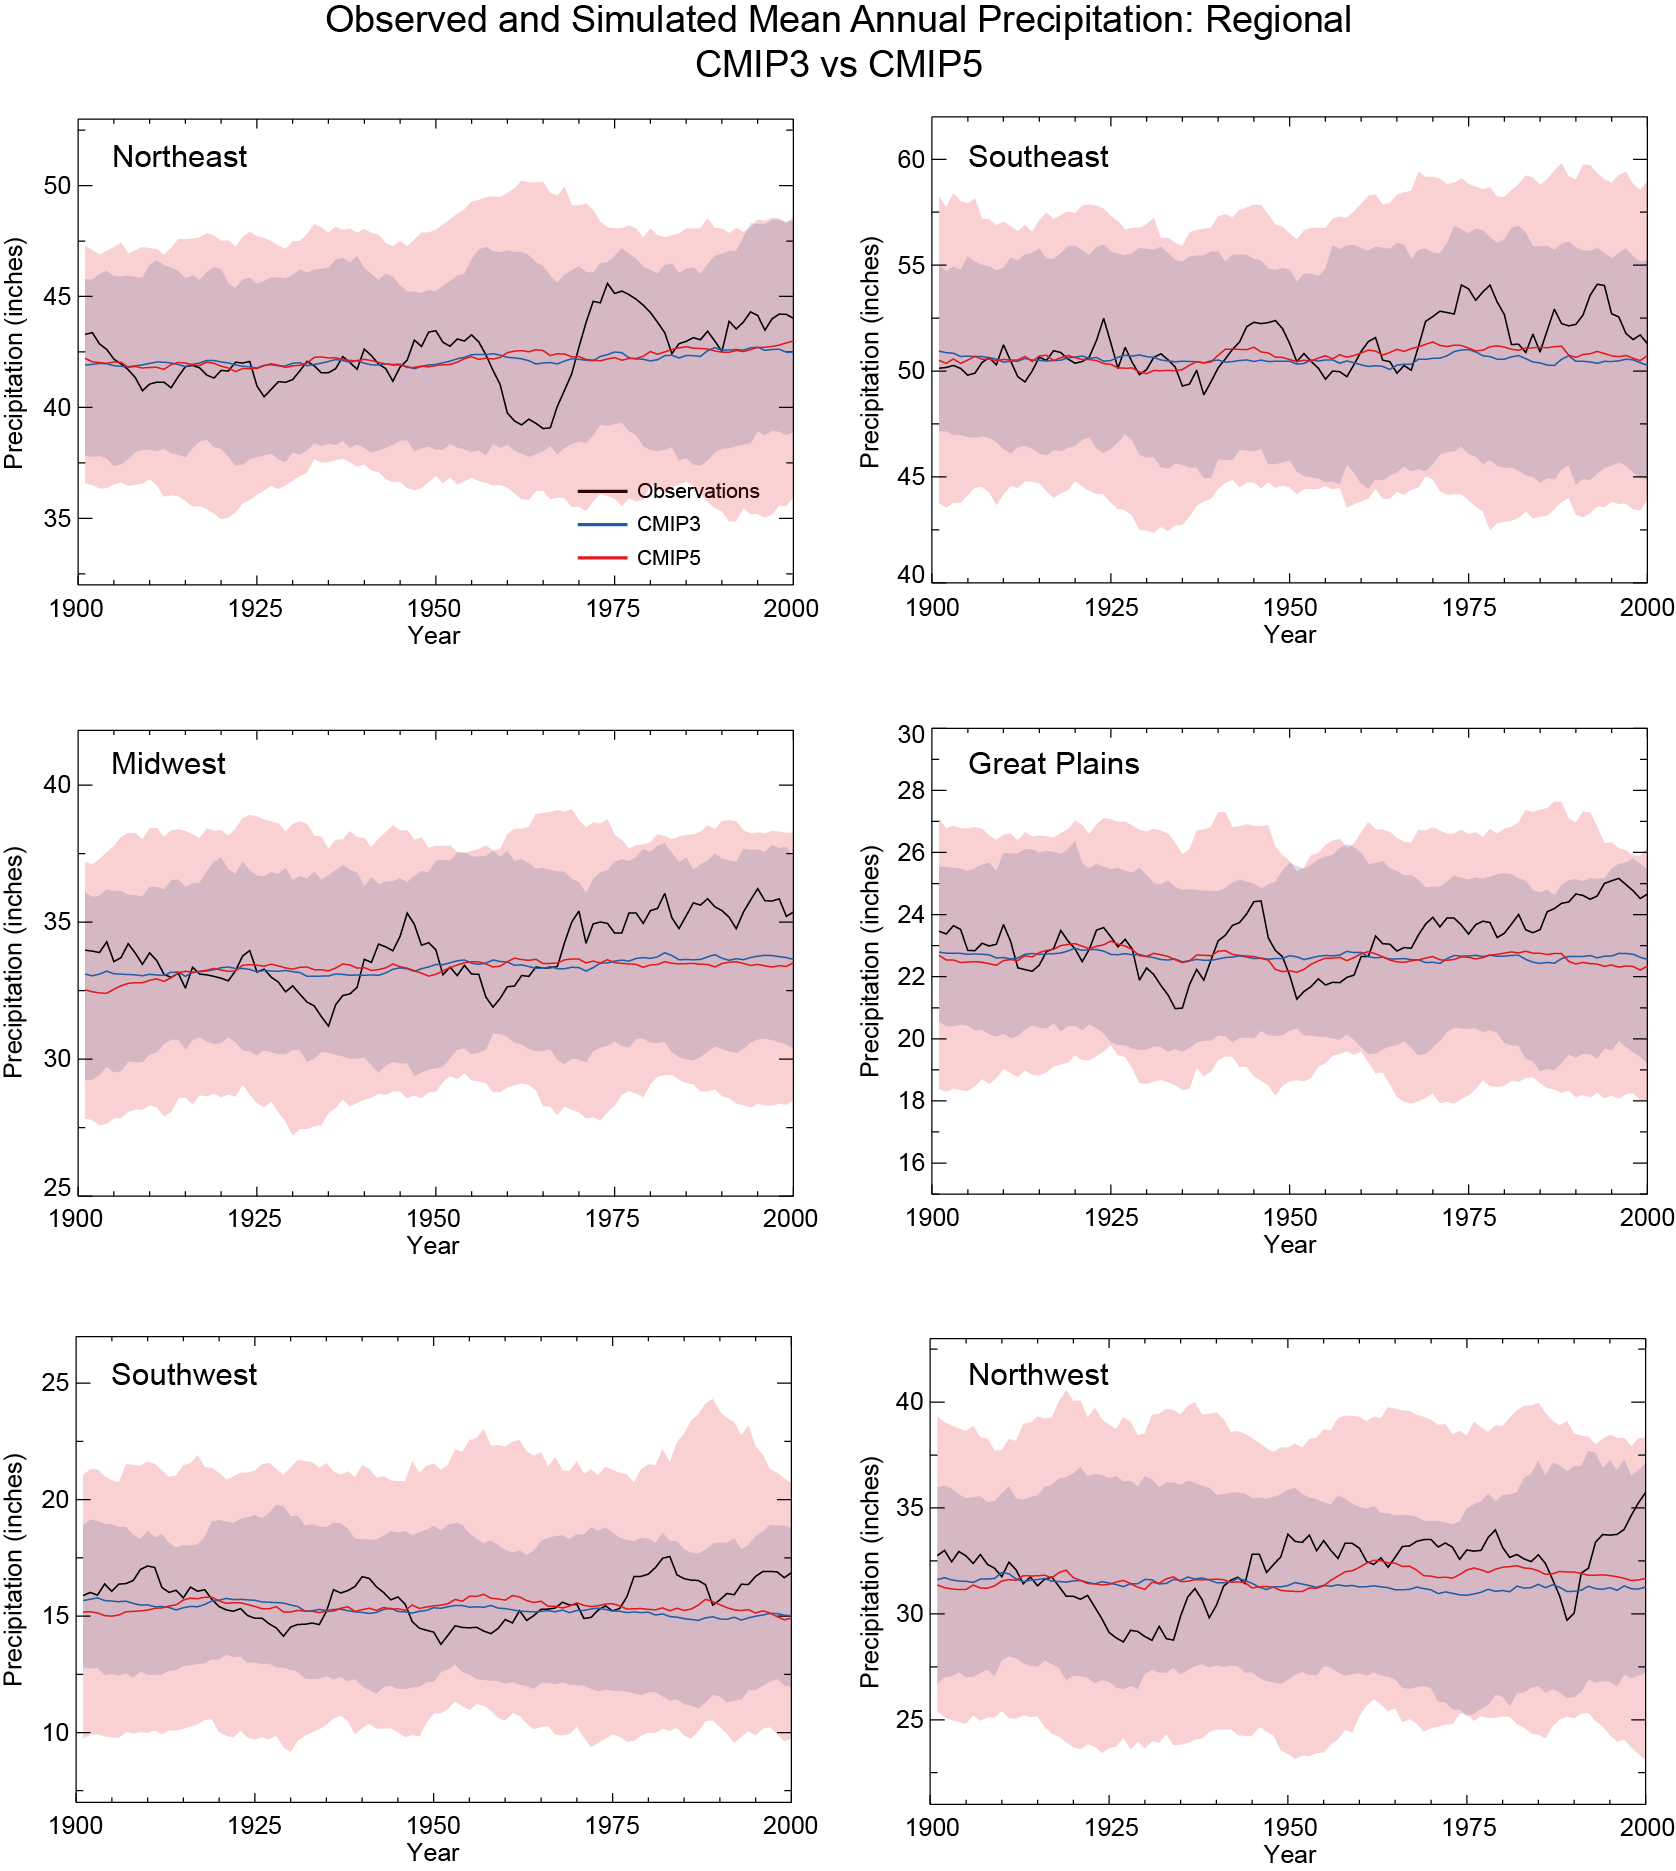
Observed and Simulated Mean Annual Precipitation: Regional; CMIP3 vs CMIP5
Observed and simulated mean annual precipitation (inches) for the six contiguous U.S. NCA regions for 1901–2000. Observational data are from NCEI’s Climate Divisional Dataset (nClimDiv, black); simulations are multi-model means from CMIP3 (blue) and CMIP5 (red). Shaded areas represent the 5–95th percentile range of the model simulations. Data are smoothed with a 10-year moving boxcar average. Note: these time series are on unique scales for each region.

