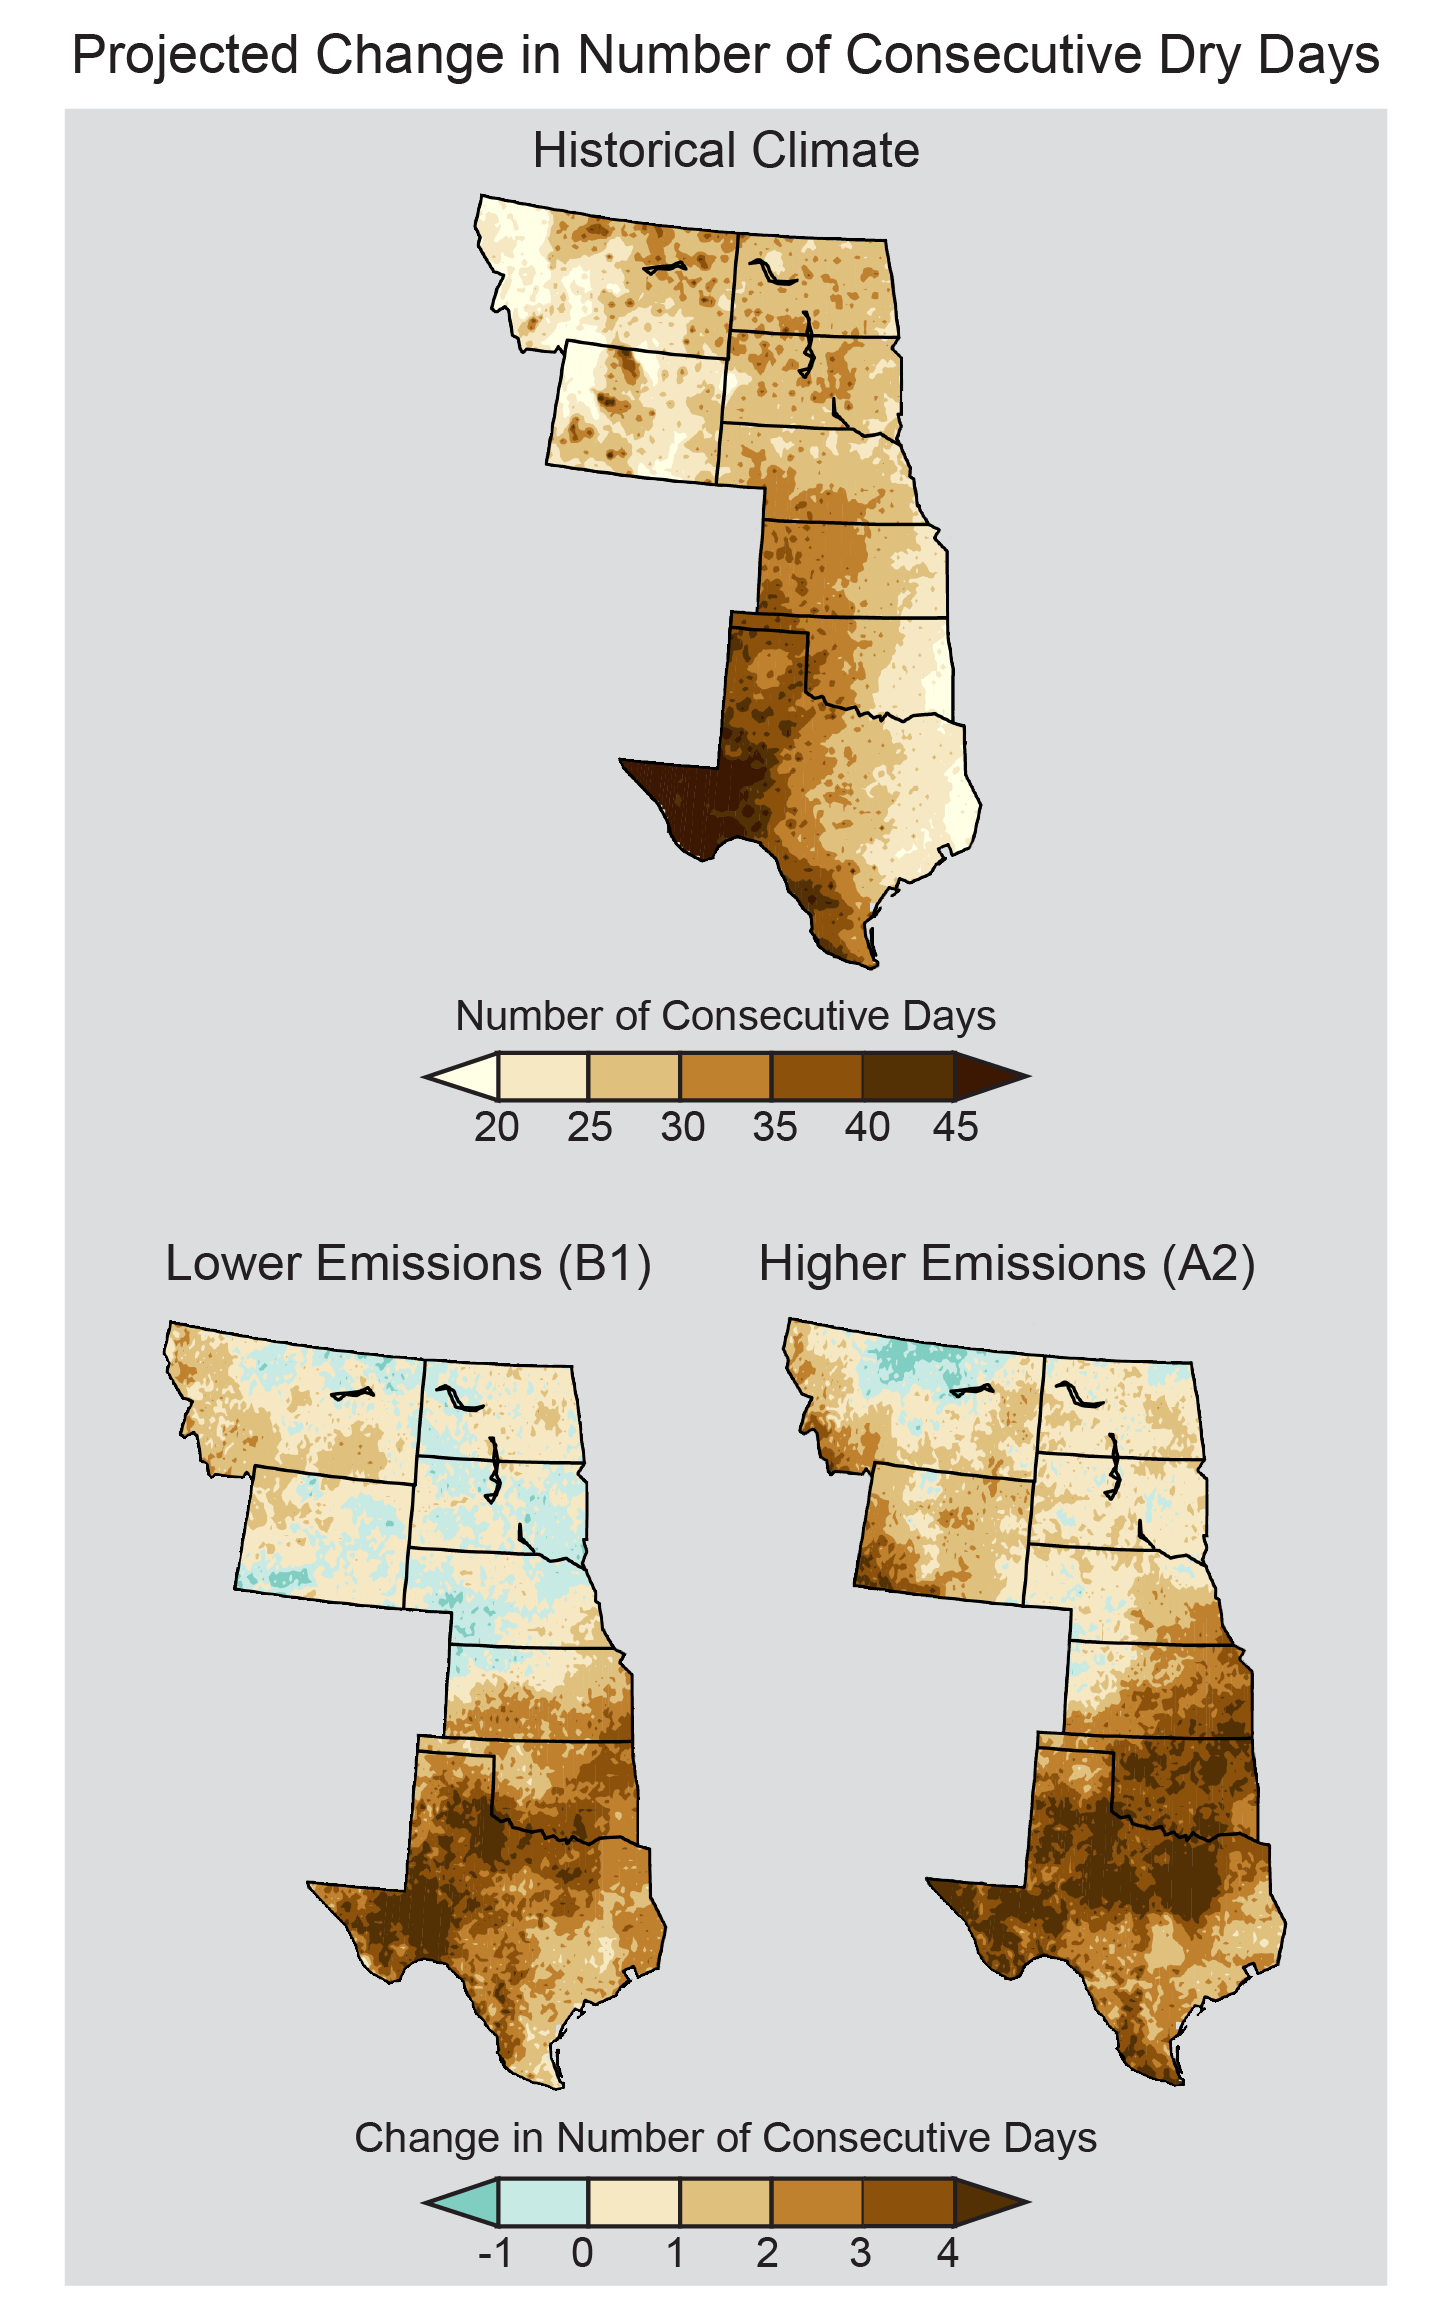
Projected Change in Number of Consecutive Dry Days
Current regional trends of a drier south and a wetter north are projected to become more pronounced by mid-century (2041-2070 as compared to 1971-2000 averages). Maps show the maximum annual number of consecutive days in which limited (less than 0.01 inches) precipitation was recorded on average from 1971 to 2000 (top), projected changes in the number of consecutive dry days assuming substantial reductions in emissions (B1), and projected changes if emissions continue to rise (A2). The southeastern Great Plains, which is the wettest portion of the region, is projected to experience large increases in the number of consecutive dry days. (Figure source: NOAA NCEI / CICS-NC).

