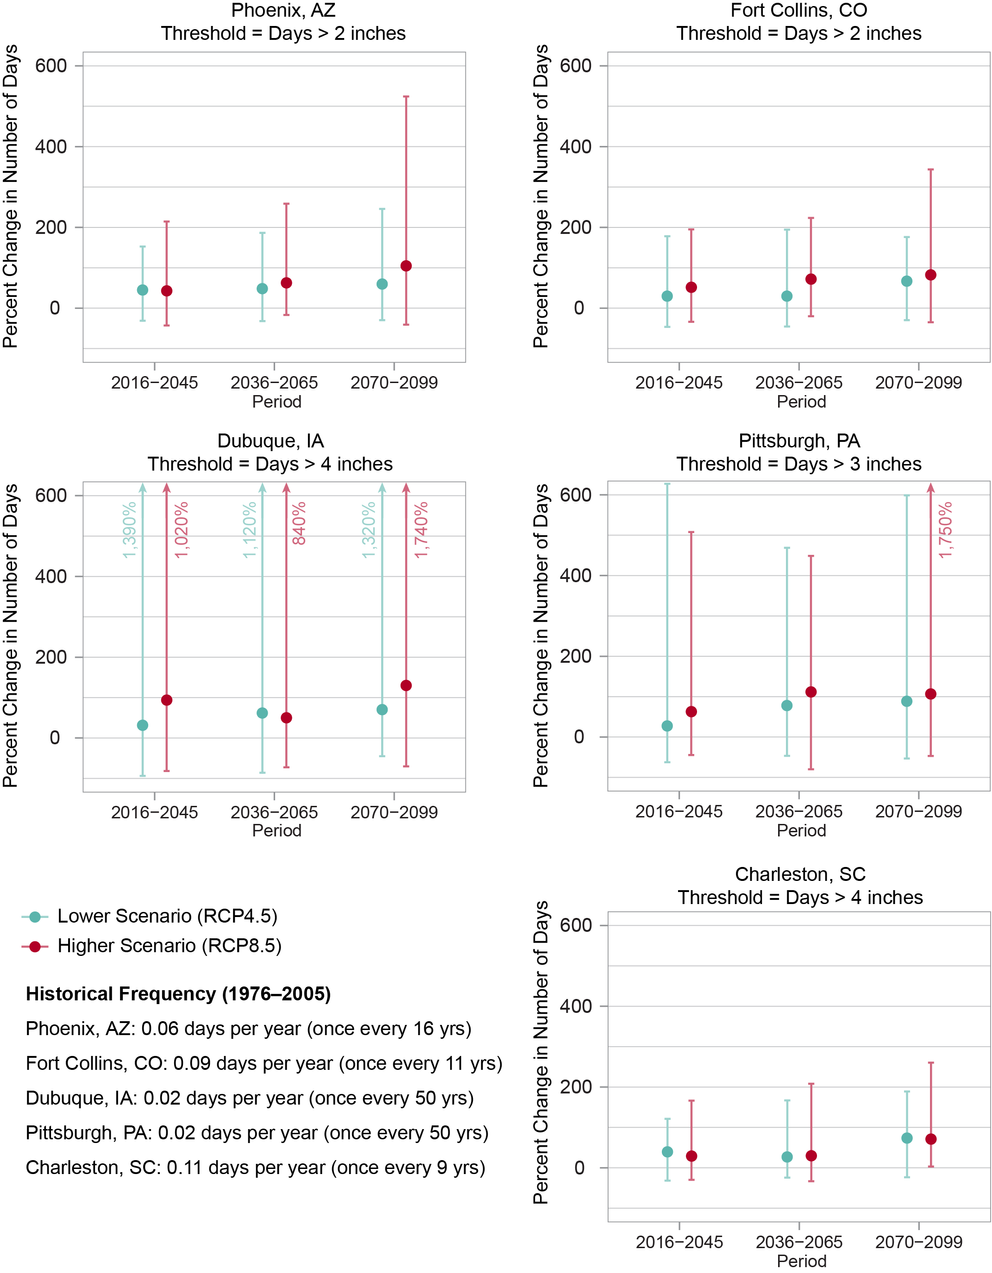
Projected Change in the Number of Days with Heavy Precipitation
Many U.S. cities are projected to see more days with heavy precipitation, increasing the risk of urban flooding, especially in areas with a lot of paved surfaces. Projections of percent changes in the number of days with heavy precipitation (compared to the 1976–2005 average) are shown for each of five U.S. cities under lower (RCP4.5) and higher (RCP8.5) scenarios. Here, days with heavy precipitation are defined as those on which the amount of total precipitation exceeds a threshold value specific to each city. Dots represent the modeled median (50th percentile) values, and the vertical bars show the range of values (5th to 95th percentile) from the models used in the analysis. Modeled historical values are shown for the same thresholds, for the period 1976–2005, in the lower left corner of the figure. Historical values are given in terms of frequency (days per year) and return period (average number of years between events). Sources: NOAA NCEI, CICS-NC, and LMI.

