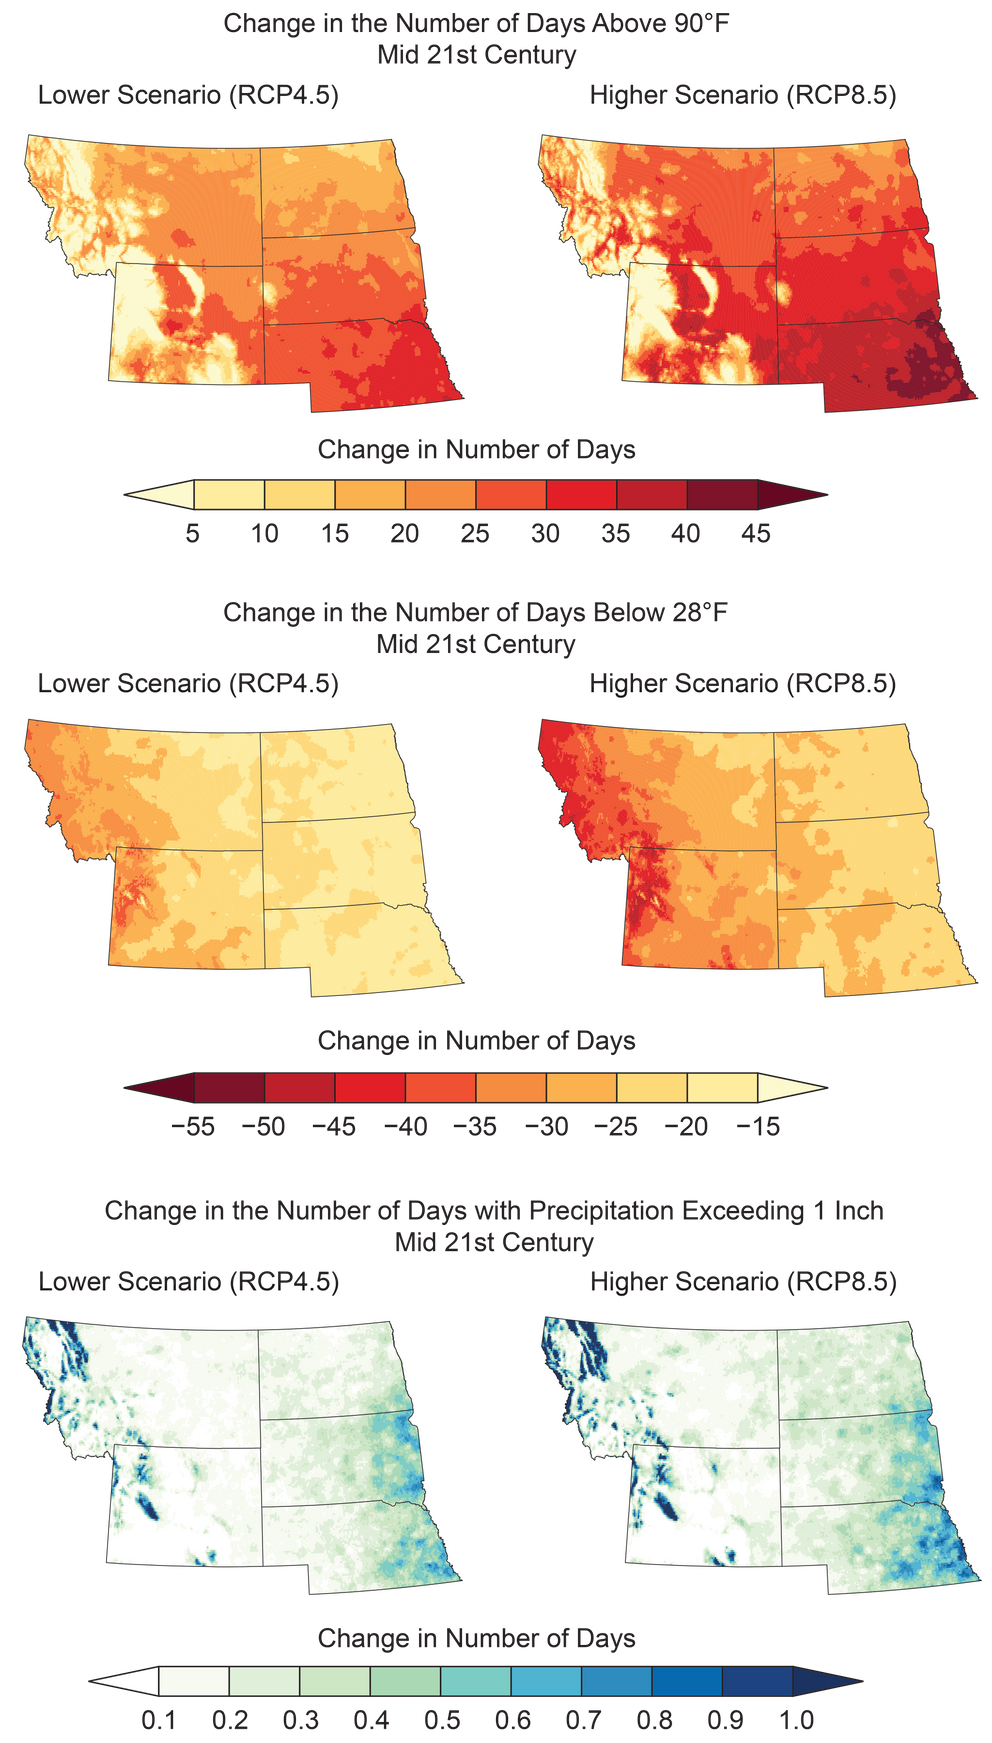
Projected Changes in Very Hot Days, Cool Days, and Heavy Precipitation
Projected changes are shown for (top) the annual number of very hot days (days with maximum temperatures above 90°F, an indicator of crop stress and impacts on human health), (middle) the annual number of cool days (days with minimum temperatures below 28°F, an indicator of damaging frost), and (bottom) heavy precipitation events (the annual number of days with greater than 1 inch of rainfall; areas in white do not normally experience more than 1 inch of rainfall in a single day). Projections are shown for the middle of the 21st century (2036–2065) as compared to the 1976–2005 average under the lower and higher scenarios (RCP4.5 and RCP8.5). Sources: NOAA NCEI and CICS-NC.

