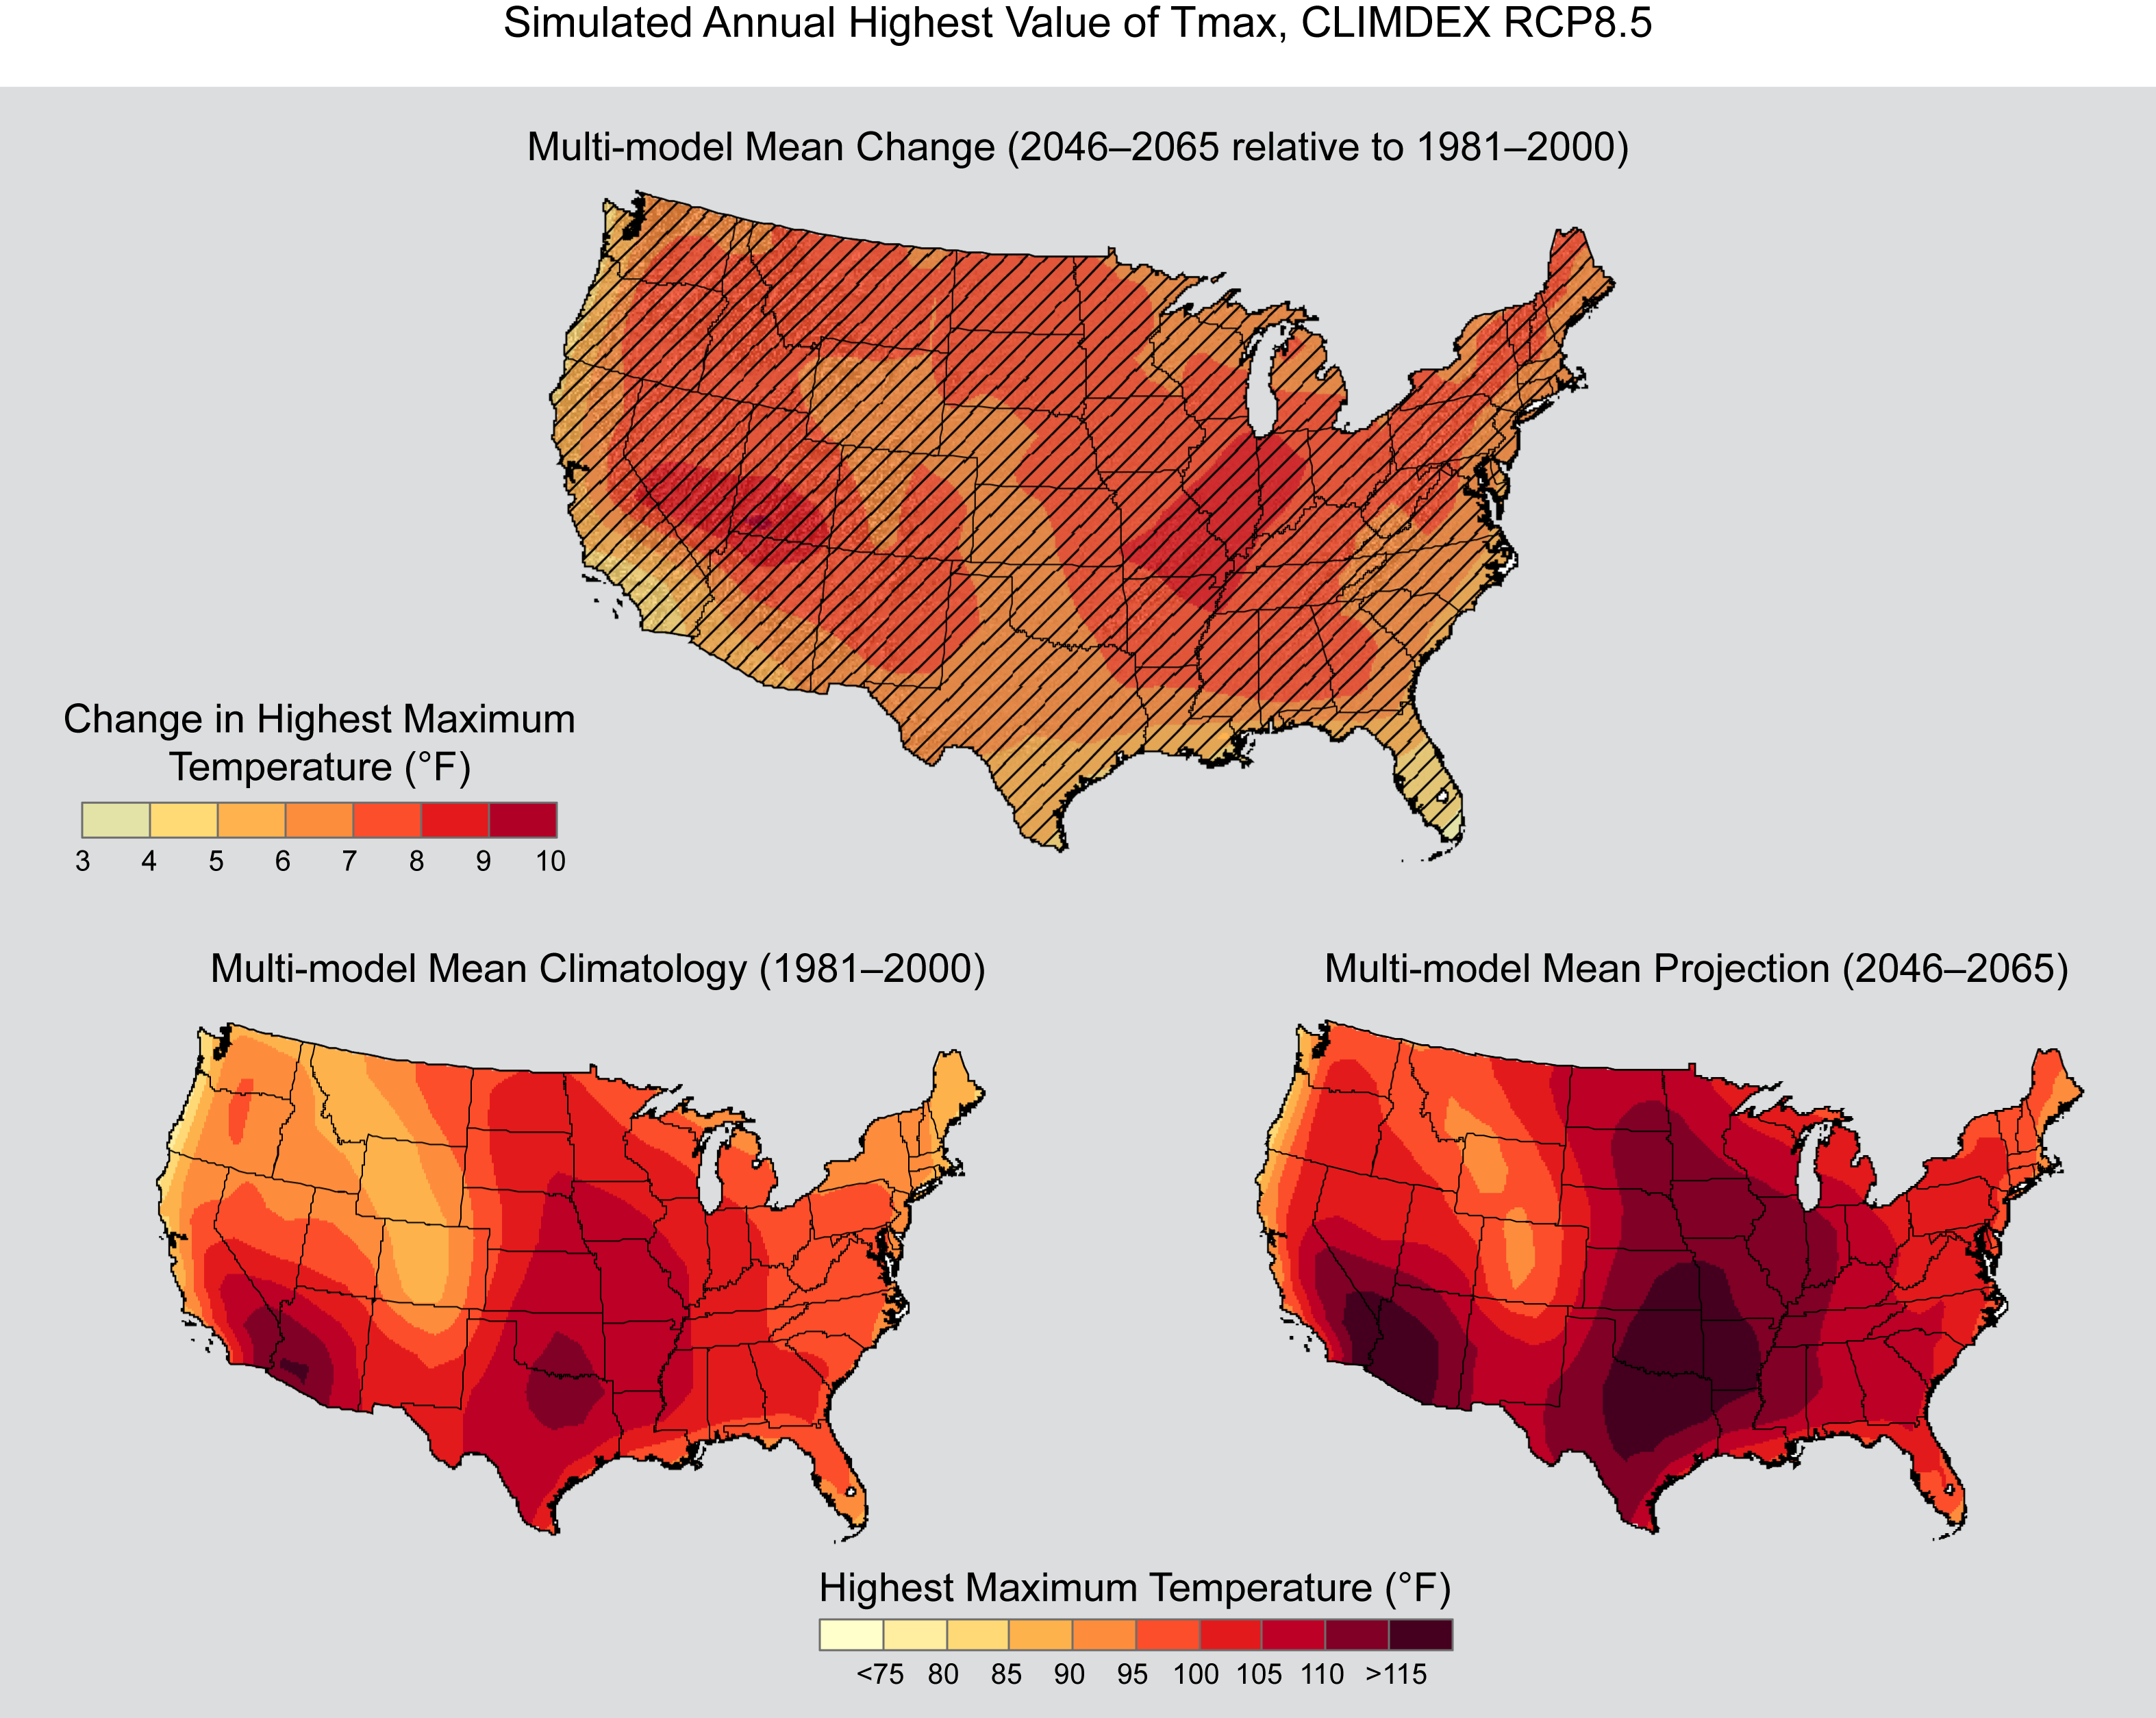
Simulated Annual Highest Value of Tmax, CLIMDEX RCP8.5
Simulated multi-model mean change in the annual highest value of daily maximum temperature (TXx) for the contiguous United States, for 2046–2065 with respect to the reference period of 1981–2000, using the CLIMDEX RCP8.5 scenario (top). Color with hatching (category 3) indicates that more than 50% of the models show a statistically significant change, and more than 67% agree on the sign of the change (see Section 3). Multi-model mean climatology indicating the TXx for 1981–2000 (bottom left). Multi-model mean projection indicating the TXx for 2046–2065 (bottom right).

