Simulated Annual Longest Dry Spell, CLIMDEX RCP8.5
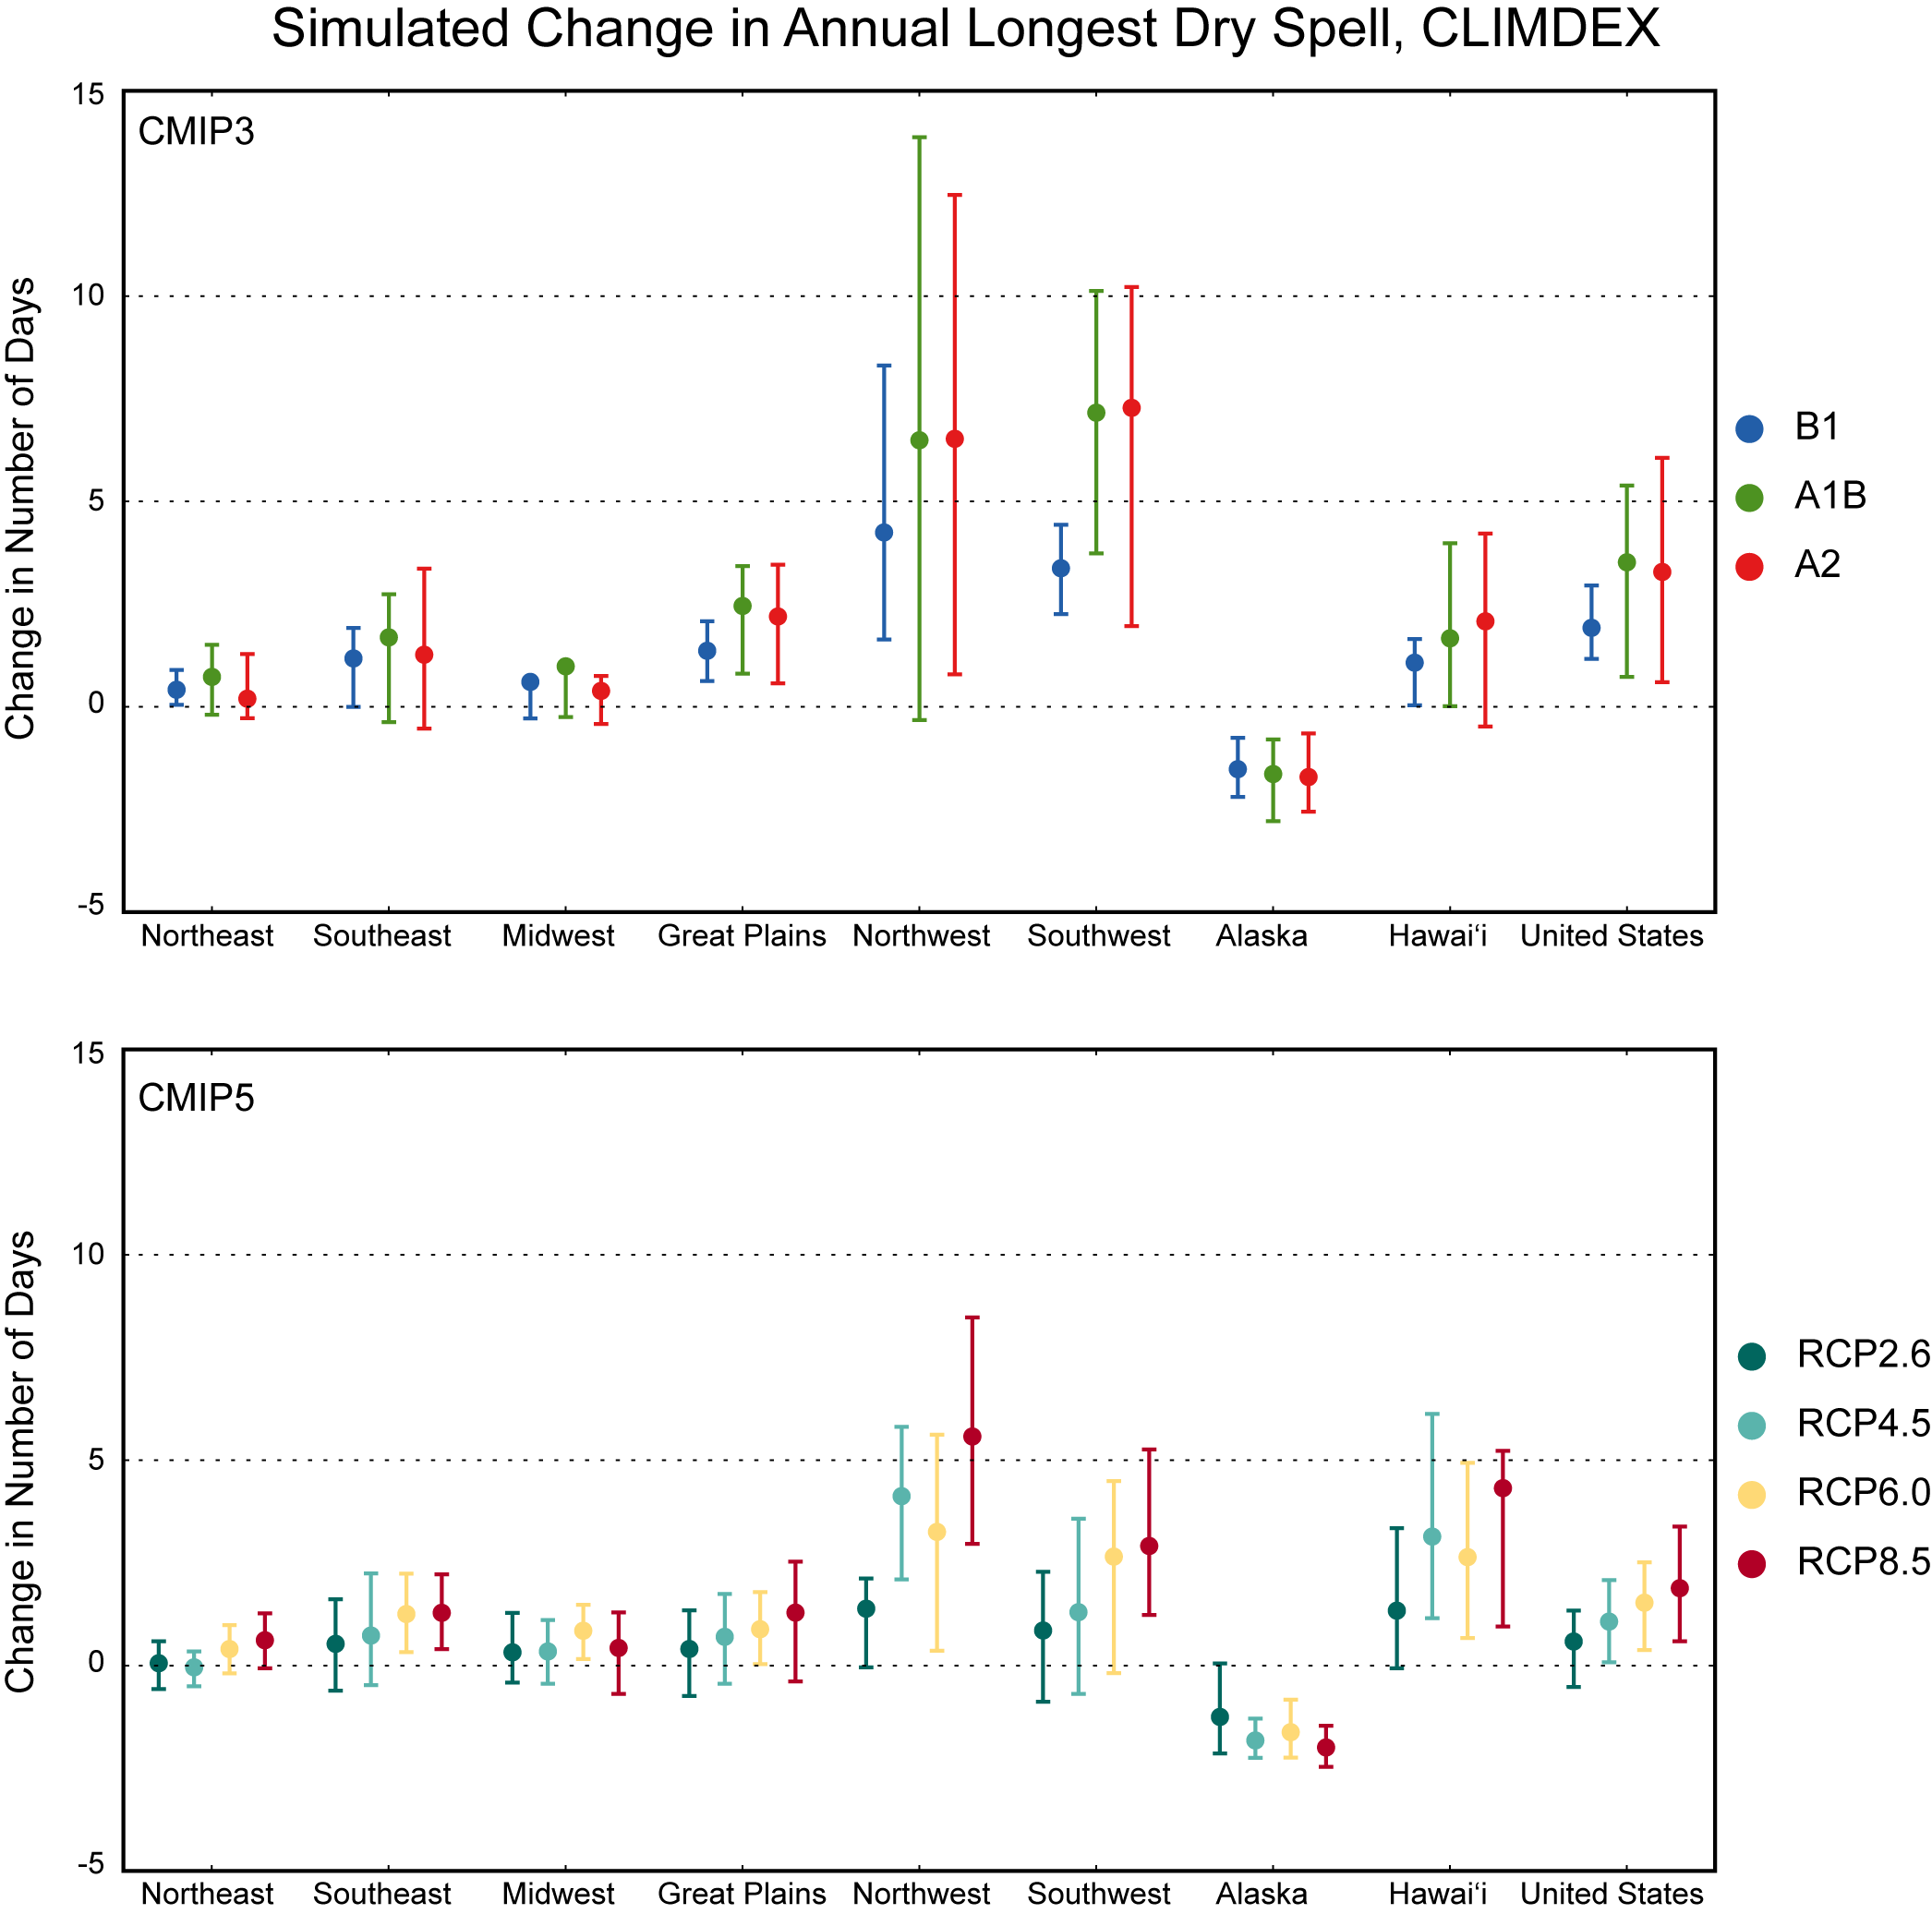
Simulated change in the annual maximum number of consecutive dry days (CDD) for each region and the contiguous United States, for 2046–2065 with respect to the reference period of 1981–2000. The upper panel shows values for the CLIMDEX SRES B1 (blue), A1B (green), and A2 (red) scenarios. The lower panel shows values for the CLIMDEX RCP2.6 (dark teal), 4.5 (light teal), 6.0 (yellow), and 8.5 (dark red) scenarios. Bars indicate the interquartile ranges of model values and circles depict the multi-model means.

