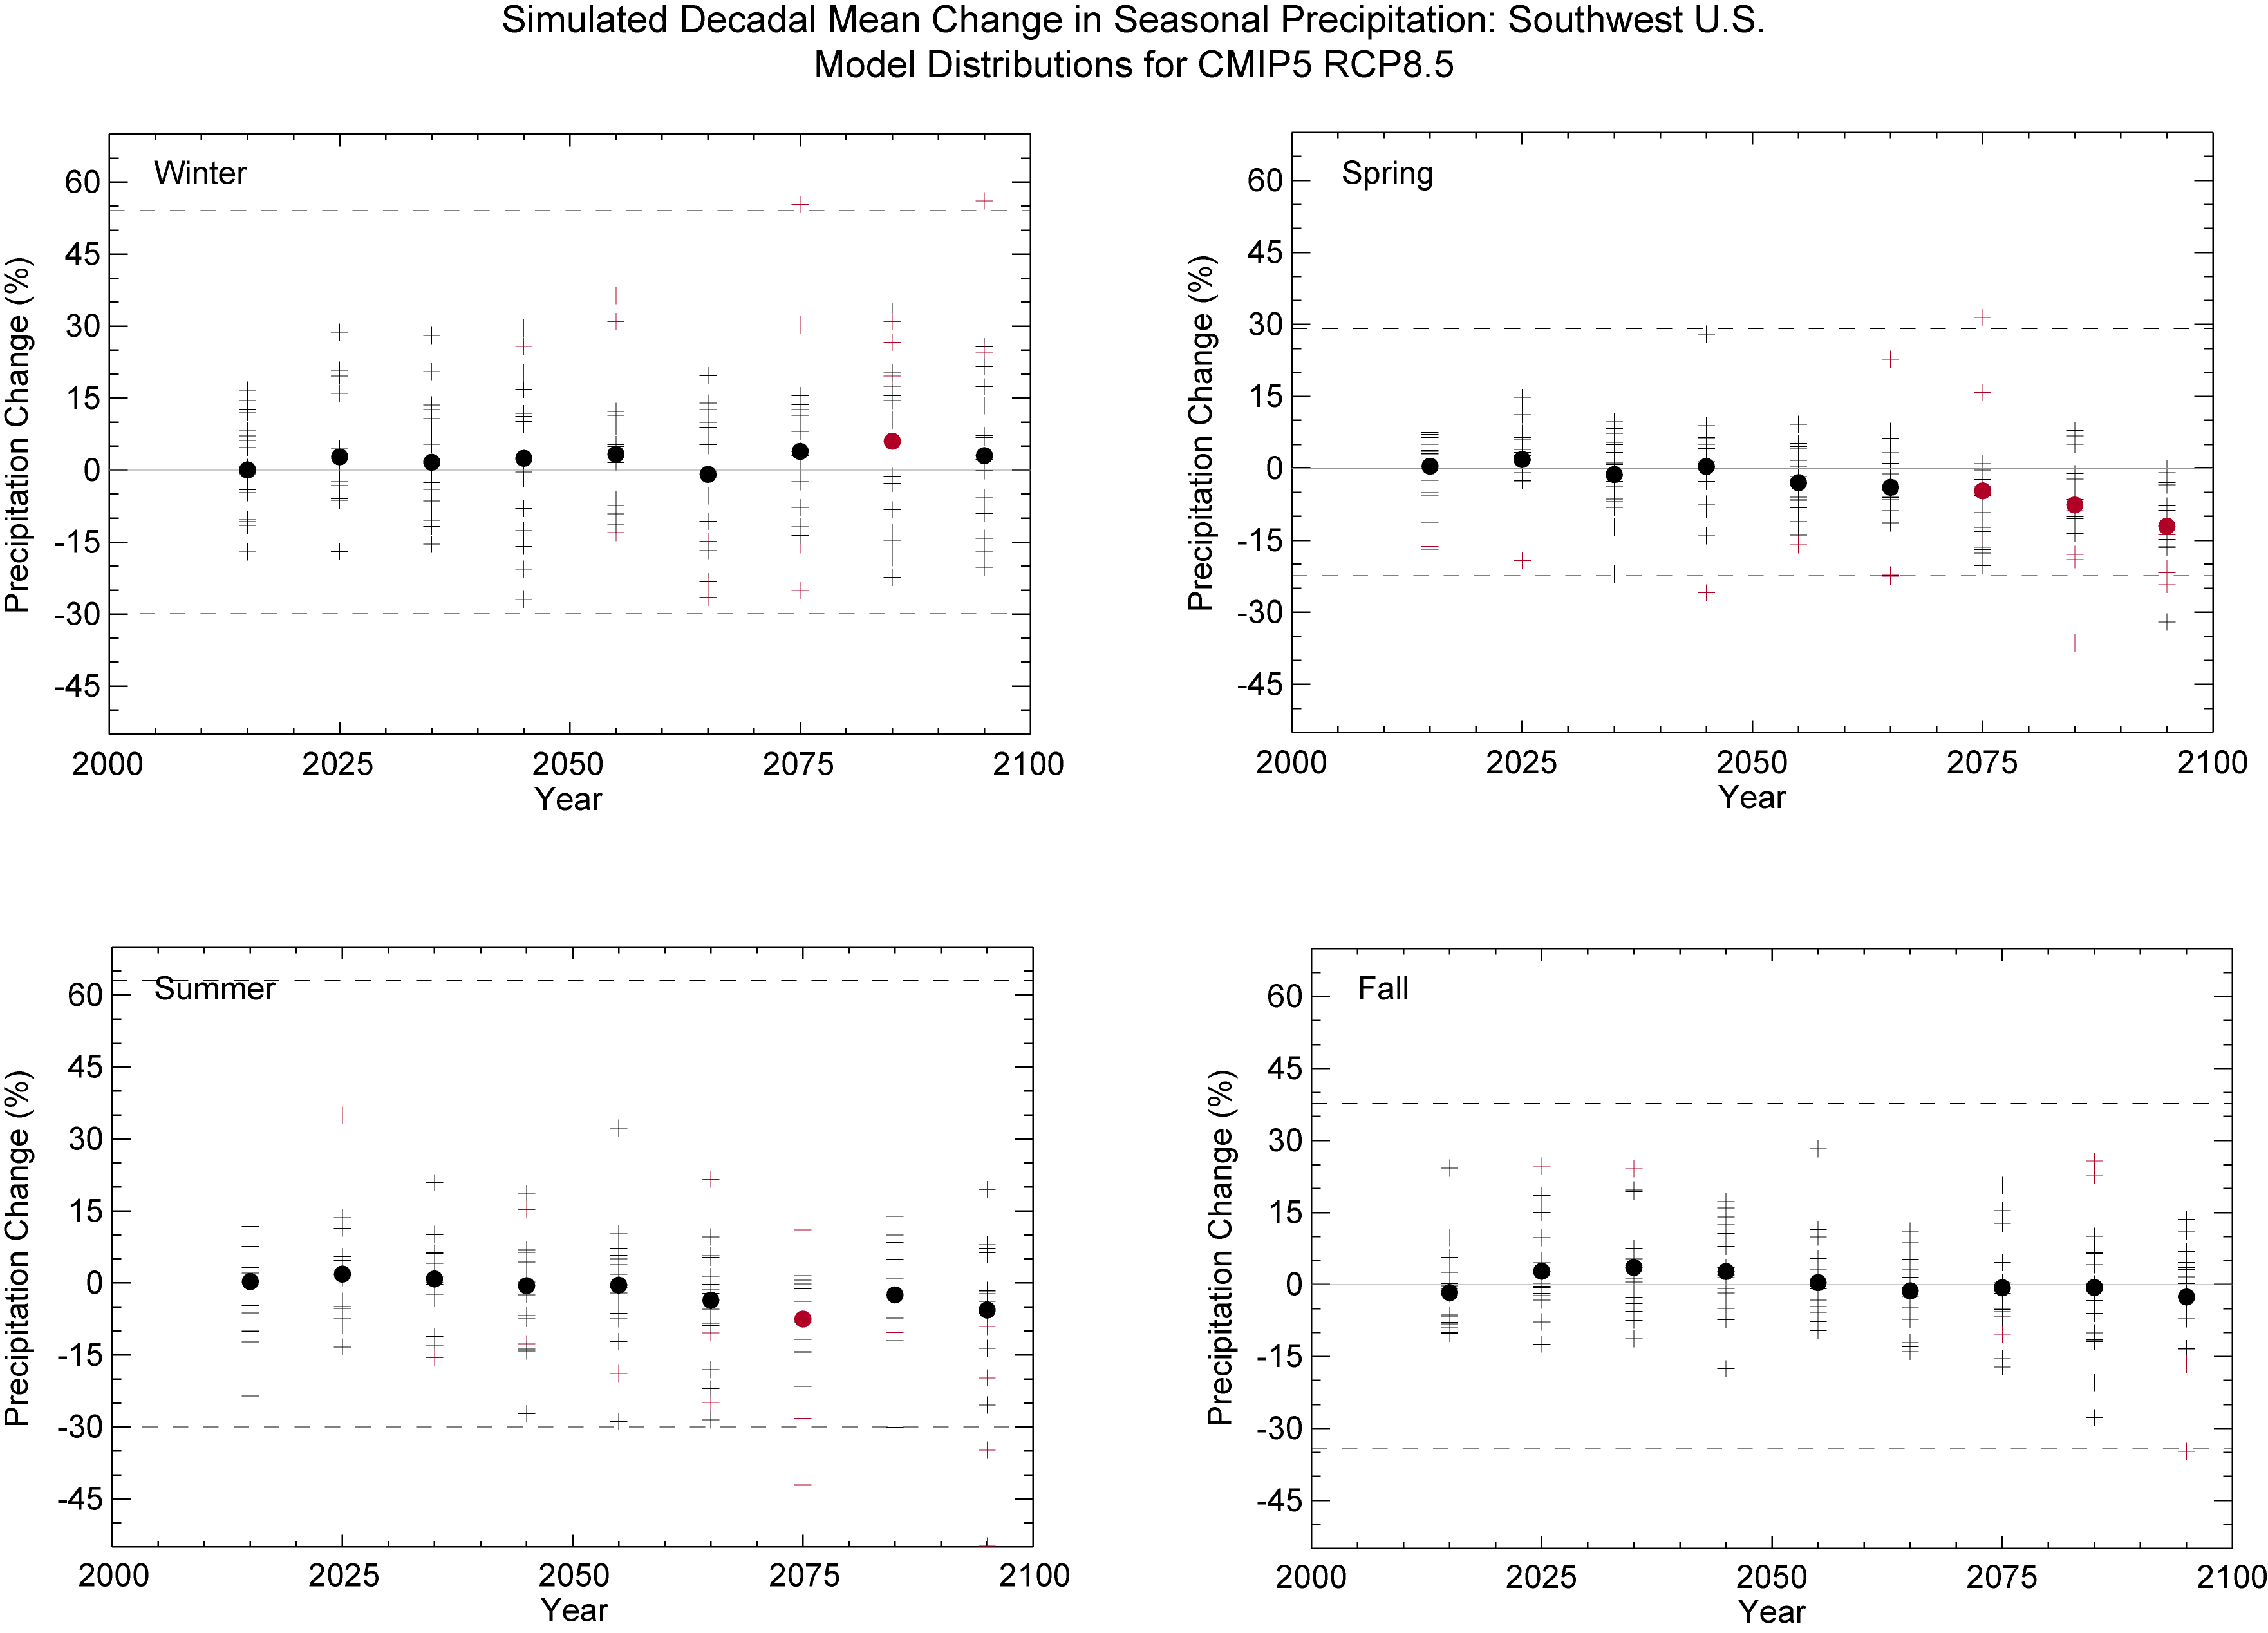
Simulated Decadal Mean Change in Seasonal Precipitation: Southwest U.S.
Model Distributions for CMIP5 RCP8.5
Model distributions of simulated decadal mean change in seasonal precipitation (%) for the Southwest United States, for each future decadal time period (represented by their approximate midpoints, e.g., 2015 = 2011–2020), with respect to the reference period of 2001–2010. Values are given for each of the CMIP5 RCP scenario. Each individual model is represented by a plus sign (+), with circles depicting the multi-model means. These symbols are shown in color if the value is statistically significant at the 95% confidence level. Dashed lines indicate the 10th and 90th percentiles of observed precipitation anomaly values from 1981–2010.

