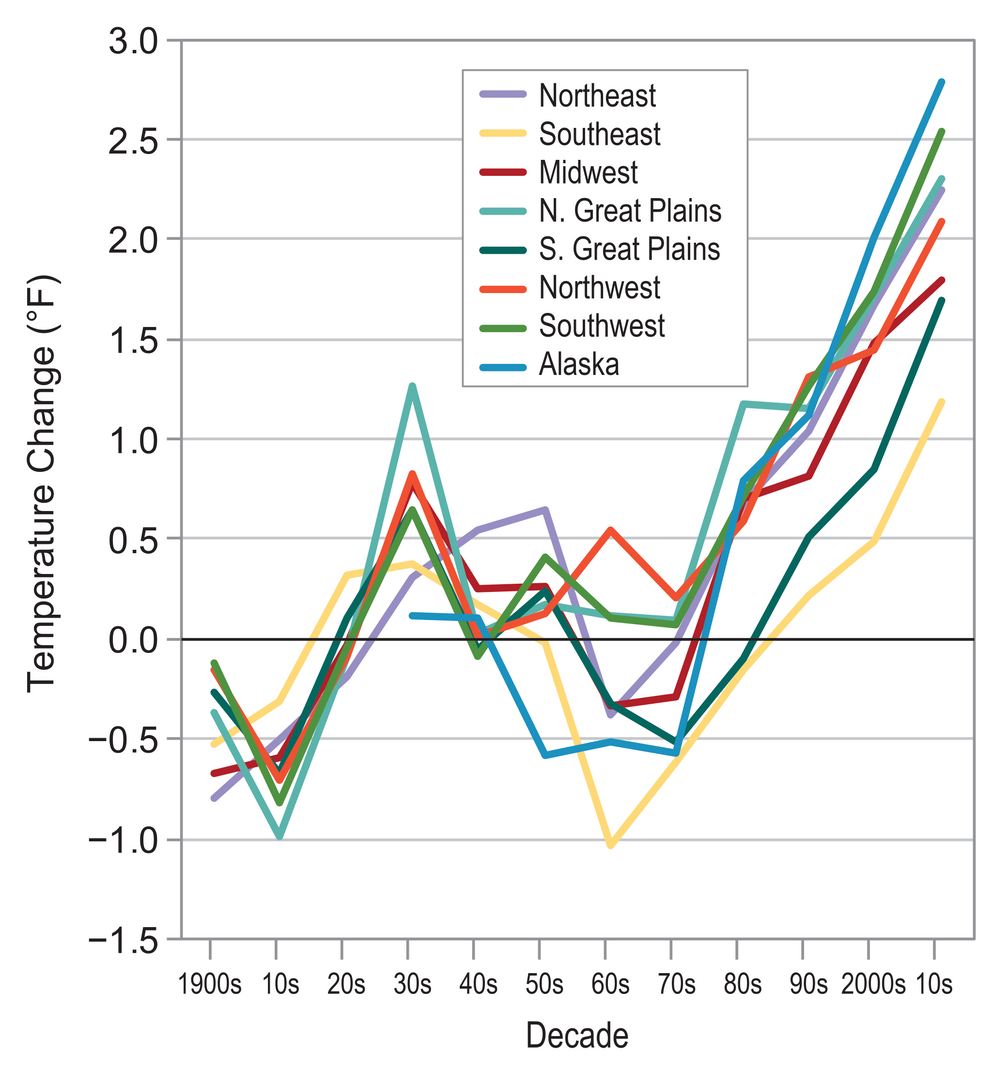
Temperature Change Varies by Region
This graph shows changes in decadal-averaged temperature relative to the 1901–1960 average for eight of the ten NCA regions (see Front Matter, Figure 1). This figure shows how regional temperatures can be quite variable from decade to decade. All regions, however, have experienced warming over the last three decades or more. The most recent decade, the 2010s, refers to the 6-year period of 2001–2016. Source: adapted from Walsh et al. 2014.{{< tbib '6' 'ee2ad491-9e02-4f29-859a-07970e4d1de1' >}} Comparable data is not currently available for the Hawaiʻi and U.S-Affiliated Pacific Islands or U.S. Caribbean regions.

