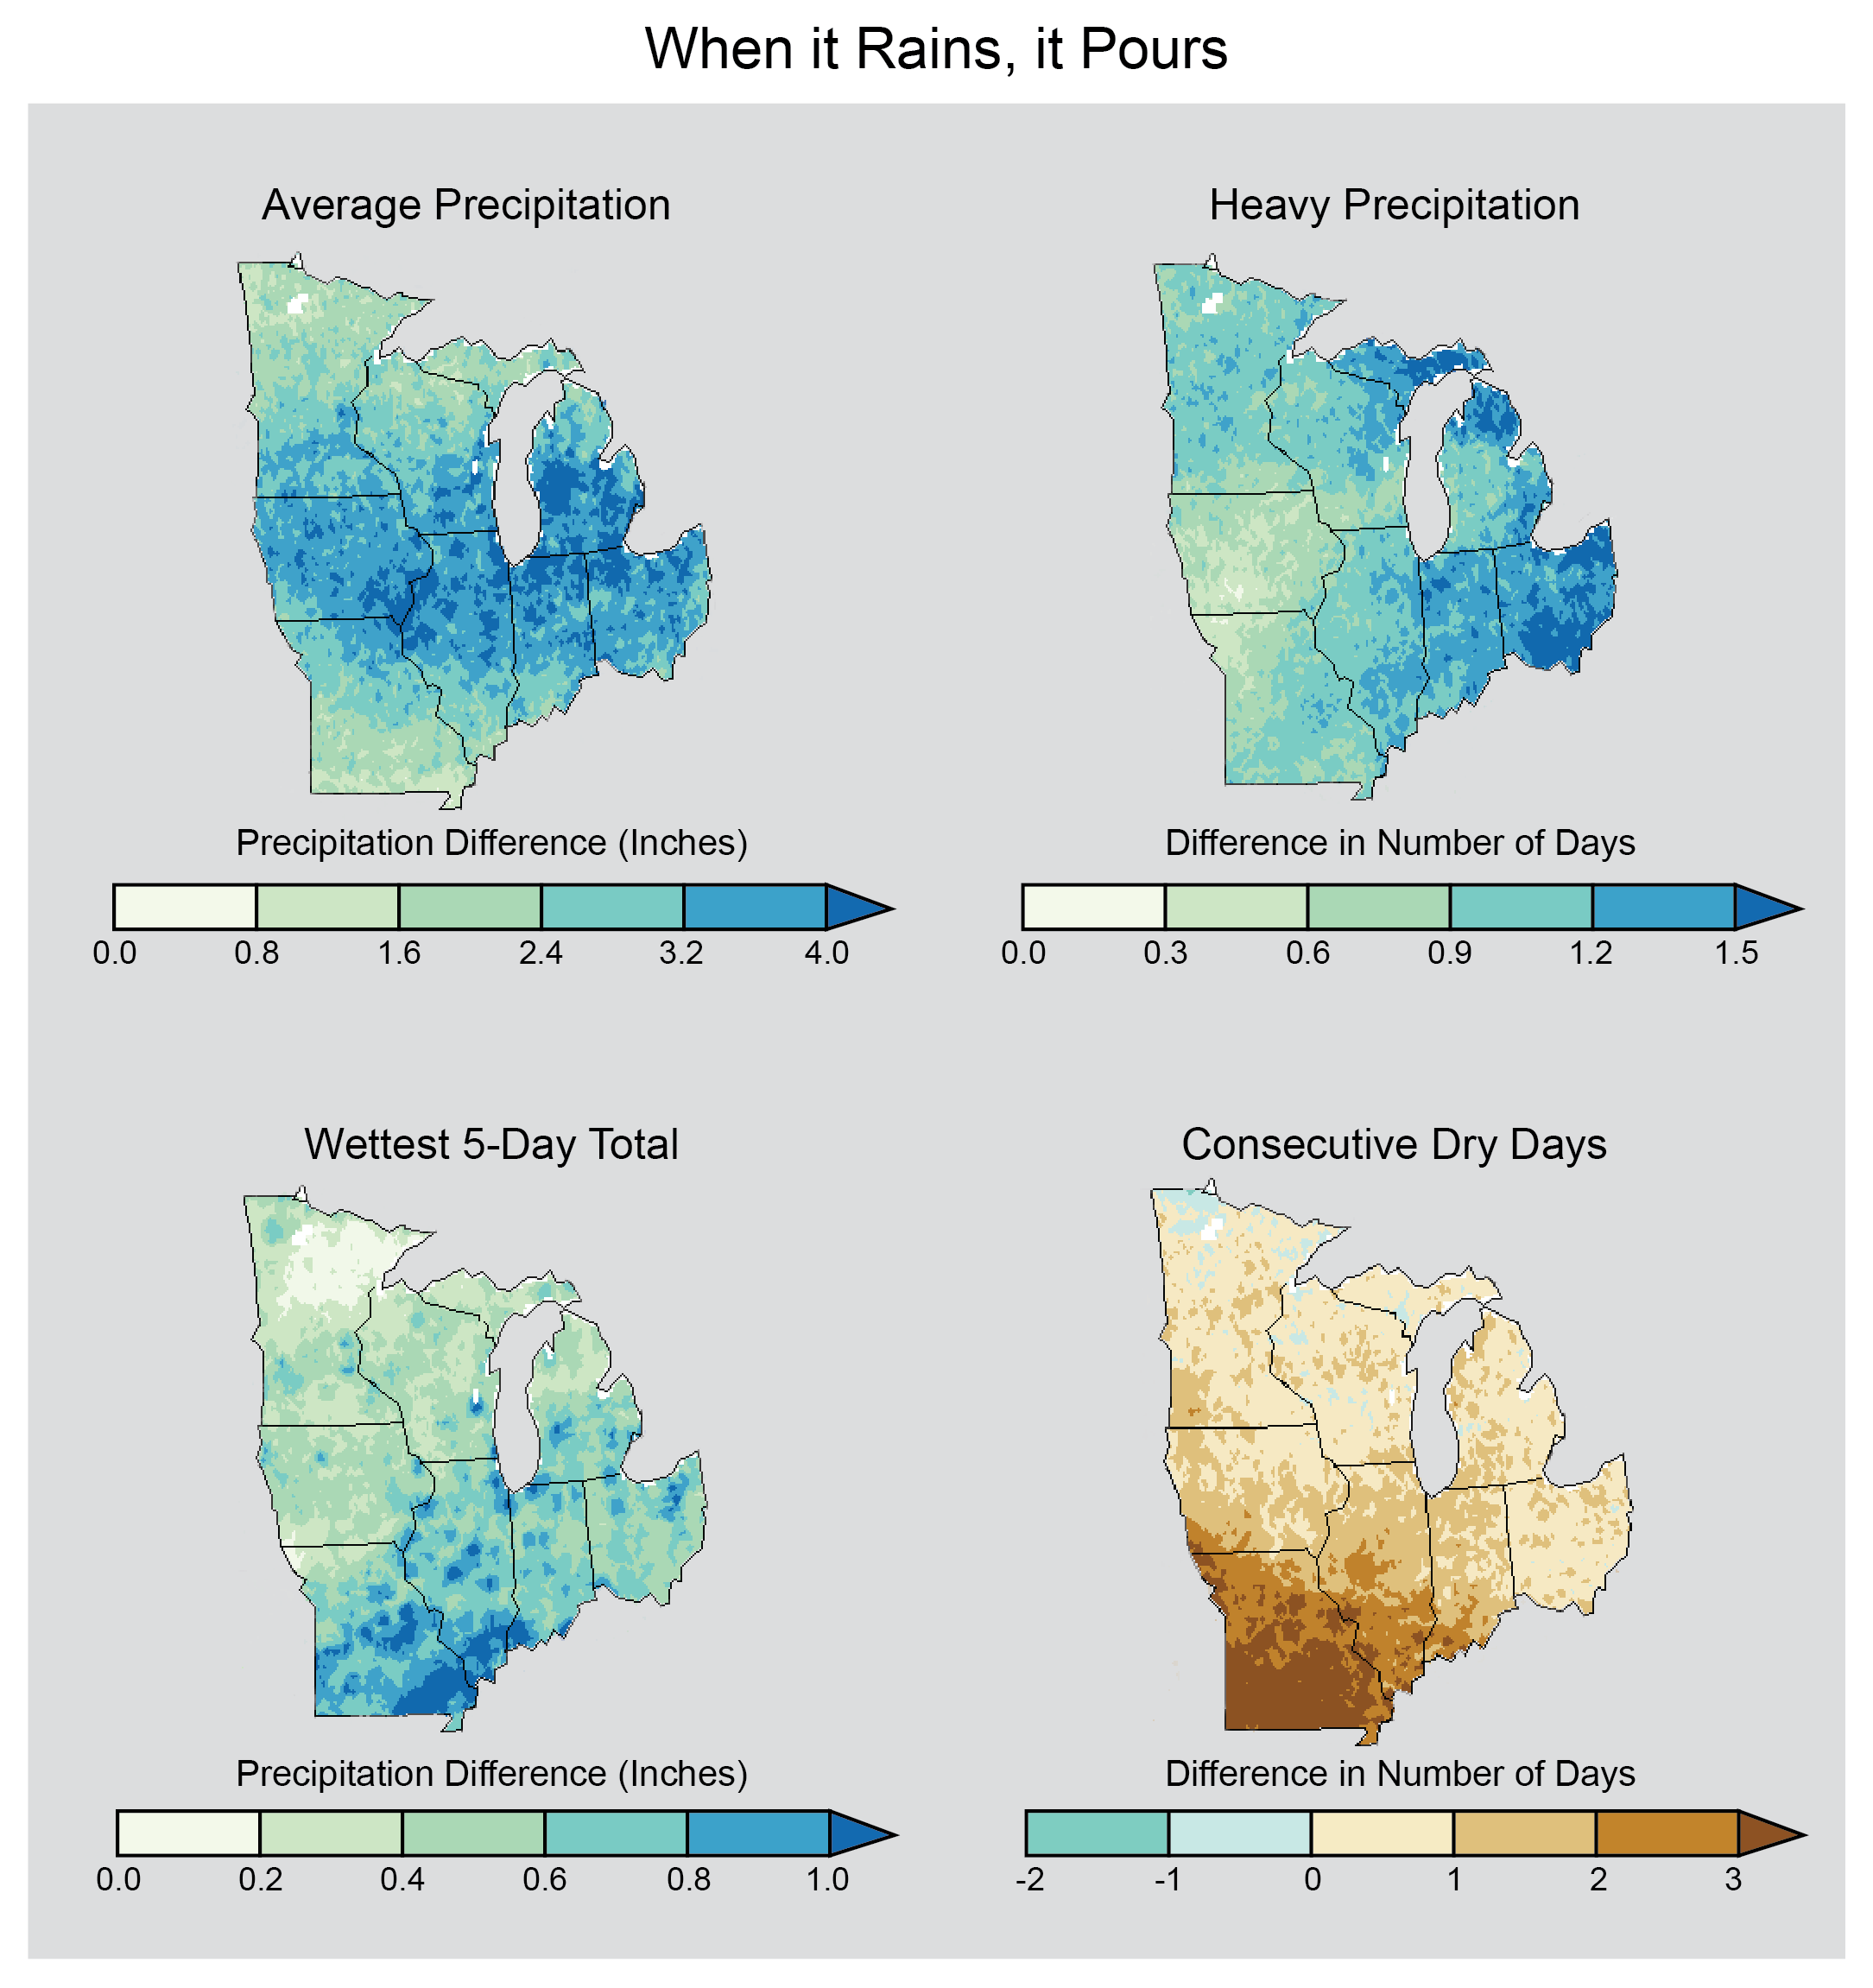
When it Rains, it Pours
Precipitation patterns affect many aspects of life, from agriculture to urban storm drains. These maps show projected changes for the middle of the current century (2041-2070) relative to the end of the last century (1971-2000) across the Midwest under continued emissions (A2 scenario). Top left: the changes in total annual average precipitation. Across the entire Midwest, the total amount of water from rainfall and snowfall is projected to increase. Top right: increase in the number of days with very heavy precipitation (top 2% of all rainfalls each year). Bottom left: increases in the amount of rain falling in the wettest 5-day period over a year. Both (top right and bottom left) indicate that heavy precipitation events will increase in intensity in the future across the Midwest. Bottom right: change in the average maximum number of consecutive days each year with less than 0.01 inches of precipitation. An increase in this variable has been used to indicate an increase in the chance of drought in the future. (Figure source: NOAA NCEI / CICS-NC).

