The TSU provides scientific and technical expertise in support of the development of National Climate Assessments and other reports, as well as related products, tools, and services.
The multidisciplinary nature of our work involves close cooperation and integration across the entire TSU, but our expertise and functions are broadly organized into the following teams:
- A science team engaged in cutting-edge climate research provides much of the foundational science on observed and projected climate changes that inform assessment activities. The Lead Senior Scientist provides scientific oversight for the development of NOAA’s assessment services and helps coordinate and implement distributed and centralized high-resolution modeling capabilities.
- A science communications team provides scientific writing, editorial, graphic design, and report production expertise to facilitate the development of content and the delivery of printed and electronic versions of assessment products
- A software engineering and web development team provides advanced web design and development services, computationally intensive analyses of climate data and model outputs, and a range of web-based tools and reports.
- A data team, led by a data architect who oversees data management activities, ensures the data provenance, tracking, and transparency required for scientific reports categorized as Highly Influential Scientific Assessments.
The TSU staff also has significant project management expertise, with many years of collective experience helping coordinate and manage complex, multiyear assessment development cycles.
Some of our skills are highlighted on our Expertise: Climate Assessments page.
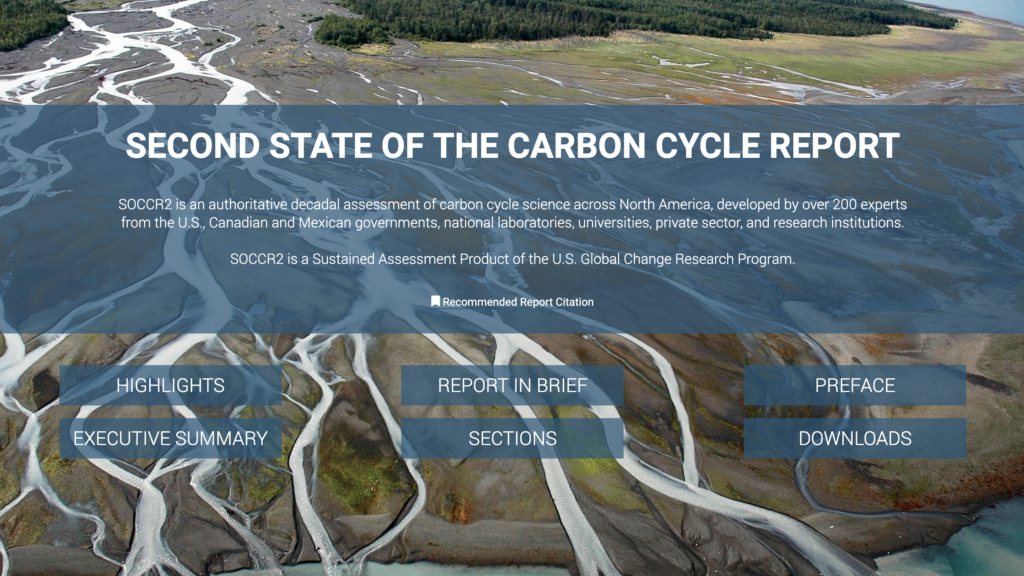
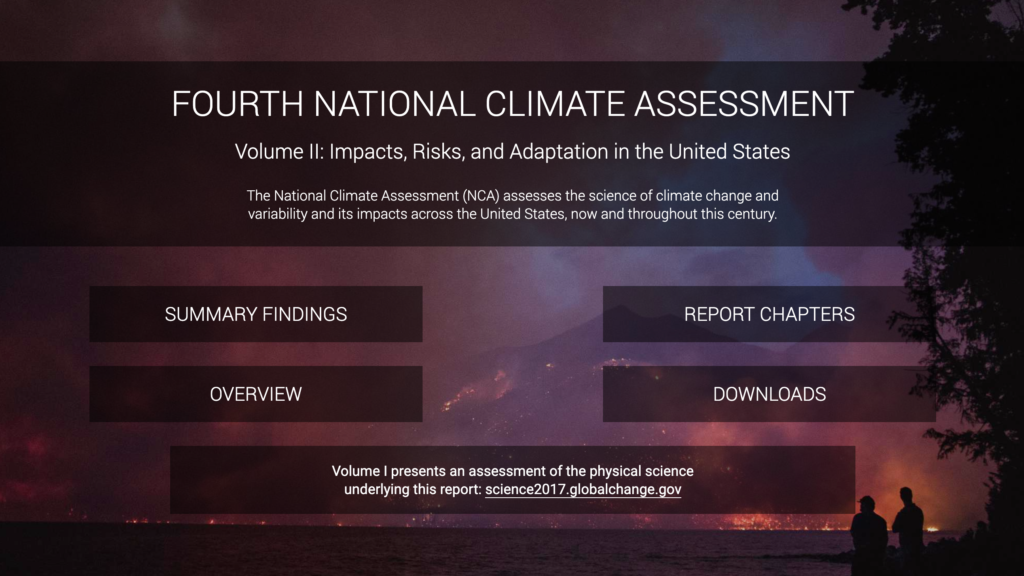
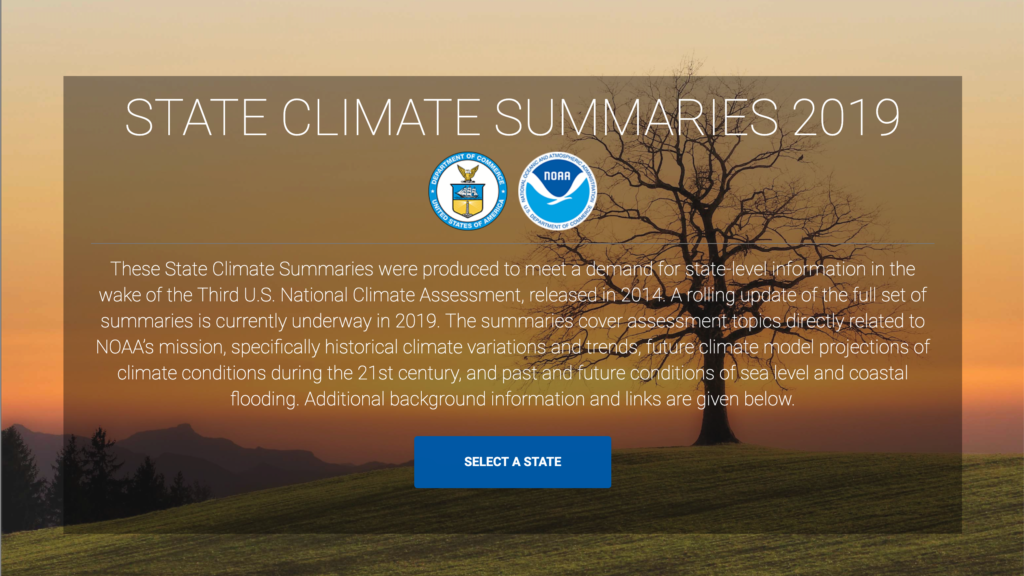
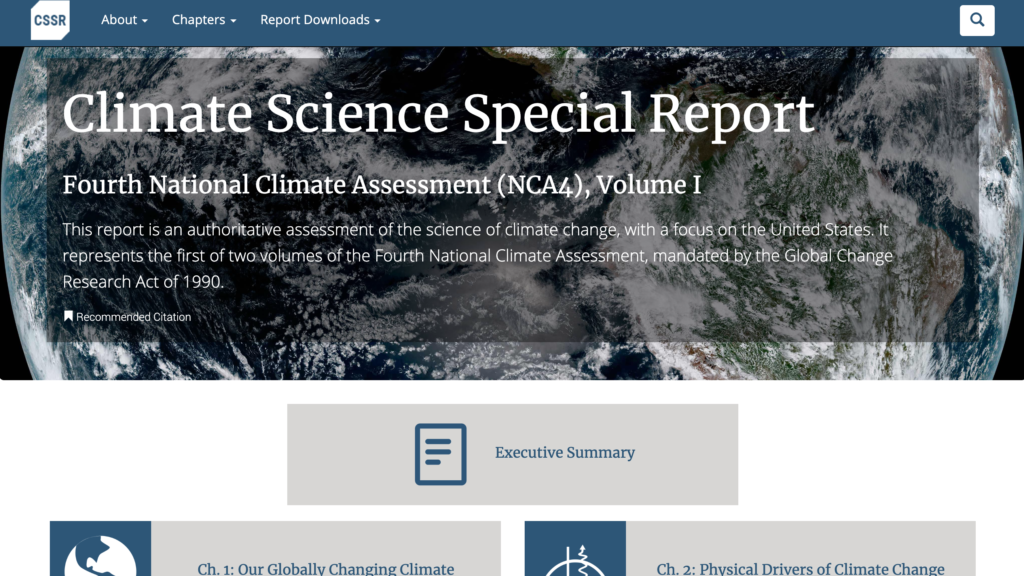
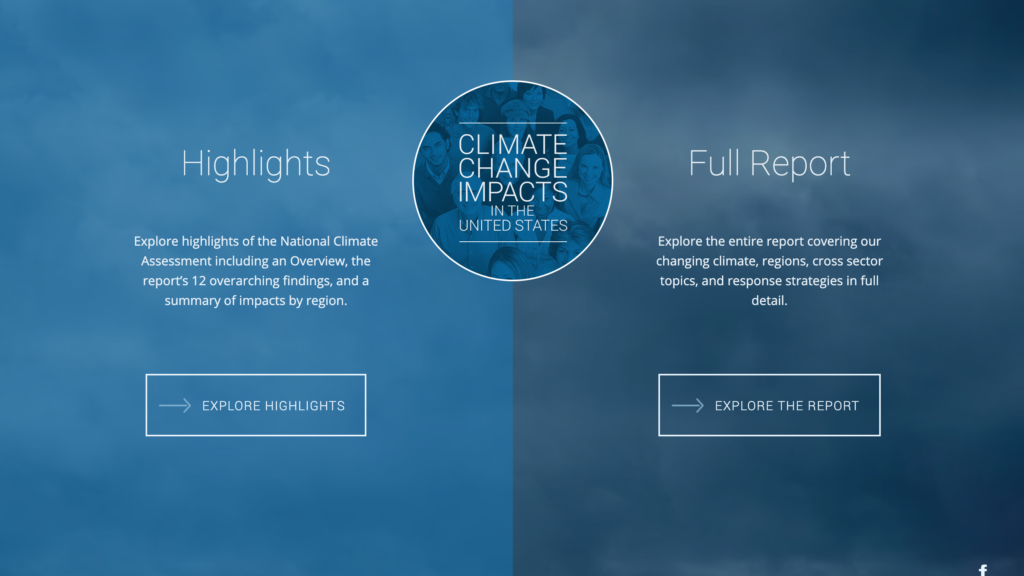
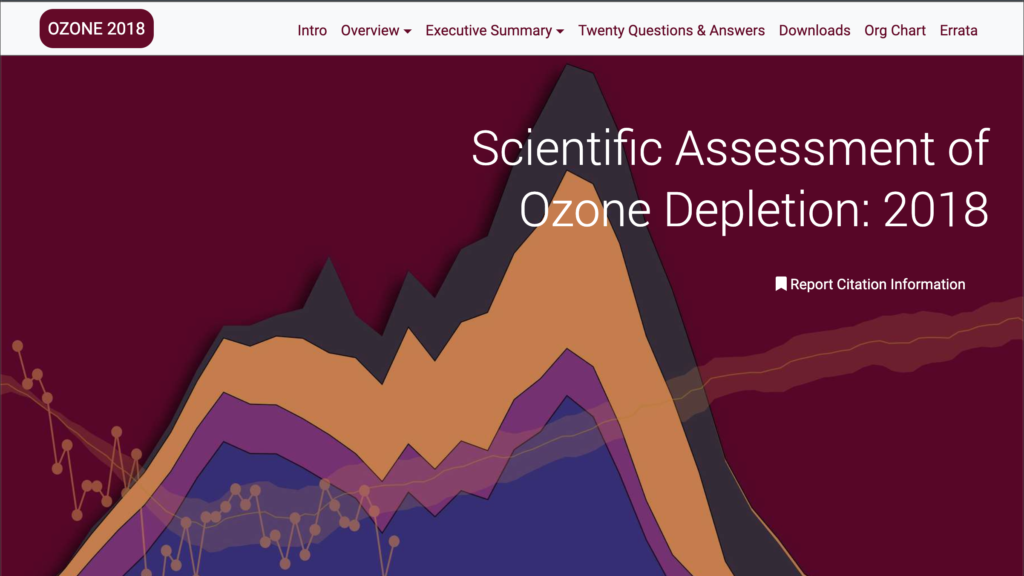
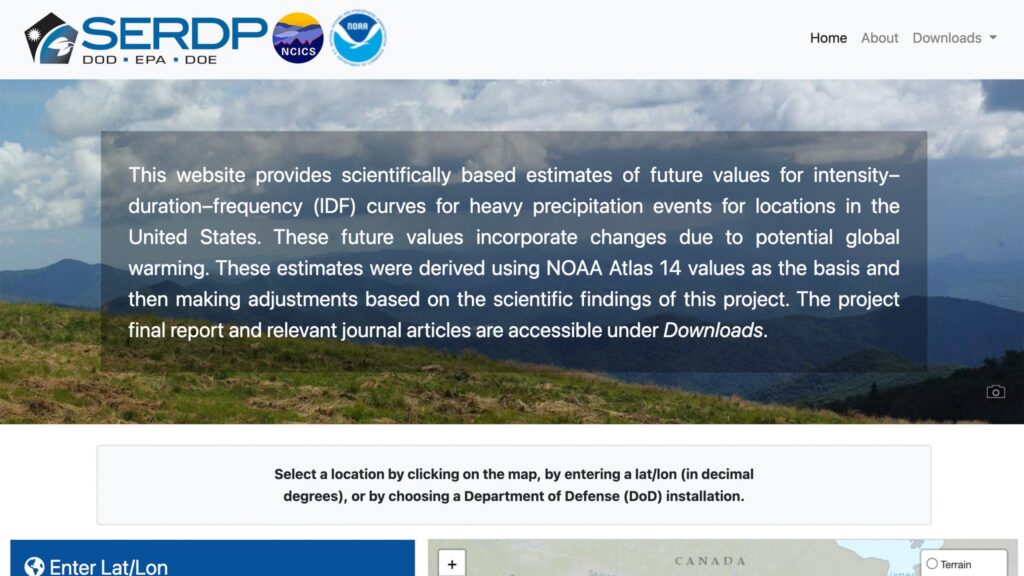
Click the arrows below to see screenshots of some of the websites we have created. See the Products and Tools page for links to these and other products.
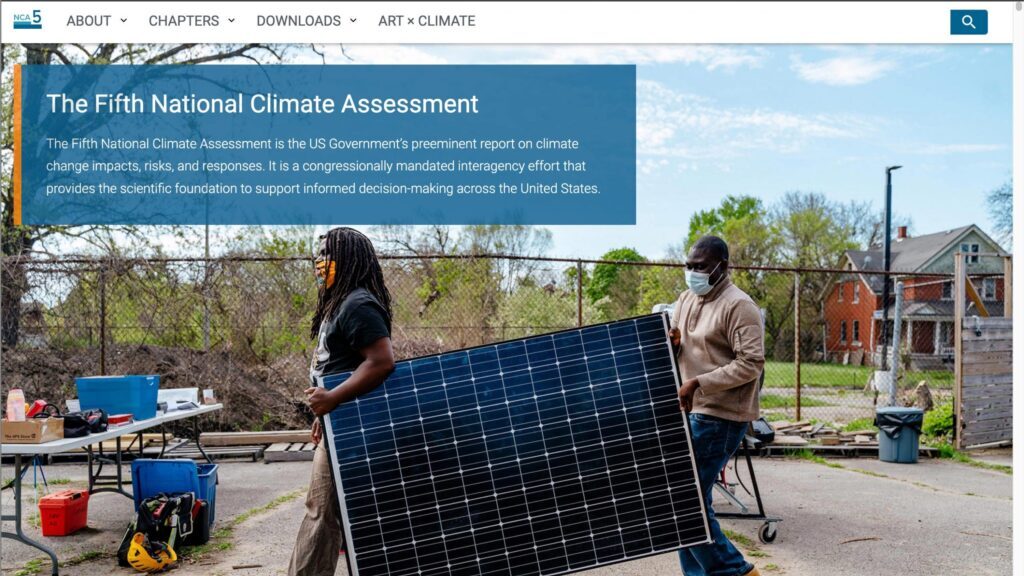

As part of the web products included for each National Climate Assessment (NCA), the TSU has designed and implemented an interactive Metadata Viewer. This viewer allows users to explore and interact with all of the collected figure metadata documentation. This documentation is directed by the Information Quality Act (IQA), and through this viewer, the TSU demonstrates NCA compliance with the IQA. The IQA requires NCA data to be transparent and accessible, with documentation collected at such a level of detail that the NCA science is also reproducible. Accessed on the report websites by clicking the “eyeball” icon above each figure, the viewer is launched and guides users through sources, datasets, scientific and visualization methods, and tools used to create each figure. Additionally, users are able to download metadata documentation in multiple file formats, individual figure panels, and for some figures, the derived datasets analyzed to produce the figure. Click the “eyeball” to the right below to launch the viewer for a complex example of NCA metadata information.

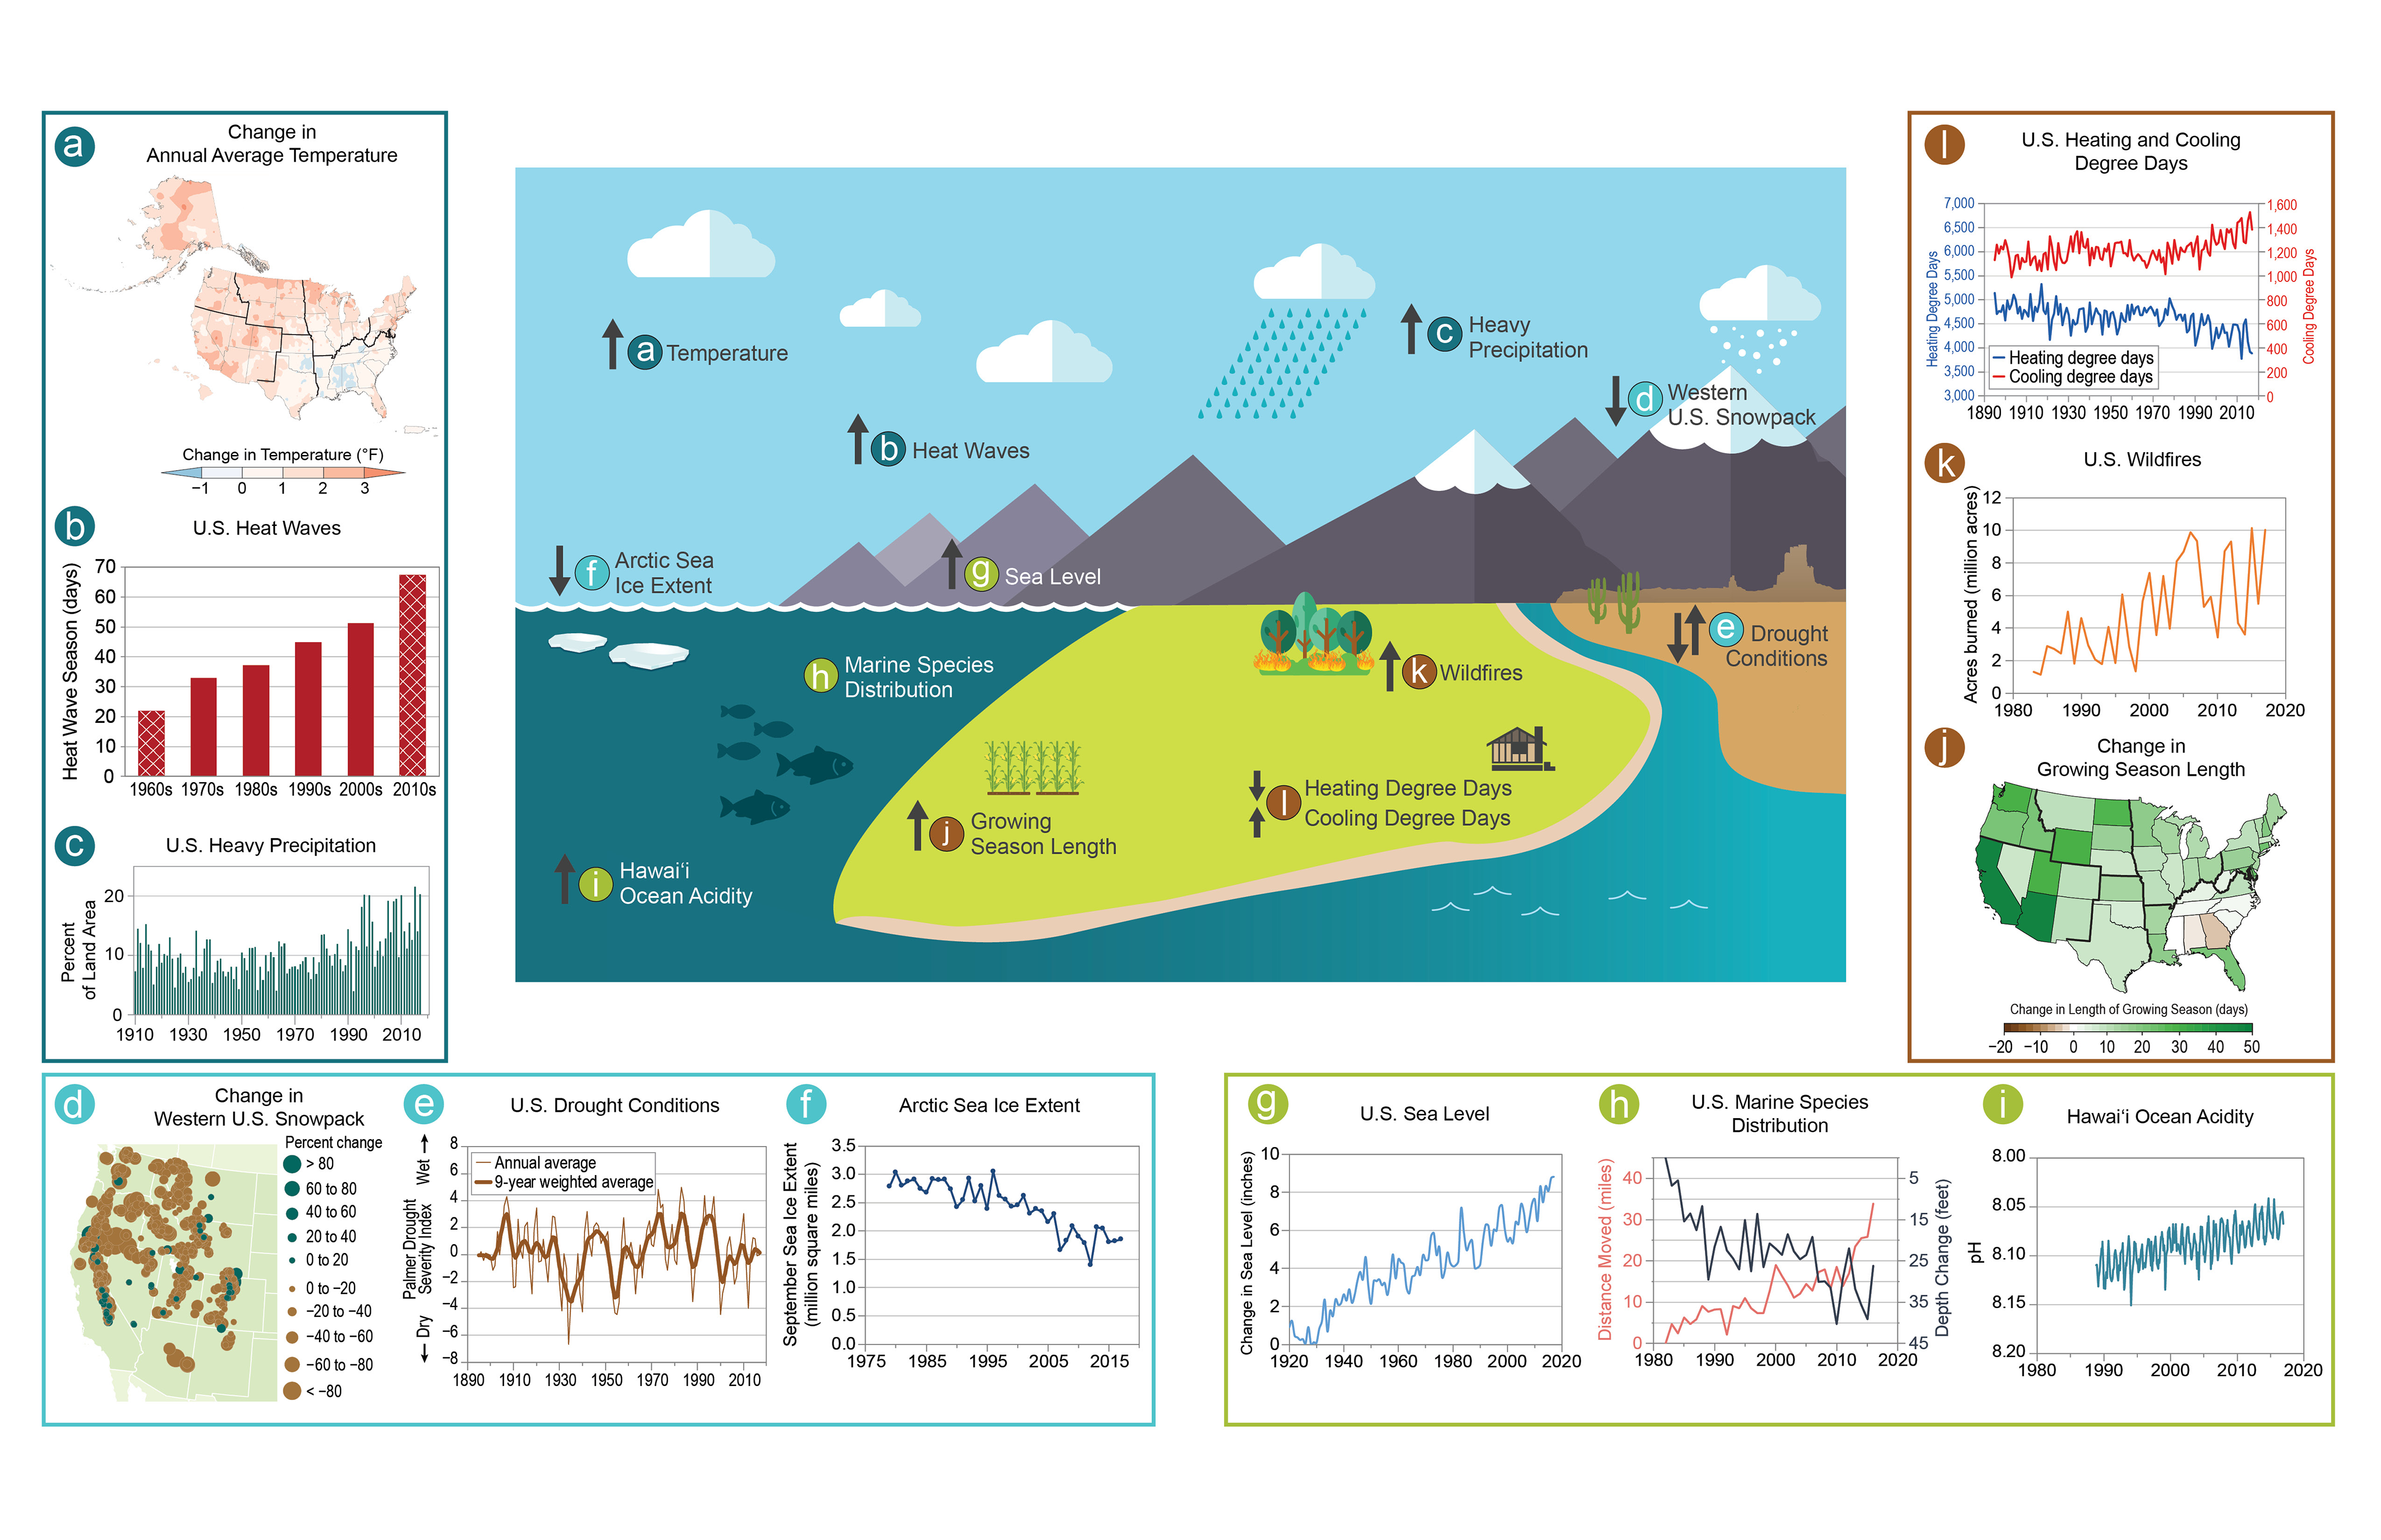
NCA4 Figure 1.2: Indicators of Change
From jupyter.org:
The Jupyter Notebook is an open-source web application that allows you to create and share documents that contain live code, equations, visualizations and narrative text. Uses include: data cleaning and transformation, numerical simulation, statistical modeling, data visualization, machine learning, and much more.
 North Carolina
The following is a list of Jupyter Notebooks for all the images found in the State Summaries website for North Carolina. Clicking on a link will bring up a Jupyter notebook viewer which will display the R script along with the image the script generates. Additionally, you will be able to download the R script.
- Annual Average Temp
- Annual Fall Temp
- Annual Max Fall Temp
- Annual Max Spring-Temp
- Annual Max Summer Temp
- Annual Max Temp
- Annual Max Winter Temp
- Annual Min Fall Temp
- Annual Min Spring Temp
- Annual Min Summer Temp
- Annual Min Temp
- Annual Min Winter Temp
- Annual Precip
- Annual Spring Temp
- Annual Summer Temp
- Annual Winter Temp
- Days Below Freezing
- Extremely Hot Days
- Extremely Warm Nights
- Fall Precip
- Hot Days
- Monsoon Precip
- Nights Below Freezing
- Observed Days Below Freezing
- Observed Extreme Hot Days
- Observed Extreme Warm Nights
- Observed Nights Below Freezing
- Observed Precip 1in
- Observed Precip 2in
- Observed Precip 3in
- Observed Precip 4in
- Observed Very Cold Days
- Observed Very Hot Days
- Observed Very Warm Nights
- Observed Warm Nights
- Precip 1in
- Precip 2in
- Precip 3in
- Precip 4in
- Summer Precip
- Very Cold Days
- Very Cold Nights
- Very Hot Days
- Very Warm Nights
- Warm Nights
- Winter Precip