NOAA’s new geostationary weather satellite, GOES-16, is already changing the way we view our planet, even though it won’t be declared fully operational until later this year. By providing images and data at much higher resolutions and higher frequencies than its predecessors, GOES-16 gives weather forecasters and other scientists a much more detailed view of the Earth system than was previously possible. CICS-NC is helping provide unprecedented public access to GOES-16 data in support of NOAA’s Big Data Project.
The NOAA Big Data Project aims to expand access to important data sets by making them available to the public at no charge through partnerships with a variety of cloud providers. This allows individuals and organizations from both the public and private sectors to analyze massive quantities of data without having to provide their own storage and data transfer infrastructure. They can work with the data directly in the cloud, using computing resources and both open-source and proprietary software tools provided by the various cloud services.
Building on our success in porting NEXRAD Level II radar data to the cloud, CICS-NC has been delivering near-real-time GOES-16 data to three public cloud providers—the Open Commons Consortium’s Environmental Data Commons, Amazon Web Services, and Google’s Cloud Platform—since June of 2017.
Using processes developed by CICS-NC’s IT team, led by Jonathan Brannock, the data are downloaded to the institute’s high-performance computing infrastructure from NOAA’s internal data distribution center, packaged for distribution, and transferred to the cloud providers, all in a matter of a few minutes. We are currently transferring approximately 350 Gigabytes of GOES-16 data each day, or about 10 Terabytes of data each month.
The GOES-16 data available on the cloud include a range of “Level 1b” and “Level 2” products generated from the 16 channels on GOES-16’s primary observing instrument, the Advanced Baseline Imager, or ABI. The ABI provides two channels of visible light data and 14 channels of near-infrared and infrared (IR) data. In addition to providing images of clouds, storms, and other weather phenomena, these products provide data on vegetation cover, snow and ice, and ocean temperature. The products range from images of weather systems taken every 30 seconds to images of the continental United States taken every 5 minutes and “full disk” pictures of the western hemisphere taken every 15 minutes.
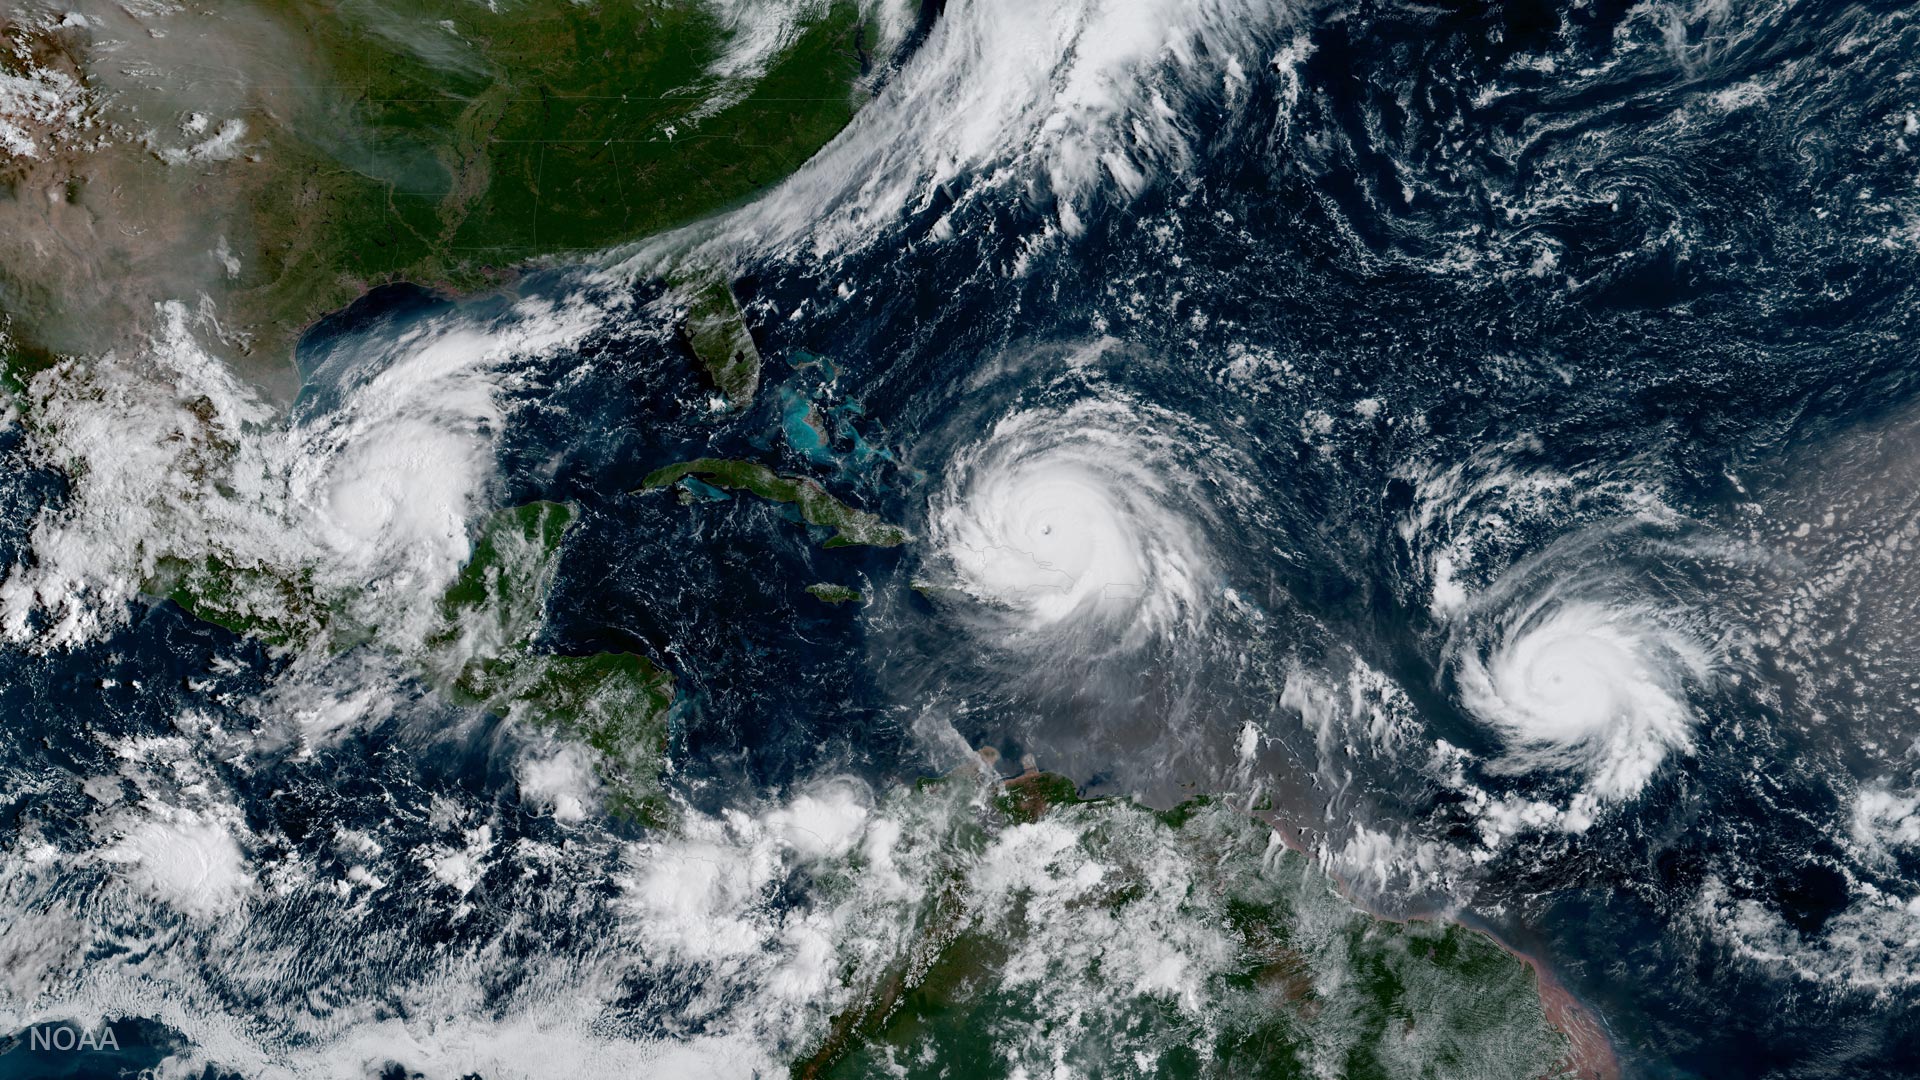
Although GOES-16 is still being tested and calibrated, its has already demonstrated its value during record-breaking 2017 Atlantic hurricane season. For example, as Hurricane Maria approached Puerto Rico, the land-based radar in San Juan went offline, leaving forecasters without a crucial source of data. GOES-16 helped fill that information gap, allowing forecasters to track the storm using GOES-16’s high-resolution images of the storm taken up to every 30 seconds.
Other organizations are also taking advantage of cloud-based access to GOES-16 images. For example, this web story from the Tampa Bay Times uses GOES-16 data pulled from the Open Commons Consortium portal to explain, in a very visual and clear manner, how and why Hurricane Irma tracked up through the center of Florida rather than taking an even more damaging course along the east or west coast of the state.
Above is a pseudo-color video of Hurricane Irma using image data from the Mesoscale GOES-16 bands 1 (Blue), 2 (Red), 3 (IR Veggie), and 13 (IR). The time range of this animation is from 6:24 – 22:15 GMT Sept 7, 2017.
This is a pseudo-color video using image data from the FullDisk GOES-16 bands 1 (Blue), 2 (Red), 3 (IR Veggie), and 13 (IR).