New State Climate Summaries for all 50 states plus Puerto Rico and the US Virgin Islands provide a concise look at observed and projected climate changes and significant climate and weather events.
January 19, 2022 Asheville, NC
Today, NOAA’s National Centers for Environmental Information (NCEI) and the Cooperative Institute for Satellite Earth System Studies (CISESS) released new State Climate Summaries for all 50 US states as well as Puerto Rico and the US Virgin Islands.
These concise summaries provide historical perspectives on temperature, precipitation, and other important features of each state’s climate. They also show projected changes in key climate metrics for two scenarios of future greenhouse gas emissions. The summaries are available as web pages and as downloadable PDFs that range from four to six pages in length.
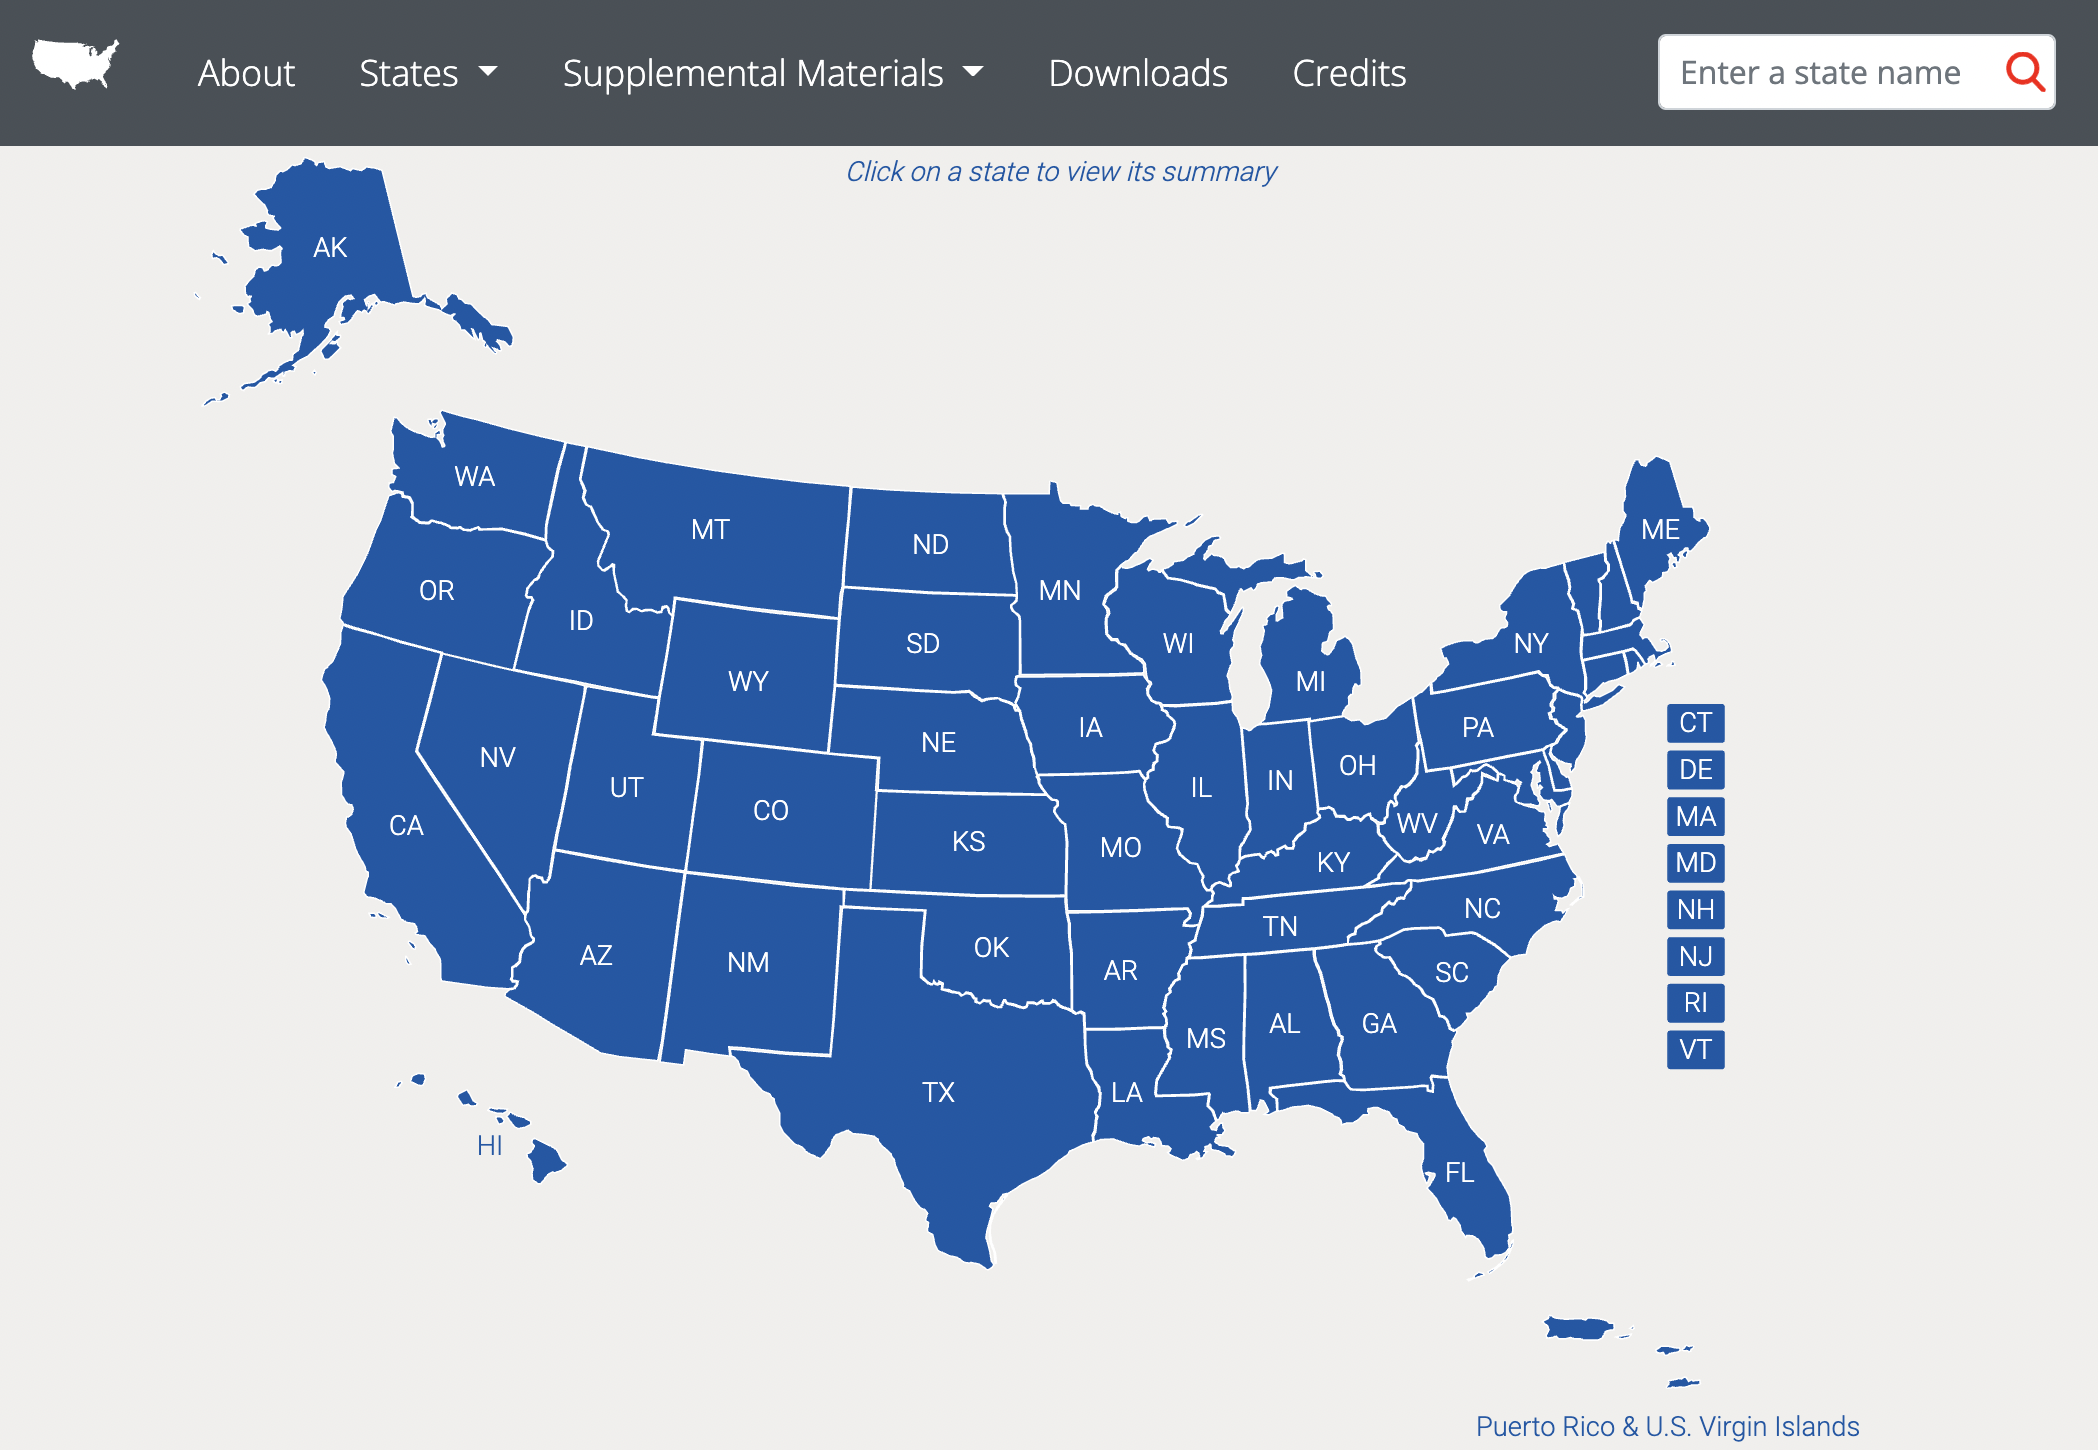
The interactive website allows users to quickly access summaries from any state, view supplemental material, and download PDFs and figure images.
Each summary begins with three Key Messages presenting important trends and other significant findings for each state. The supporting narrative text and figures describe the climatology of each state, how the state’s climate is changing over time, some notable historical climate and weather events, and how projected changes may affect key sectors.
Simple line and bar charts show observed annual values and multi-year averages for several temperature and precipitation metrics, including annual averages for temperature and precipitation as well as climate extremes, such as very warm nights, cold days, and the number of days per year with heavy precipitation events. Maps show projected changes in annual or seasonal precipitation, and other figures show changes of particular relevance for each state, such as tidal flooding events for coastal states, changes in lake or reservoir water depths, or changes in drought conditions.
The interactive website for the summaries, developed and hosted by CISESS, allows users to download individual figures and provides access to detailed metadata with details on the datasets, methods, tools, and source code used to produce each figure. These metadata provide maximum transparency and reproducibility and fulfill important federal information-quality requirements (see a metadata example for Delaware).
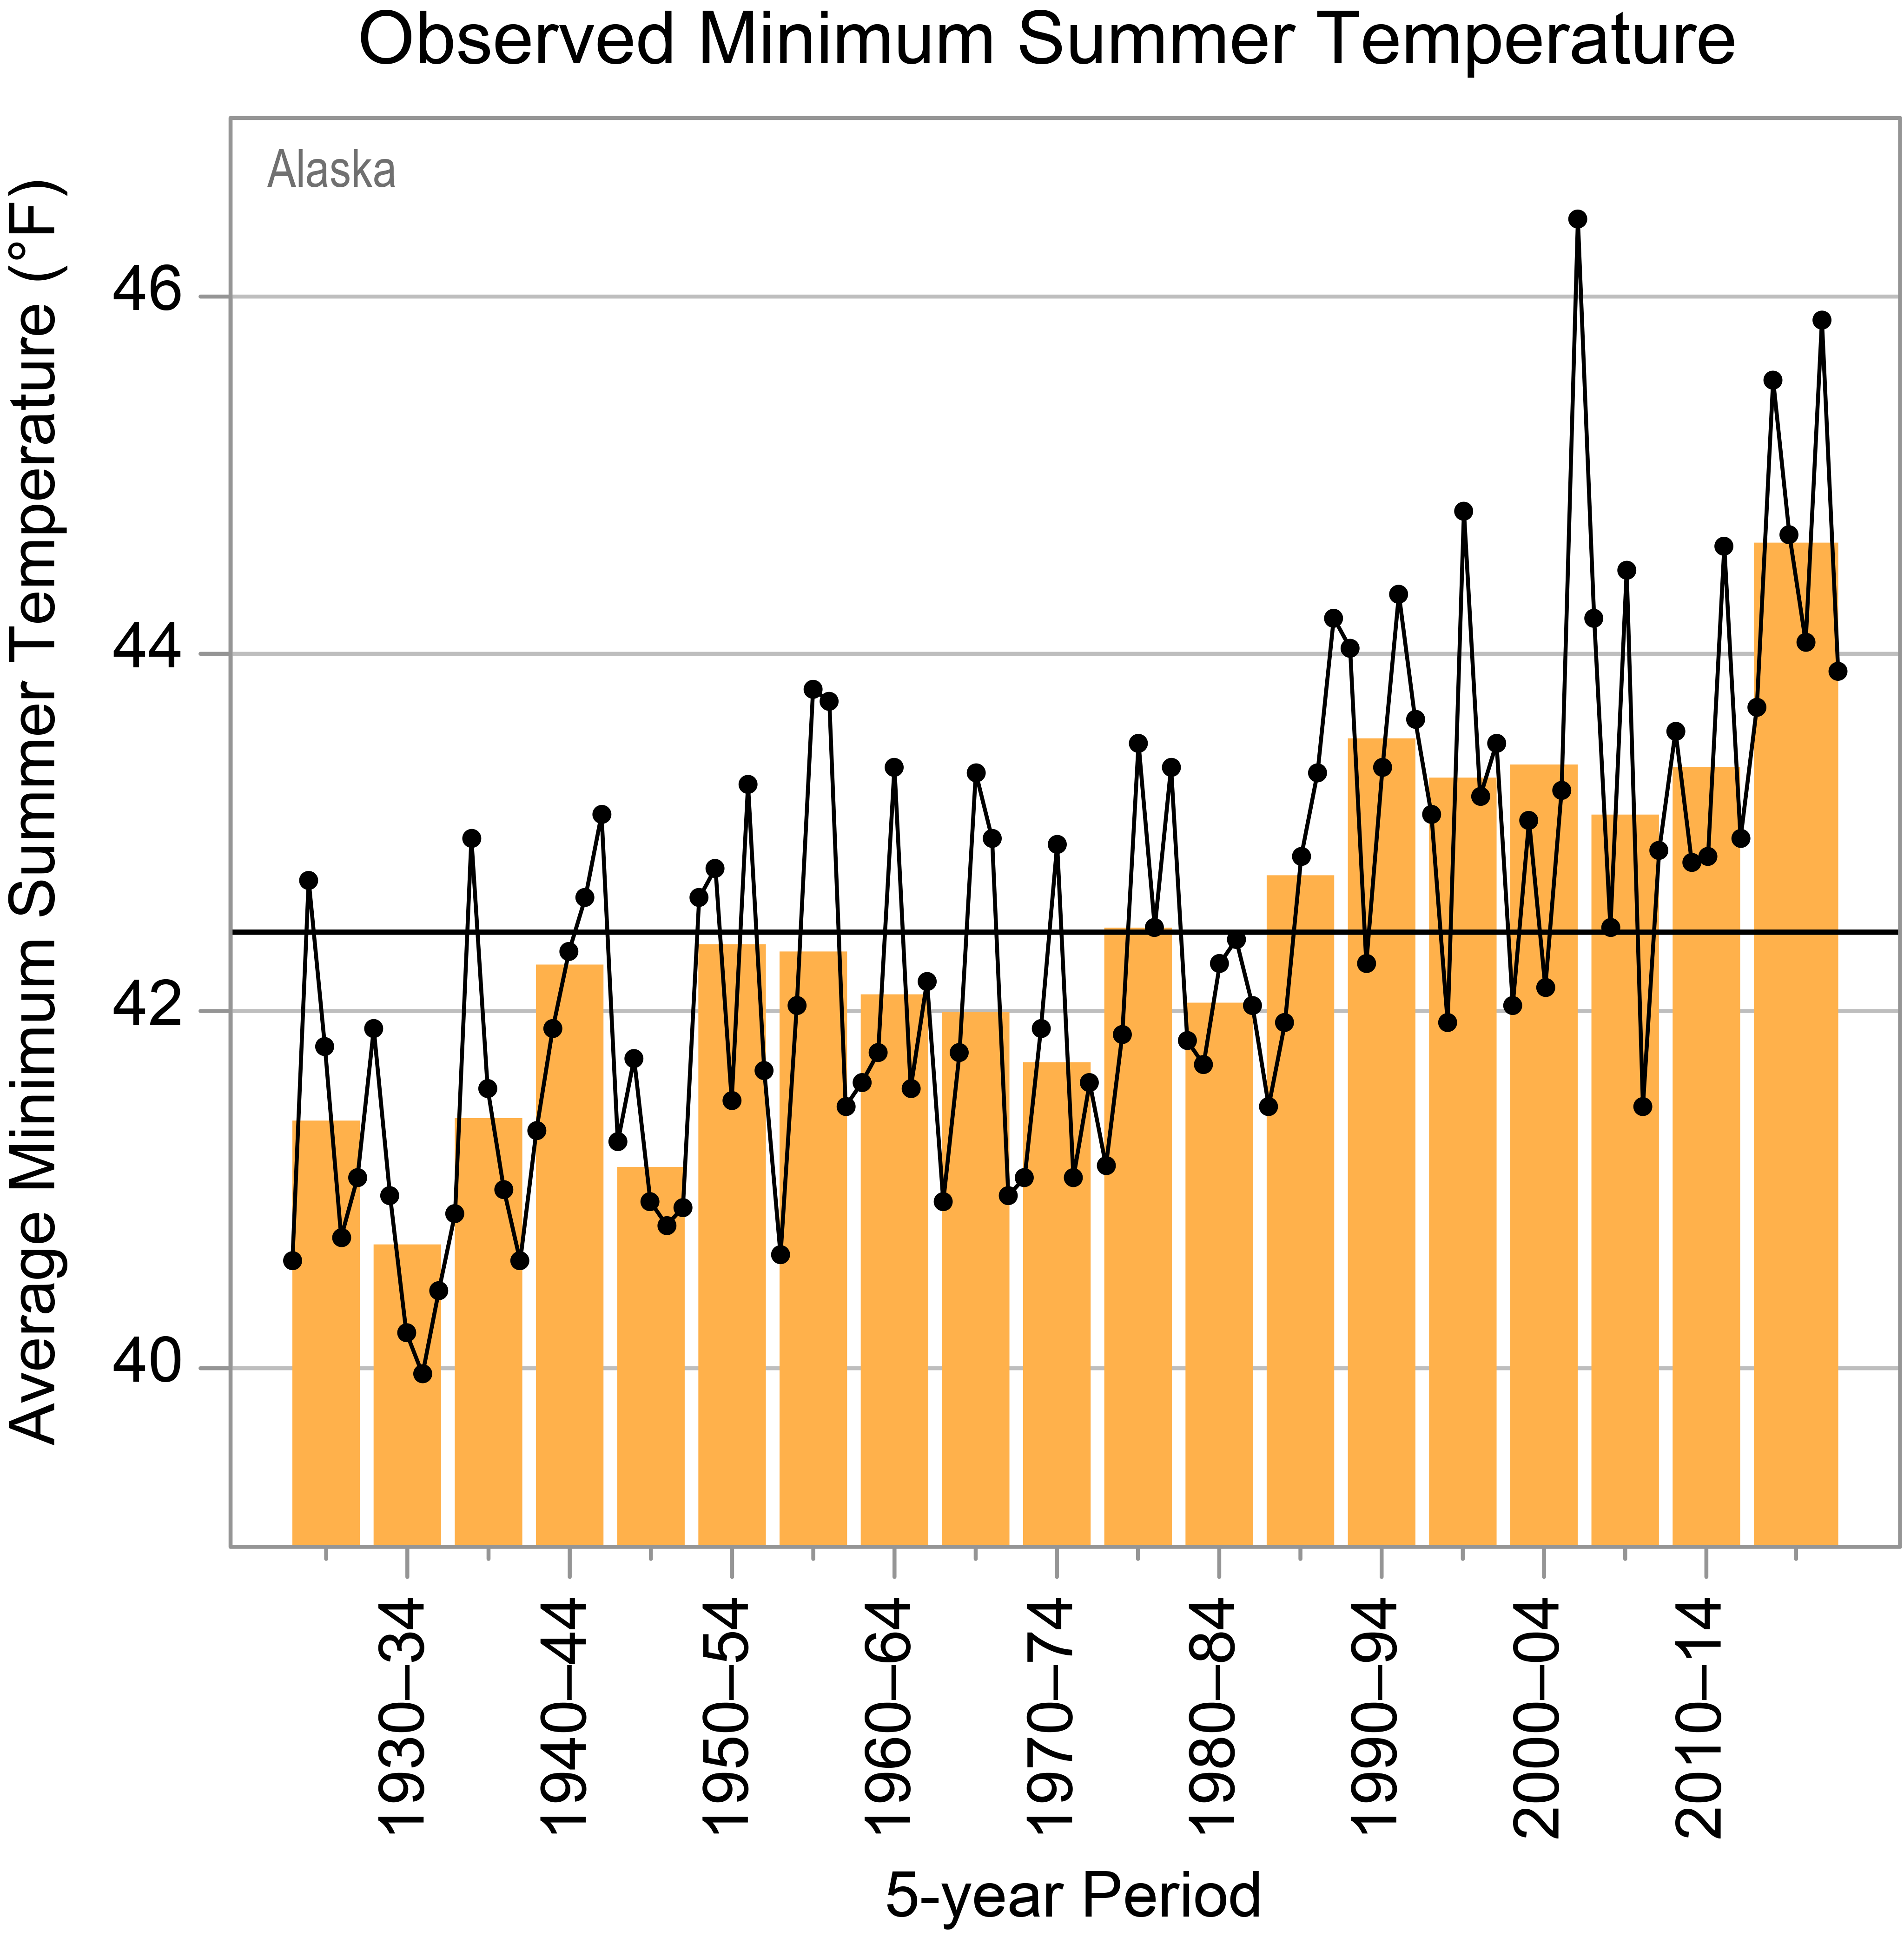
Average annual and multi-year average summer minimum temperatures for Alaska from 1925 to 2020. Source: Alaska State Climate Summary 2022 (Stewart et al. 2022).
The State Climate Summaries project was led by staff from CISESS and NCEI at NOAA’s Assessments Technical Support Unit, with support from the US Global Change Research Program, NOAA’s Regional Climate Centers, and state climatologists from around the US.
These new summaries are a comprehensive update to the original versions released in 2017. The updated summaries extend the historical record to 2020 for every state and cover many of the significant climate and weather events that have occurred over the past five years.
For more information, see “NOAA Addresses Climate in Each State” at NOAA NCEI.
State Climate Summaries By the Numbers
Summaries: 51 (50 US states plus Puerto Rico/US Virgin Islands) Pages: 251 Words: more than 116,000 Figures: 520 Authors: more than 50 Datasets: 23
References
Stewart, B.C., K.E. Kunkel, S.M. Champion, R. Frankson, L.E. Stevens, G. Wendler, J. Simonson, M. Stuefer, 2022: Alaska State Climate Summary 2022. NOAA Technical Report NESDIS 150-AK. NOAA/NESDIS, Silver Spring, MD, 6 pp.
Media Contact Tom Maycock Science Public Information Officer NC State University’s North Carolina Institute for Climate Studies tmaycock@ncics.org 828-271-4272