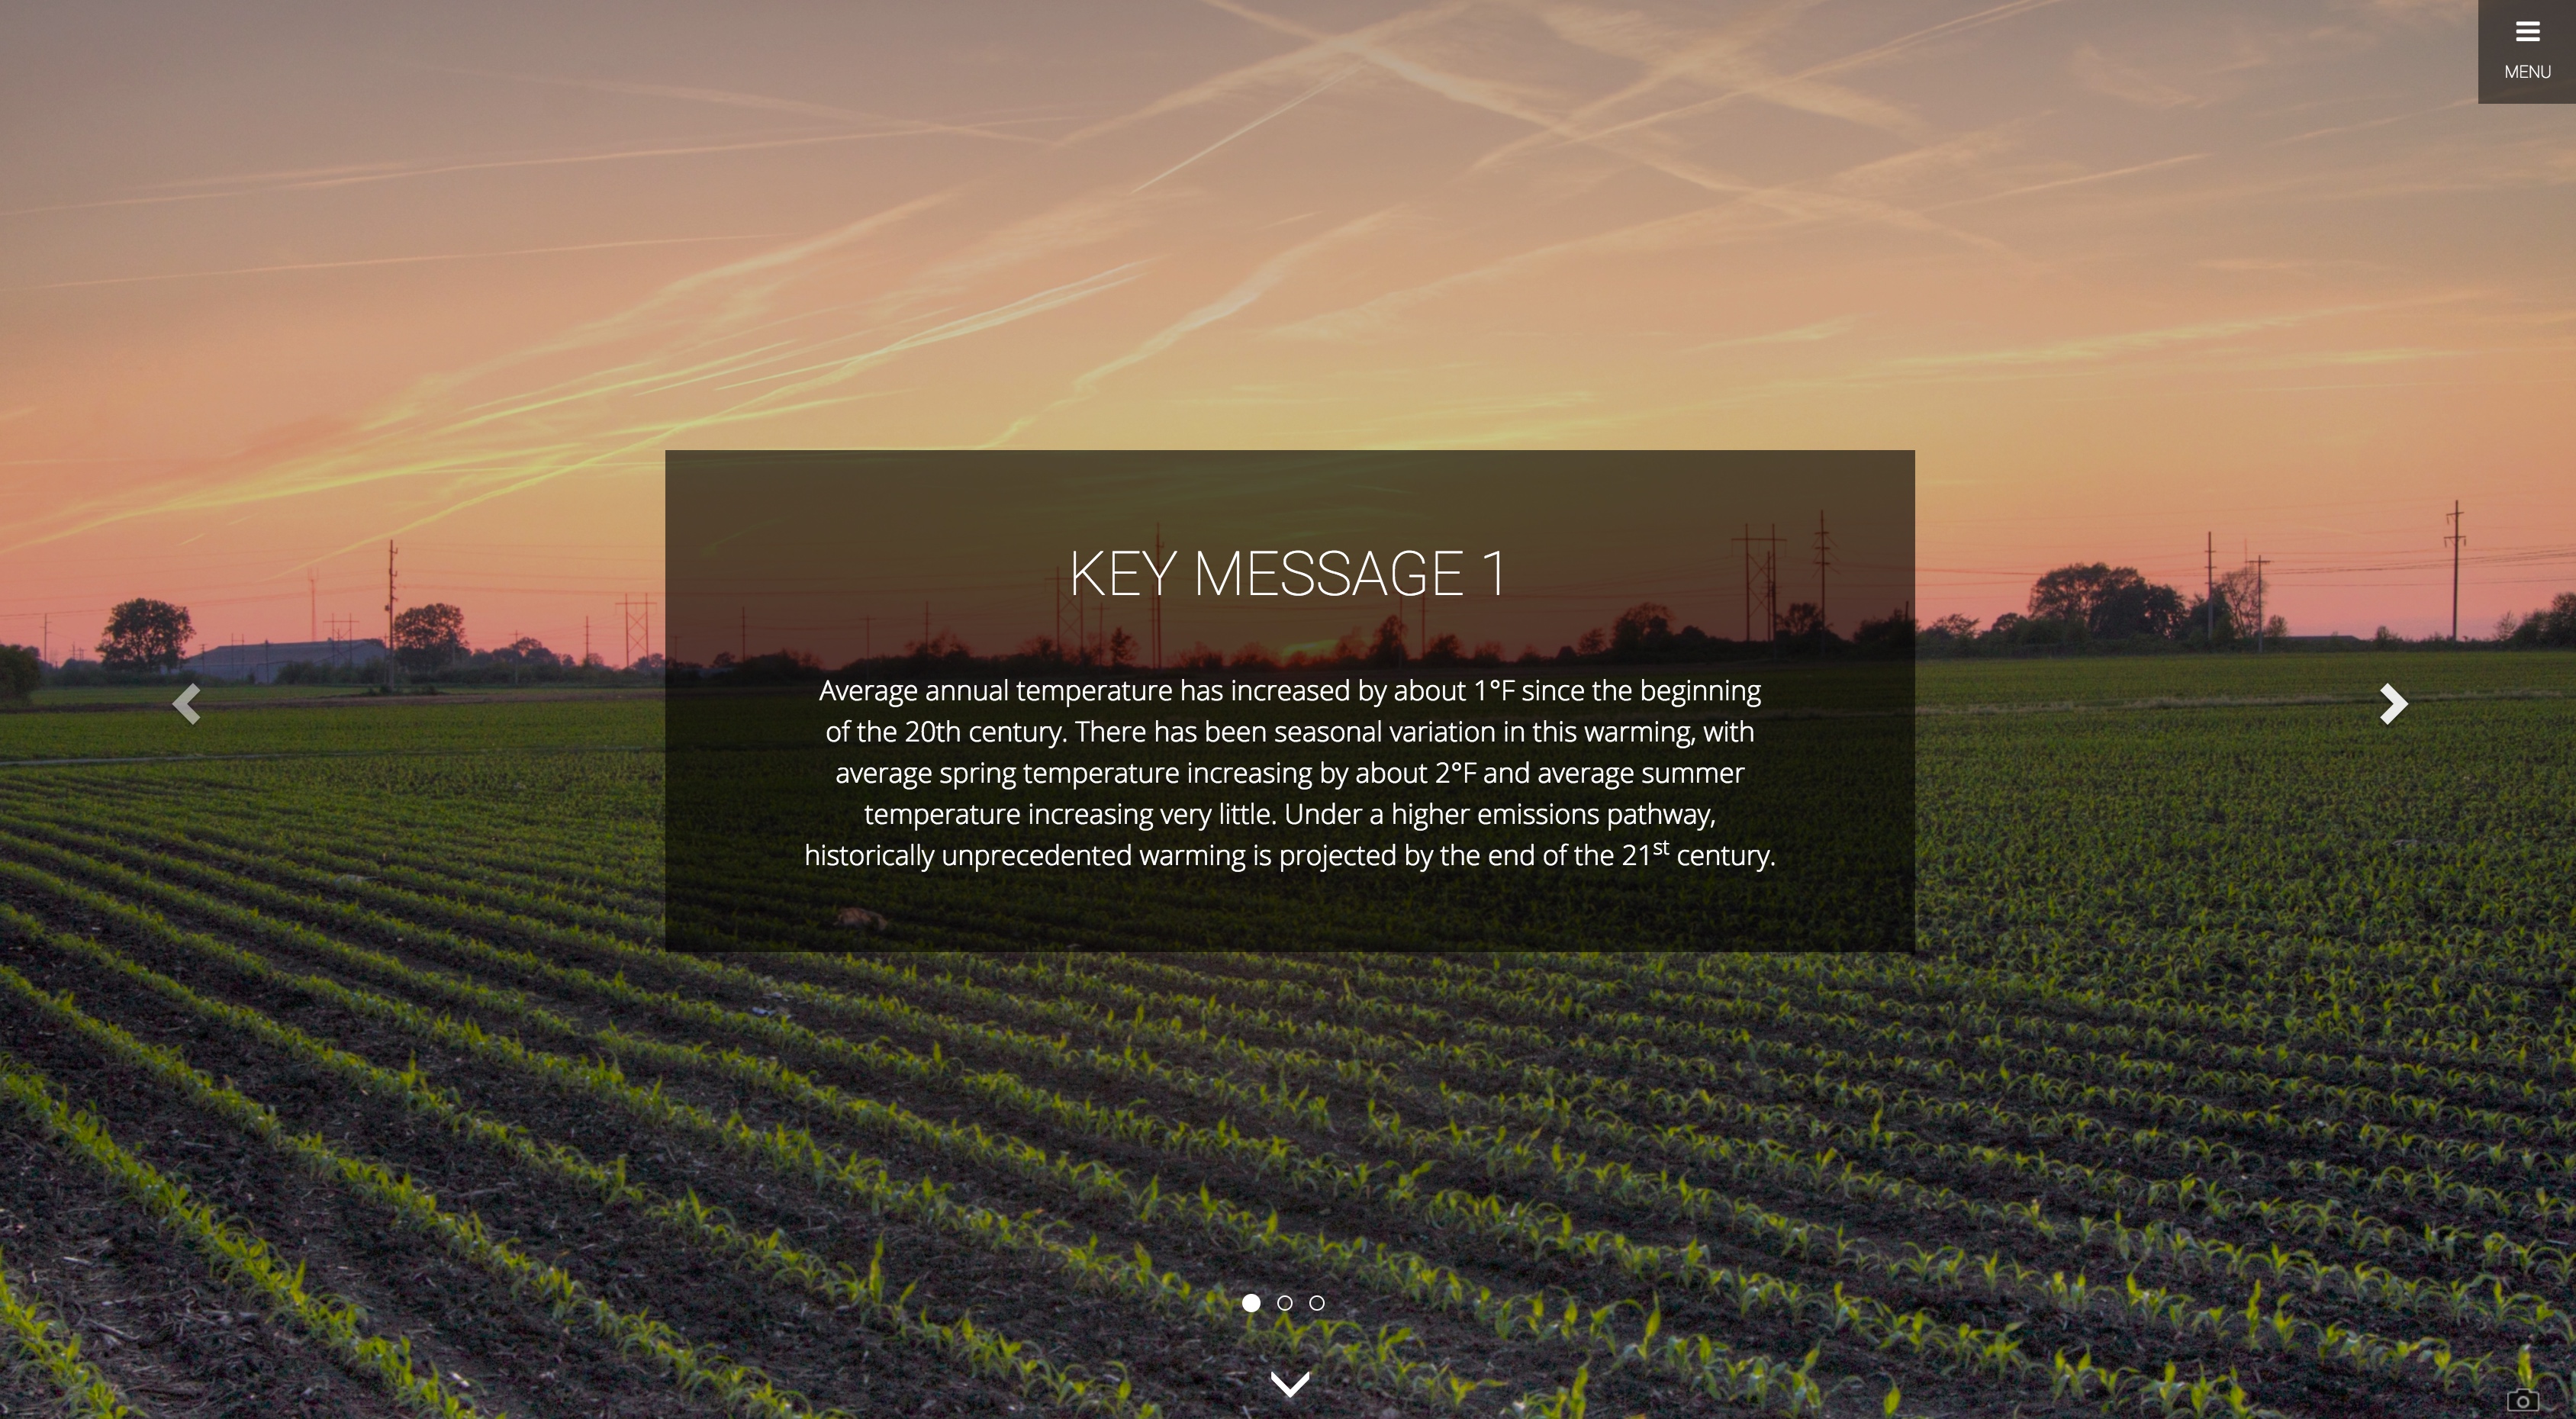
Key Message 1 from the web version of the Illinois State Climate Summary.
Overview
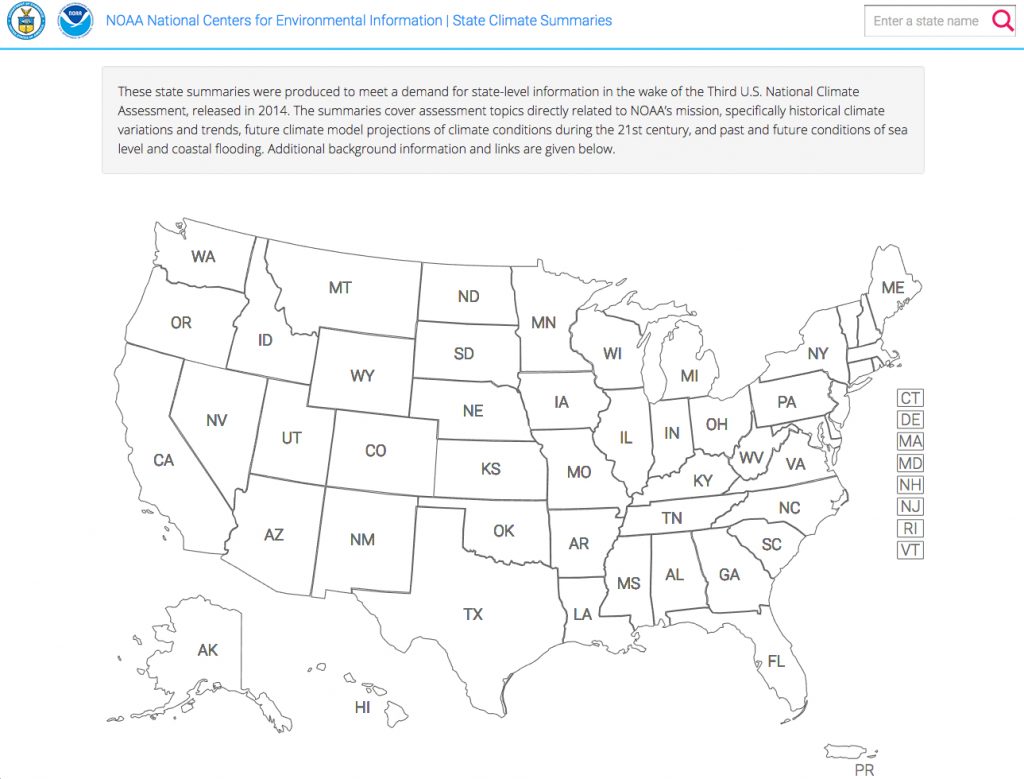
In response to growing demands for state-level information on the assessment of climate change, the Cooperative Institute for Climate and Satellites–North Carolina and NOAA’s National Centers for Environmental Information have produced a set of climate summaries for all 50 U.S. states. These summaries, available via an interactive website and as downloadable PDFs, provide up-to-date information on observed and projected climate changes for each state. Focusing on characteristics of the physical climate and coastal issues in accordance with NOAA’s mission, these summaries are designed to supply decision makers, other stakeholders, and the public with highly relevant climate information delivered in an accessible and compact format.
See our news story for more about the contents of the state climate summaries.
Institute Activities
More than two years in development, the state climate summaries were produced by a multidisciplinary team at CICS-NC and NOAA NCEI, with additional input from other state and regional experts, including State Climatologists and staff from NOAA’s Regional Climate Centers.
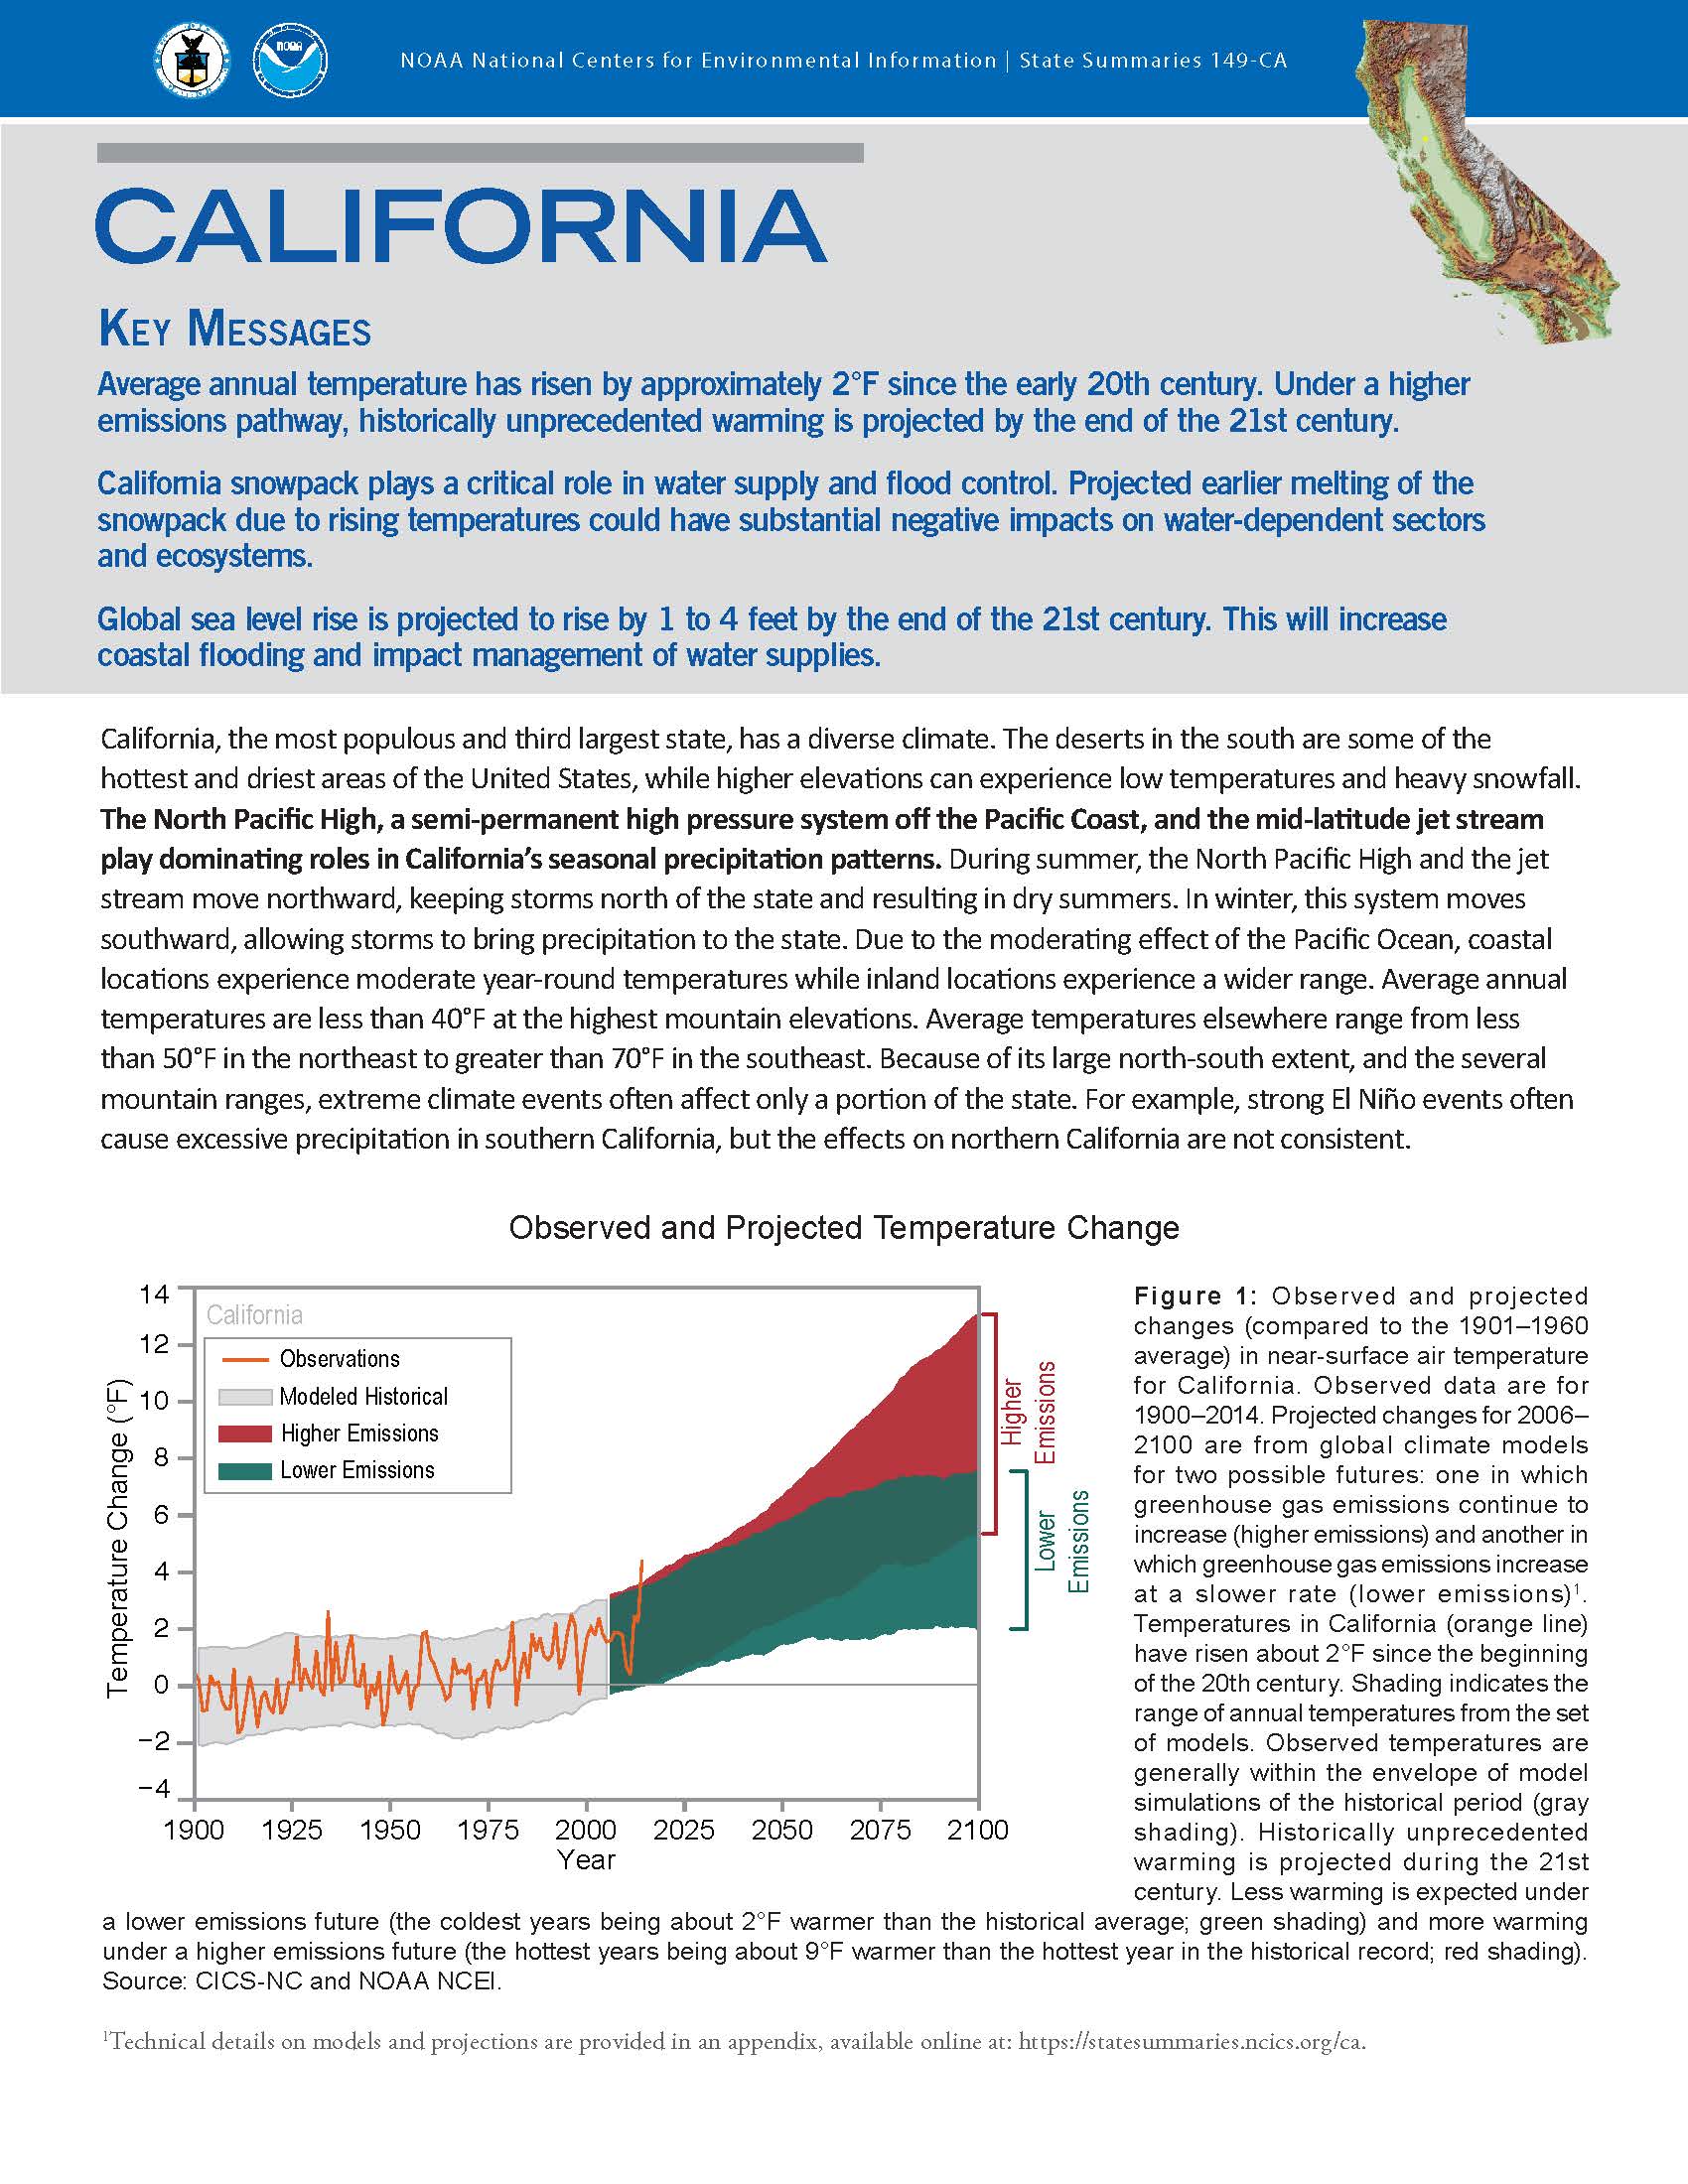
First page of the California state summary PDF
- Led by Ken Kunkel, CICS-NC’s lead scientist for assessments, scientists from NOAA NCEI’s Assessments Technical Support Unit produced an extensive suite of figures presenting state-specific climate observations and climate model projections, researched historical climate events and significant climate impacts for each state, and developed key messages and supporting text for all 50 states.
- The science team also engaged with key stakeholders from around the country to refine the content of each summary, and worked through an extensive anonymous peer review process to finalize the content.
- Science and data experts collected and curated metadata for all scientific figures in the summaries and worked with our web and software development team to make this metadata available via the state summaries website.
- Graphic designers and science communication experts refined figures and developed attractive and accessible PDF versions of each summary. PDFs are available in an 8.5″x11″ format for screen reading and an 11″x17″ format for printing as a 4-page brochure.
- The web development team produced an attractive and easy-to-read web version of the summaries, featuring a clickable US map for quick access to the summary for any state. The summaries, along with hundreds of additional supplemental figures, technical details, references, and other information are available at http://stateclimatesummaries.globalchange.gov