NCICS: Tropical Monitoring
Hovmöllers:
Maps:
SST Maps:
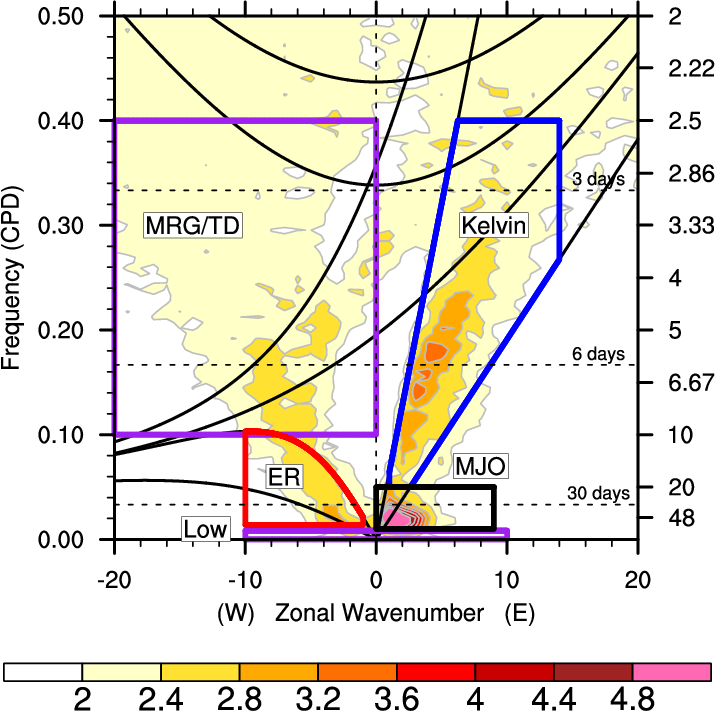 Wheeler and Weickmann (2001) developed a method for filtering OLR in real-time to identify, track, and predict the MJO and equatorial waves. This webpage expands on their methodology and applies it to other variables. The filter bands used can be seen on this wavenumber—frequency spectrum.
- Original:
- Very similar to the original Wheeler-Weickmann method. One notable difference is that the zonal mean wave variance is maintained constant in the projections. This helps maintain realistic wave amplitudes.
- No TCs:
- Equatorial Rossby Waves and TD-type disturbances are strongly affected by tropical cyclones, as shown in Fig. 6 from Schreck et al. (2011).
- Tropical-cyclone-related anomalies are removed before filtering following the method of Schreck et al. (2011) and Aiyyer et al. (2012)
- CFS Forecasts:
- Instead of appending with climatology as in Wheeler-Weickmann, the observations are instead padded with 45-day forecast anomalies from the CFS. These anomalies are the mean of a 16-member pseudo-ensemble including all four runs each from 00z, 06z, 12z, and 18z yesterday.
This website shows longitude-time Hovmöllers and latitude-lognitude maps for OLR, zonal wind (uwnd850 & uwnd200), meridional wind (vwnd850 & vwnd200), velocity potential (chi850 & chi200), and streamfunction (psi850 & psi200) at 850-hPa and 200-hPa.
Shading shows anomalies from climatogy in the past. In the future, shading is either the sum of all modes or the CFS forecast and its departure from its own climatology. Contours identify the MJO, equatorial Rossby waves, Kelvin waves, and the low-frequency background (> 120 days). The filter bands are shown above in the Algorithms. Hurricane symbols denote tropical cyclogenesis identified by NHC and JTWC, with the direction indicating Northern or Southern Hemisphere.
For the “CFS with SSTs” Hovmöllers, the shading denotes SST anomalies, while contours are filtered-anomalies for the various other variables.
The “Subtract Tropical Mean” SST maps take the anomalies from a daily climaology and subtract the global mean from 20°S–20°N. The “SST Tendency” maps show the difference between the current and previous averaging periods (e.g., the current 7-day mean minus the previous 7-day mean).
OLR data used here are NOAA’s interim Climate Data Record as obtained from Univ. of Maryland.
SST data are NOAA NCEI’s Optimum Interpolated SST (OISST).
Tropical cyclone data are obtained from NHC and JTWC through NCEP’s tcvitals data.
All other fields are obtained from CFS analyses.
DISCLAIMER: Please note these pages present experimental analyses developed by researchers at CICS-NC and/or of interest to the CICS-NC community and their collaborators. These analyses are subject to change as our understanding of the Earth’s climate system improves and/or our interests change. There is no guarantee on their future availability.