Monitoring the MJO and Tropical Waves
| NOAA CDR HIRS OLR | NOAA/ESRL AVHRR OLR | |||||
|---|---|---|---|---|---|---|
| Northern Narrow 2.5°N – 7.5°N | Total | Anomaly | Waves | Total | Anomaly | Waves |
| Northern Medium 2.5°N – 17.5°N | Total | Anomaly | Waves | Total | Anomaly | Waves |
| Northern Wide 2.5°N – 27.5°N | Total | Anomaly | Waves | Total | Anomaly | Waves |
| Equatorial Narrow 2.5°S – 2.5°N | Total | Anomaly | Waves | Total | Anomaly | Waves |
| Equatorial Medium 7.5°S – 7.5°N | Total | Anomaly | Waves | Total | Anomaly | Waves |
| Equatorial Wide 15°S – 15°N | Total | Anomaly | Waves | Total | Anomaly | Waves |
| Southern Narrow 7.5°S – 2.5°S | Total | Anomaly | Waves | Total | Anomaly | Waves |
| Southern Medium 17.5°S – 2.5°S | Total | Anomaly | Waves | Total | Anomaly | Waves |
| Southern Wide 27.5°S – 2.5°S | Total | Anomaly | Waves | Total | Anomaly | Waves |
| NOAA CDR HIRS OLR | NOAA/ESRL AVHRR OLR | |
|---|---|---|
| Total | 1d • 3d • 5d • 7d • 15d | 1d • 3d • 5d • 7d • 15d |
| Anomaly | 1d • 3d • 5d • 7d • 15d | 1d • 3d • 5d • 7d • 15d |
| MJO | 5d • 7d | 5d • 7d |
| Kelvin Waves | 1d • 2d | 1d • 2d |
| Symmetric Kelvin Waves | 1d • 2d | 1d • 2d |
| ER Waves | 3d • 5d | 3d • 5d |
| Symmetric ER Waves | 3d • 5d | 3d • 5d |
| MRG Waves | 1d | 1d |
| Anti-Symmetric MRG Waves | 1d | 1d |
| TD-type Disturbances | 1d | 1d |
| Sum of Waves | 3d • 5d • 7d | 3d • 5d • 7d |
NOAA CDR HIRS OLR
- These data are NOAA’s interim Climate Data Record as obtained from Univ. of Maryland.
- They are a blend of observations from geostationary satellites and the HIRS sensor on the NOAA polar-orbiting satellites.
NOAA/ESRL AVHRR OLR
- These data are observed with the AVHRR sensor on the NOAA polar-orbiting satellites.
- Uninterpolated gridded data are obtained from NOAA/OAR/ESRL/PSD.
- Gaps between orbital swaths are interpolated following the method of Liebmann and Smith (1996).
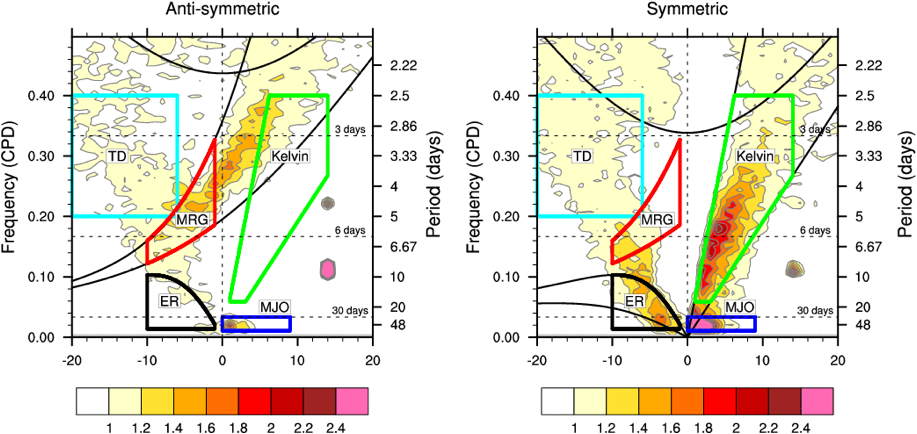
The figure above shows the wavenumber—frequency spectrum for OLR, divided by an estimate of the red background following Wheeler & Kiladis (1999, JAS). The panel on the left shows signals that are anti-symmetric about the equator, while the panel on the right shows those that are symmetric. Spectral peaks tend to lie along the dispersion curves for shallow water equatorial waves (black lines).
To identify tropical waves in near real-time, the OLR and UTWV data are filtered following Wheeler & Weickmann (2001 MWR). The daily anomalies are calculated using the first 3 harmonics of the seasonal cycle for 1979–2009. Missing values are then filled using linear interpolation in space and time. The most recent 365 days of anomalies are padded with 659 days of zeroes, and the result is filtered for each wave type.
No equatorial symmetry is imposed here, and the filters differ somewhat from the original ones defined by Wheeler & Kiladis (1999):
| Wave Type | Color | Propagation Direction | Wavenumber | Period (days) | Equivalent Depth (m) | Source |
|---|---|---|---|---|---|---|
| Julian Oscillation (MJO) | Blue | Eastward | 0–9 | 30–96 | n/a | Kiladis et al. (2005 JAS) |
| Kelvin Waves | Green | Eastward | 1–14 | 2.5–17 | 8–90 | Straub & Kiladis (2002, JAS) |
| Equatorial Rossby (ER) Waves | Black | Westward | 1–10 | 9–72 | 0–90 | Kiladis et al. (2009, Rev. Geophys.) |
| Mixed Rossby-Gravity (MRG) Waves | Red | Westward | 1–10 | 3–10 | 8–90 | Wheeler & Kiladis (1999) |
| Tropical Depression (TD)-type disturbances | Cyan | Westward | 6–20 | 2.5–5 | n/a | Roundy & Frank (2004, JAS) |
DISCLAIMER: Please note these pages present experimental analyses developed by researchers at CICS-NC and/or of interest to the CICS-NC community and their collaborators. These analyses are subject to change as our understanding of the Earth’s climate system improves and/or our interests change. There is no guarantee on their future availability.
Created and maintained by Carl Schreck.