On August 21, 2017, a total solar eclipse will sweep across the continental United States, starting in the Pacific Northwest at around 9am Pacific Daylight Time and ending along the Southeast Atlantic coast at around 4pm Eastern Daylight Time. The eclipse will be visible across most of the country, but the path of totality, where the moon will completely obscure the sun, will be only about 70 miles wide, stretching from the Oregon coast across the central part of the country and down through Charleston, South Carolina.
One thing might stand in the way of viewing this historic eclipse: clouds. To estimate the likelihood of skies being clear enough to view the eclipse, Ronnie Leeper, Jared Rennie, and Carl Schreck developed an eclipse viewability map using historical cloudiness data from NOAA NCEI’s 10-year hourly climate normals dataset.
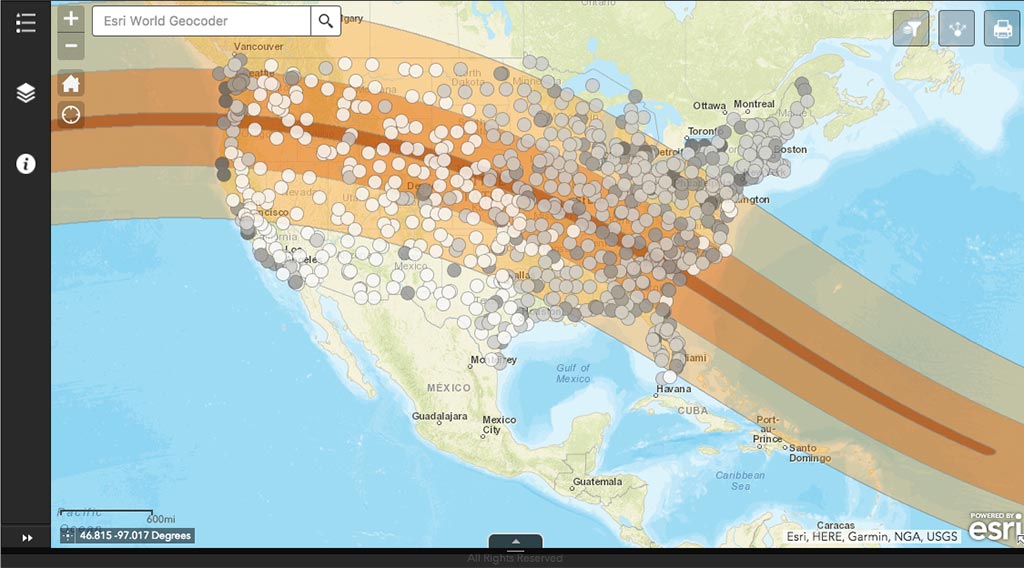
For each observing station included in the analysis, the team calculated a viewable percentage index, with higher numbers indicating a higher probability of relatively clear skies—meaning a better chance of seeing the eclipse. On the map, lighter circles indicate a higher probability of clear skies and good viewing while darker circles indicate lower probabilities of having a clear view of the eclipse.
You can click on any station to view detailed information for that location, including the local peak time of the eclipse, how much of the sun will be obscured at that location, the computed viewable percentage, and the percentage chances of the five categories of cloud cover (clear, few, scattered, broken, and overcast) used to calculate the viewable percentage.
For more on the eclipse, the development of the map, and how to view the eclipse safely, see the story Ready, Set, Eclipse on NCEI’s web site.
The interactive map is embedded below, and is also available via our Monitoring Tools page.