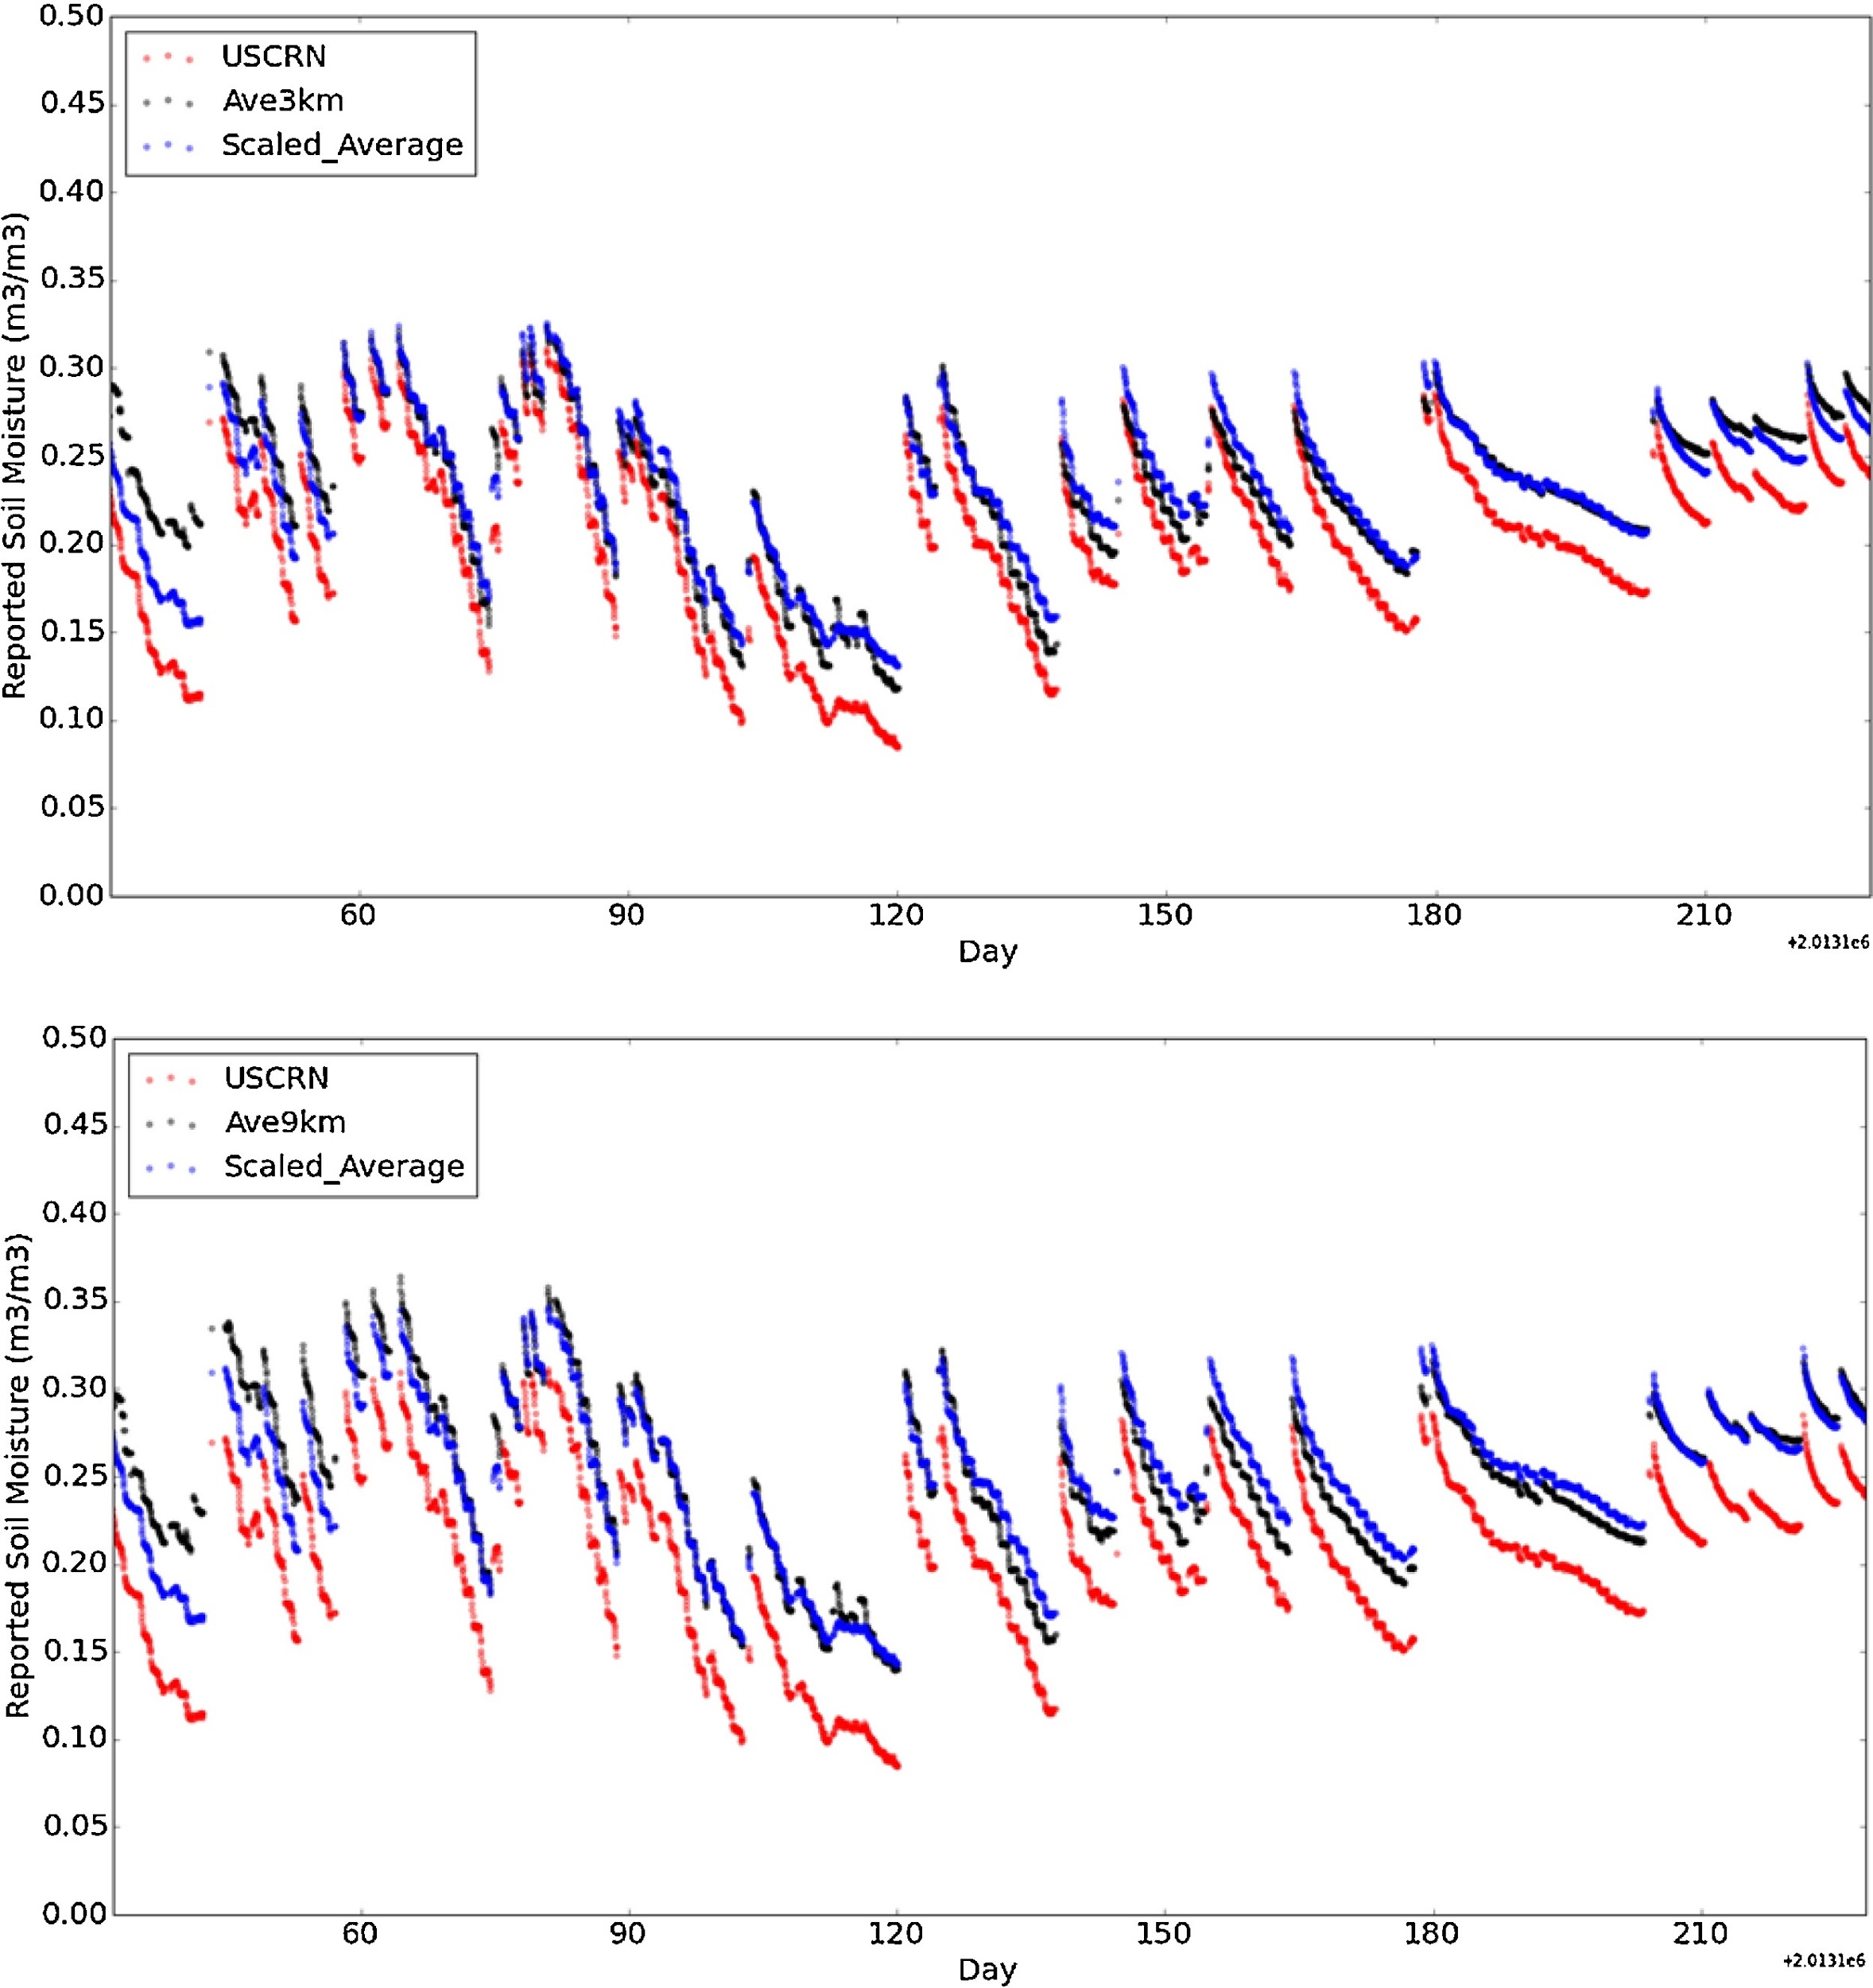
A comparison between the reported soil moisture of USCRN, the average of the temporary networks, and the authors’ scaled averages. 3km range on top figure and 9km on the bottom.
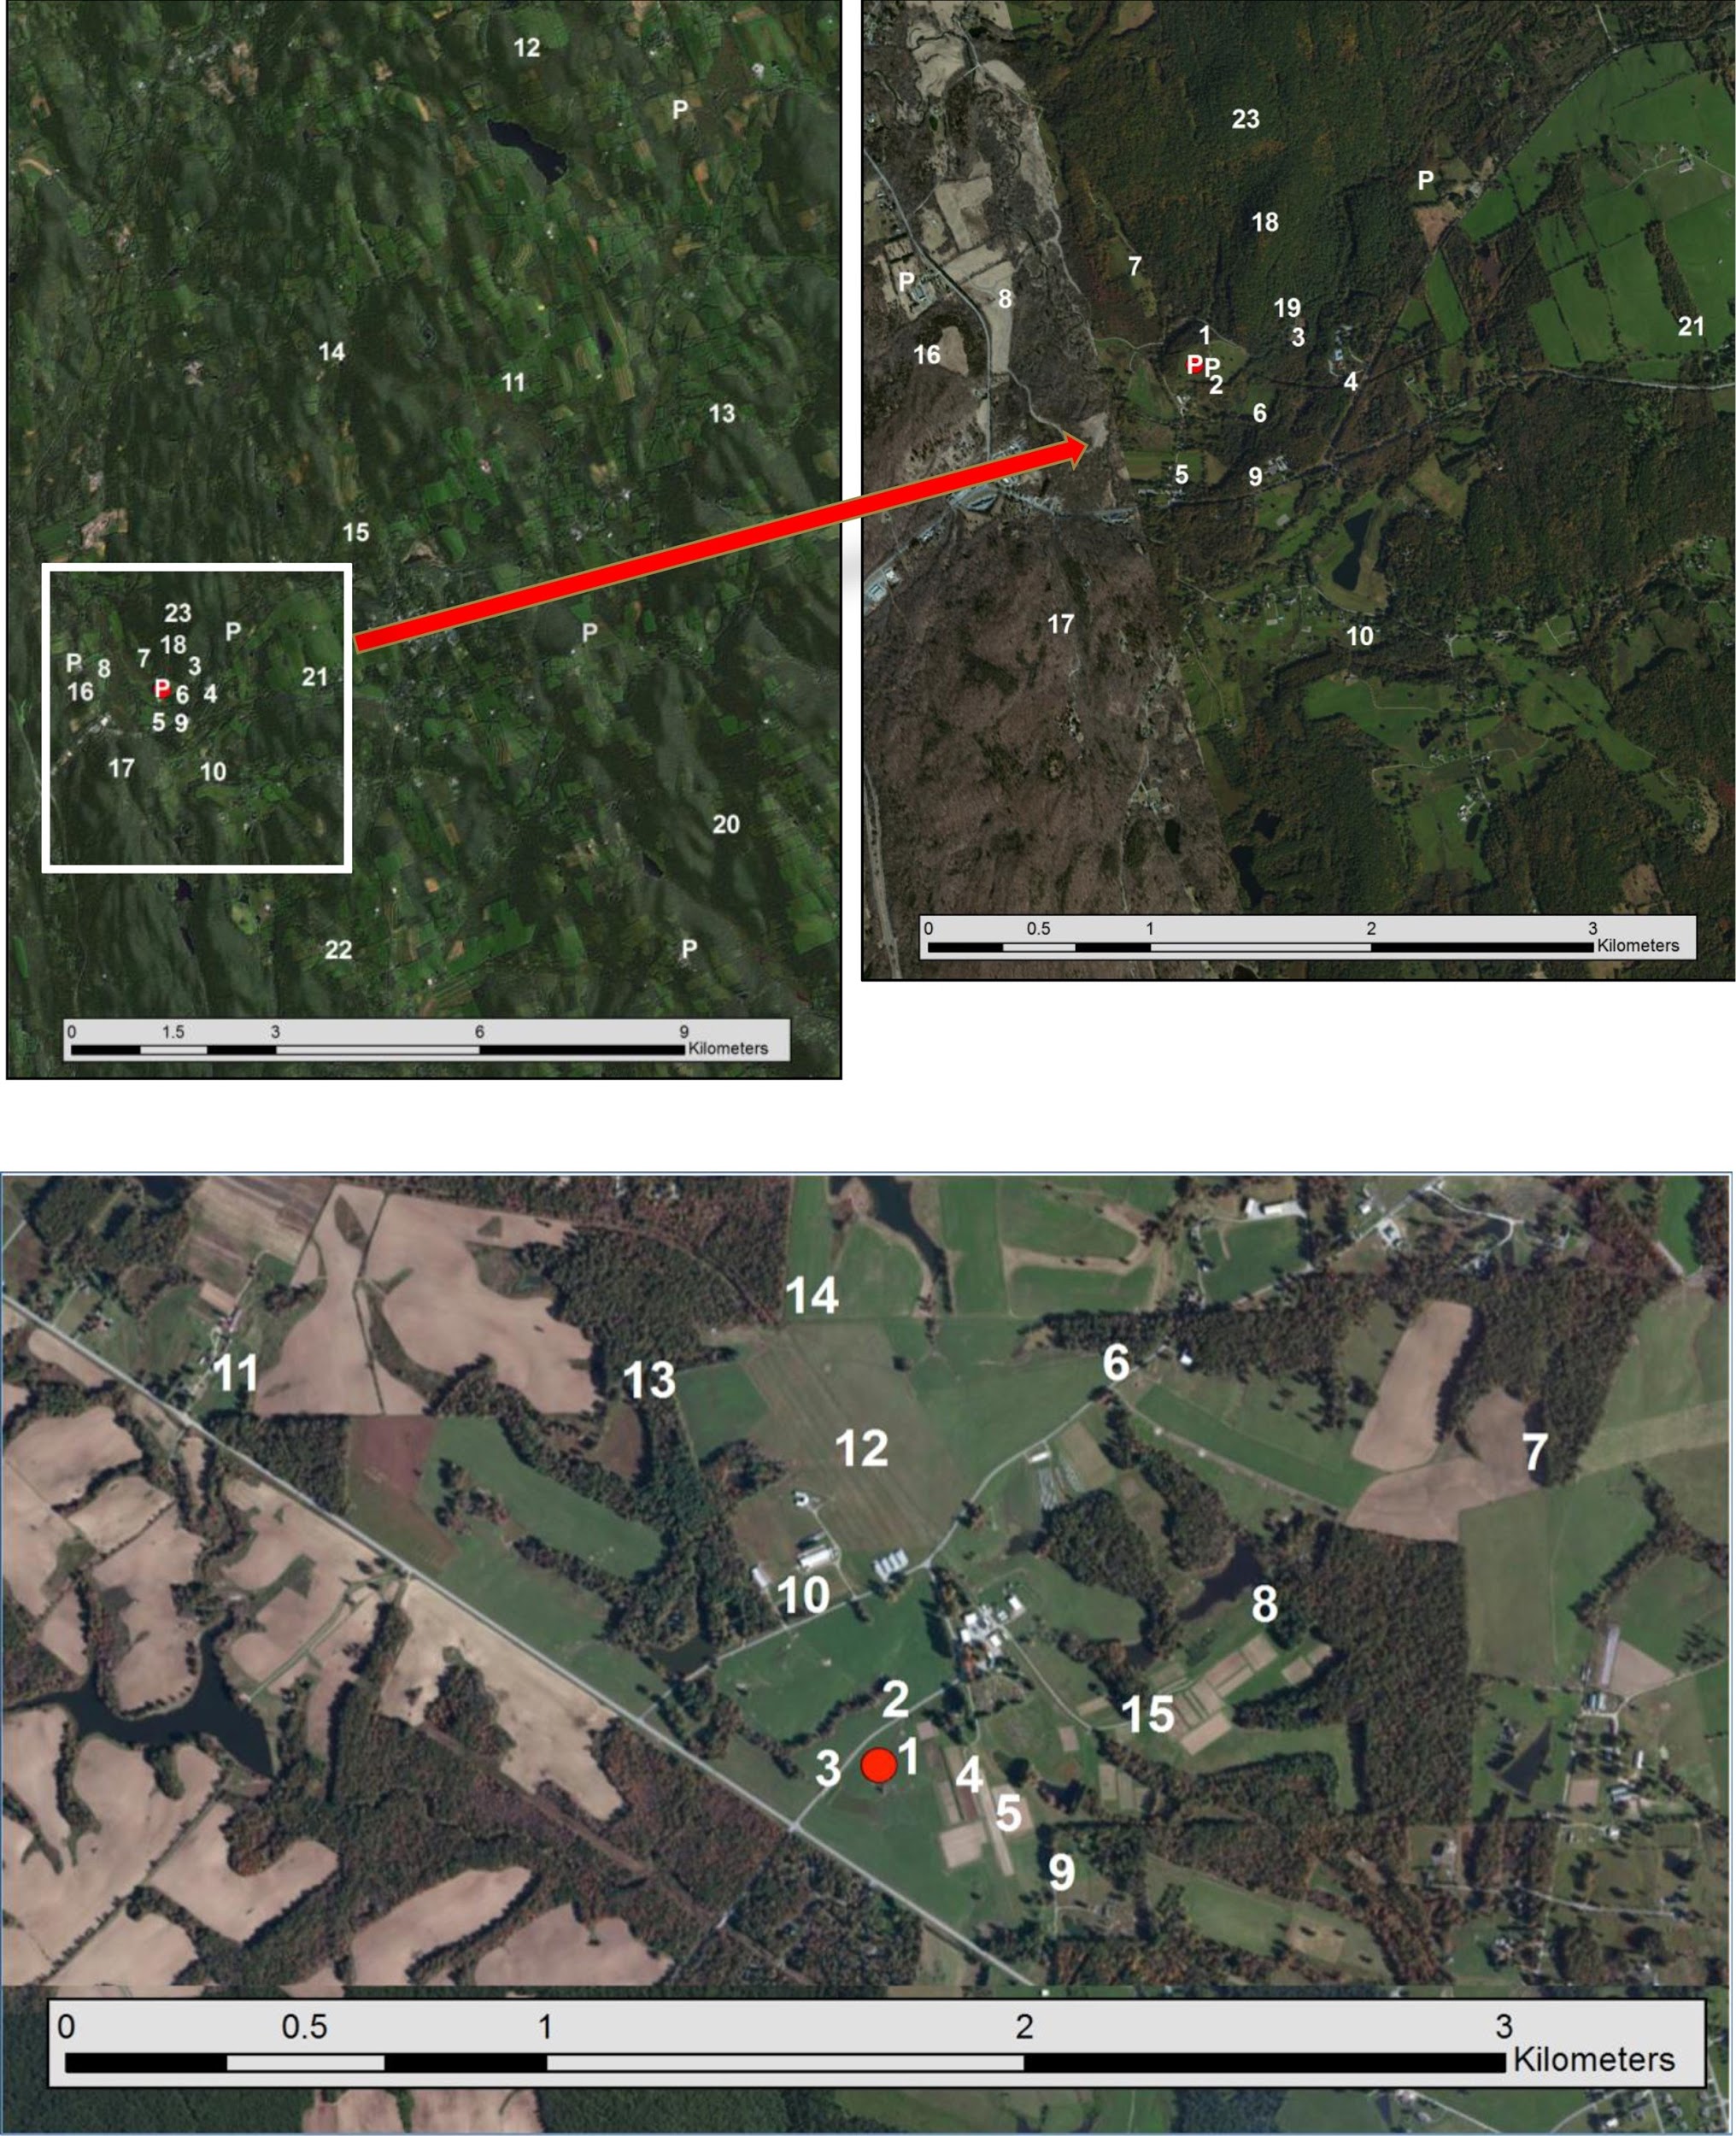
Shown above, is the layout of the temporary network of sensors surrounding the USCRN stations at Millbrook, NY (top) and Crossville, TN (bottom).
National soil-observation networks, supported by NOAA’s United States Climate Reference Network (USCRN), supply indispensable data on the dynamics of soil moisture, but the degree to which a single observing station represents its area remains unclear. CICS-NC’s Jesse Bell worked alongside a number of colleagues, from organizations and universities across the nation and without, to test the accuracy of a single USCRN station when compared to an average generated by a temporary network of sensors on 3 km and 9 km scales. These averages were then used to simulate variability within the areas studied by developing a scaling relationship.
Understanding the variability of soil moisture is important for improving current knowledge on droughts, calibrating land surface models, validating remotely sensed soil moisture, estimating agricultural productivity, and maintaining human health. For example, changes in soil moisture have been shown to be related to outbreaks of coccidioidomycosis (Valley fever). Unfortunately, monitoring networks can only cost-effectively collect data to a certain degree of detail. Seeking a solution, the authors tested the possibility of using scaling relationships to characterize variability surrounding the limited networks of a station.
At the USCRN monitoring station of the Cary Institute for Ecosystem Studies in Millbrook, New York, 16 temporary stations were placed randomly within a 3 km range from the permanent monitoring station, and another 9 stations were scattered inside a 9km radius. Both distances coincide with areas observed by the NASA Soil Moisture Active Passive (SMAP) satellite product, allowing the authors to compare the two soil moisture data sets for improved validation of the satellite estimate. Using a basic linear scaling function and data from network of temporary sensors, the authors upscaled the permanent station’s moisture variability estimates and effectively produced accurate representations of domains larger than the area of the permanent sensors.
The authors find that, once a scaling relationship has been established, approximately a dozen sensors deployed throughout a temporary network are capable of accurately illustrating the variability of a given domain.
Coopersmith, E. J., M. H. Cosh, J. E. Bell, V. Kelly, M. Hall, M. A. Palecki, and M. Temimi, 2016: Deploying temporary
networks for upscaling of sparse network stations. International Journal of Applied Earth Observation and
Geoinformation, 52, 433-444. http://dx.doi.org/10.1016/j.jag.2016.07.013