Satellite proxies for tropical rainfall (shaded) can identify changes in the global circulation (contours). These patterns help the energy sector anticipate changes in demand over the United States
It’s no surprise that energy demand in the United States is driven by changes in temperatures. Forecasting those temperatures as far in advance as possible is a top priority for energy companies. Numerical models are useful for the first week or so, but their skill drops off after that. At these longer leads, forecasters in the energy sector often rely on statistical techniques and historical analogs.
Climate Data Records (CDRs) are ideal inputs into those statistical models. Because CDRs have been homogenized, forecasters can be assured that the model won’t be affected by changes in the data through time. Satellite proxies for tropical rainfall, like outgoing longwave radiation (OLR), are particularly valuable. They can identify patterns in the tropics that drive a significant part of the global circulation. These patterns also evolve slowly enough to provide skill at the longer lead times needed by the energy sector.
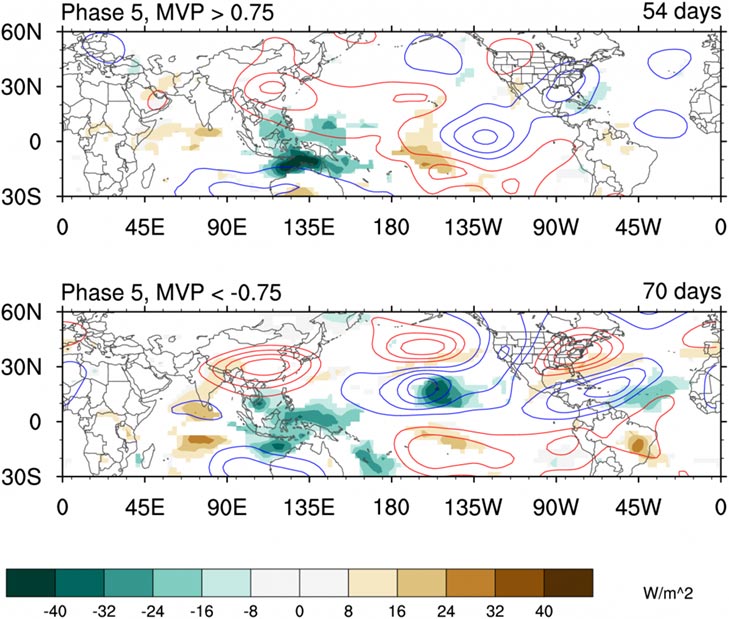
This figure shows an example of how OLR can be used to anticipate weather patterns over the United States. The Madden–Julian Oscillation (MJO) is a large area of tropical rainfall that takes about 30 days to move eastward around the globe. In both panels, the rainfall is enhanced near Indonesia and Australia (green shading). Notice the difference near Hawaii, however. The lower panel has a large area of enhanced rainfall that is absent in the top panel.
The contours identify changes in the global circulation. The red contours generally correspond to areas that are warmer than usual, while the blue contours are cooler than normal. These patterns are practically reversed over North America between the two panels.
These differences can be quite persistent, so we identify them with a newly developed index called the Multivariate Pacific–North American index or MVP. Satellite observations of OLR play a key role in this index. By using the MVP along with other MJO diagnostics on monitor.cicsnc.org/mjo, forecasters in the energy industry will be better prepared to meet the demands of future temperature extremes.
Schreck, C. J., L. Shi, J. P. Kossin, and J.J. Bates, 2012: Identifying the MJO, equatorial waves, and their impacts using 32 years of HIRS upper tropospheric water vapor. J. Climate, In Press, doi:10.1175/JCLI-D-12-00034.1.