Two recent papers by a team of authors, including CICS-NC’s Ge Peng, explore the changing seasonality and regional variability of Arctic sea ice cover. This research provides a more detailed understanding of changes in the timing of critical thresholds, such as the annual start of melting in the spring, and how changes in ice cover patterns vary spatially across the region.
Asheville, NC. (February 5, 2019) — The fact that Arctic sea ice cover is declining rapidly in a warming world is well known (for example, see https://ncics.org/cics-news/arctic-sea-ice-trends-and-projections/). However, while these changes in the annual maximum and minimum ice extent are important, they are not the whole story. The timing of seasonal milestones, such as the start of the melt season in the spring and the start of ice advance in the fall, is also changing. These changes have important implications for society and for efforts to forecast annual sea ice conditions.
Two recent papers from CICS-NC’s Ge Peng and colleagues from the National Snow and Ice Data Center, the University of Washington, and Oregon State University quantify trends in key seasonal thresholds, both for the Arctic as a whole and for twelve subregions. Both papers use data for 1976–2016 derived from the daily passive microwave sea ice concentration climate data record (CDR), which is the result of a collaboration between CICS-NC, NOAA, NASA, and the National Snow and Ice Data Center.
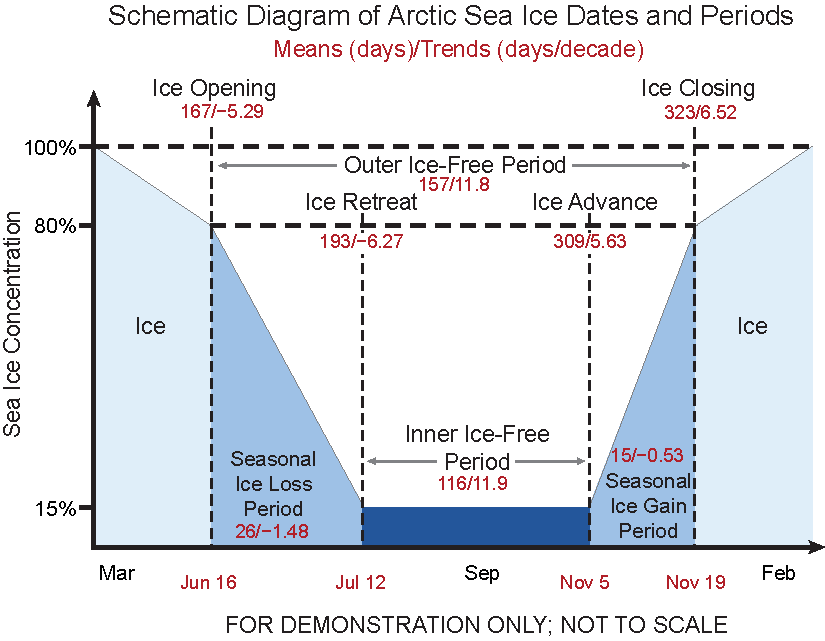
The first paper, published in Remote Sensing, concludes that key dates related to the retreat of the sea ice in spring and summer – including the onset of melt and the dates at which sea ice cover drops below thresholds of 80% and then 15% – are getting earlier at a rate of about 5 days per decade. Similarly, the advance of sea ice cover is starting later in the fall, with the dates at which sea ice cover exceeds thresholds of 15% and then 80% getting later at the same rate of about 5 days per decade.
These threshold metrics serve as useful indicators of a changing climate, but they also provide information that is useful in the shorter term. For example, better data on the timing of melt onset and the seasonal ice loss period in a given year can improve efforts to forecast ice cover extent and the length of the open-water (nearly ice-free) season that summer. This information has implications for navigation, economic activity, and hunting and transportation for indigenous populations as well as for wildlife and ecosystems.
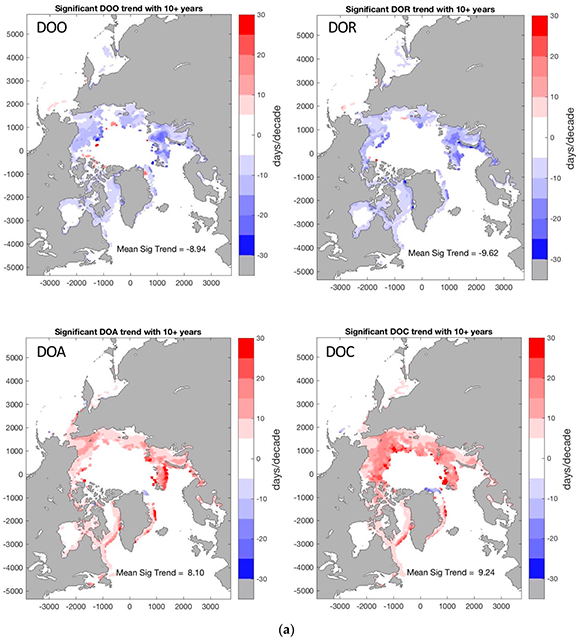
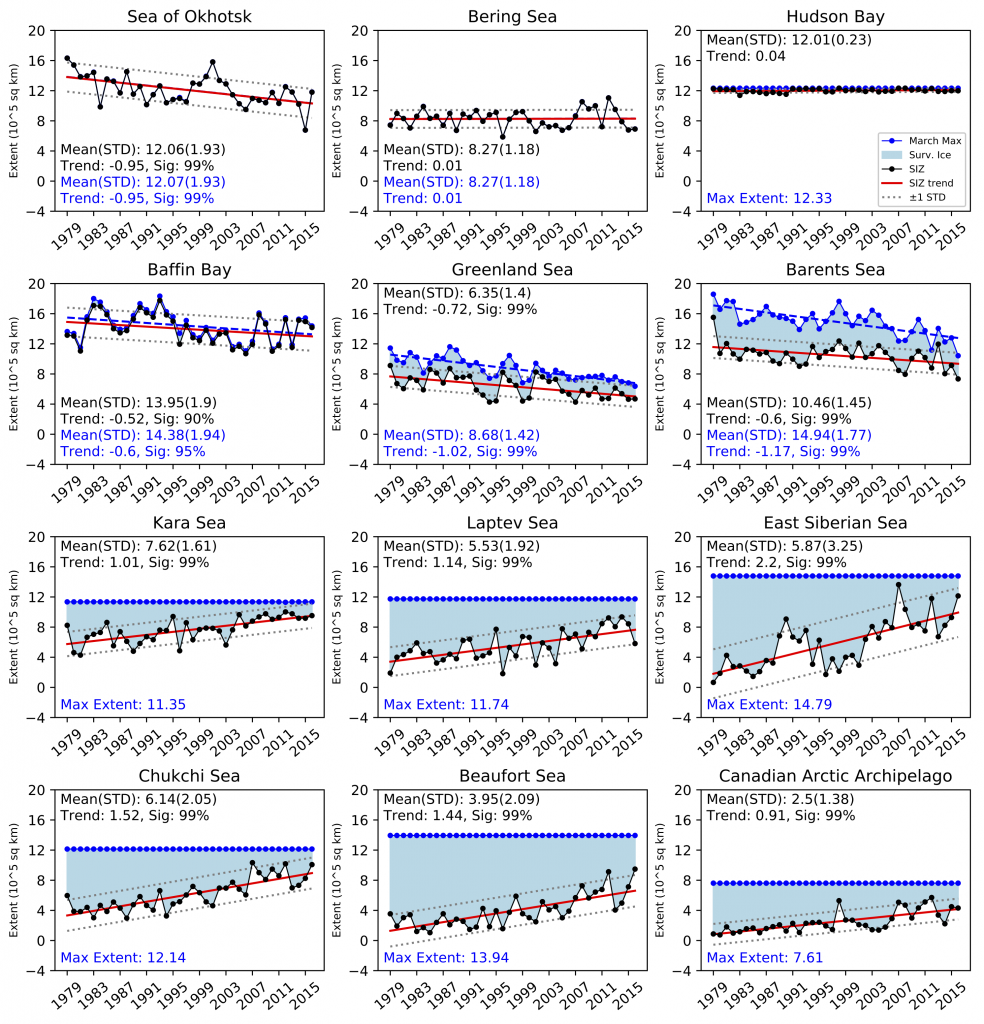
A second study by the same author group published in Environmental Research Letters focuses on the regional variability of the dates of these key seasonal thresholds and period. The study divides the Arctic into twelve regions, with varying geography and weather patterns. For example, the Barents Sea is an open ocean with a southern peripheral boundary, while Hudson Bay is landlocked in the central Arctic. Both winter sea ice extent and summer retreat vary from year to year in the Barents Sea, while Hudson Bay sees more consistent conditions, being fully ice-covered each winter and almost entirely free of ice each summer.
A key conclusion of the paper is that the seasonal ice zone (SIZ) – the area in which sea ice advances and retreats each year – is generally expanding. This is consistent with the declining trend in overall sea ice extent. The inner ice-free period – where ice extent is below the 15% threshold – is also expanding. This increases the amount of solar radiation that is absorbed by the oceans rather than being reflected by ice cover during the melting season, which tends to further increase the long-term trend towards reduced ice volume. The authors report trends for nine different metrics for each of the twelve regions (some metrics do not apply for all regions).
Together, these papers advance our understanding of key seasonal and regional aspects of ongoing, rapid changes in Arctic sea ice cover. The data (Steele et al. 2019) will soon be available from NSIDC.
Citations
Peng, G., M. Steele, A. Bliss, W. N. Meier, and S. Dickinson, 2018: Temporal means and Variability of Arctic Sea Ice Melt and Freeze Season Climate Indicators Using a Satellite Climate Data Record. Remote Sensing, 10, 1328. http://doi.org/10.3390/rs10091328
Bliss, A. C., M. Steele, G. Peng, W. N. Meier, and S. Dickinson, 2019: Regional variability of Arctic sea ice seasonal change climate indicators from a passive microwave climate data record. Environmental Research Letters, In press. http://dx.doi.org/10.1088/1748-9326/aafb84
Steele et al., 2019. Arctic sea ice seasonal change and melt/freeze climate indicators from satellite data. Boulder, Colorado USA. National Snow and Ice Data Center Distributed Active Archive Center. doi: 10.5067/KINANQKEZI4T. (forthcoming)
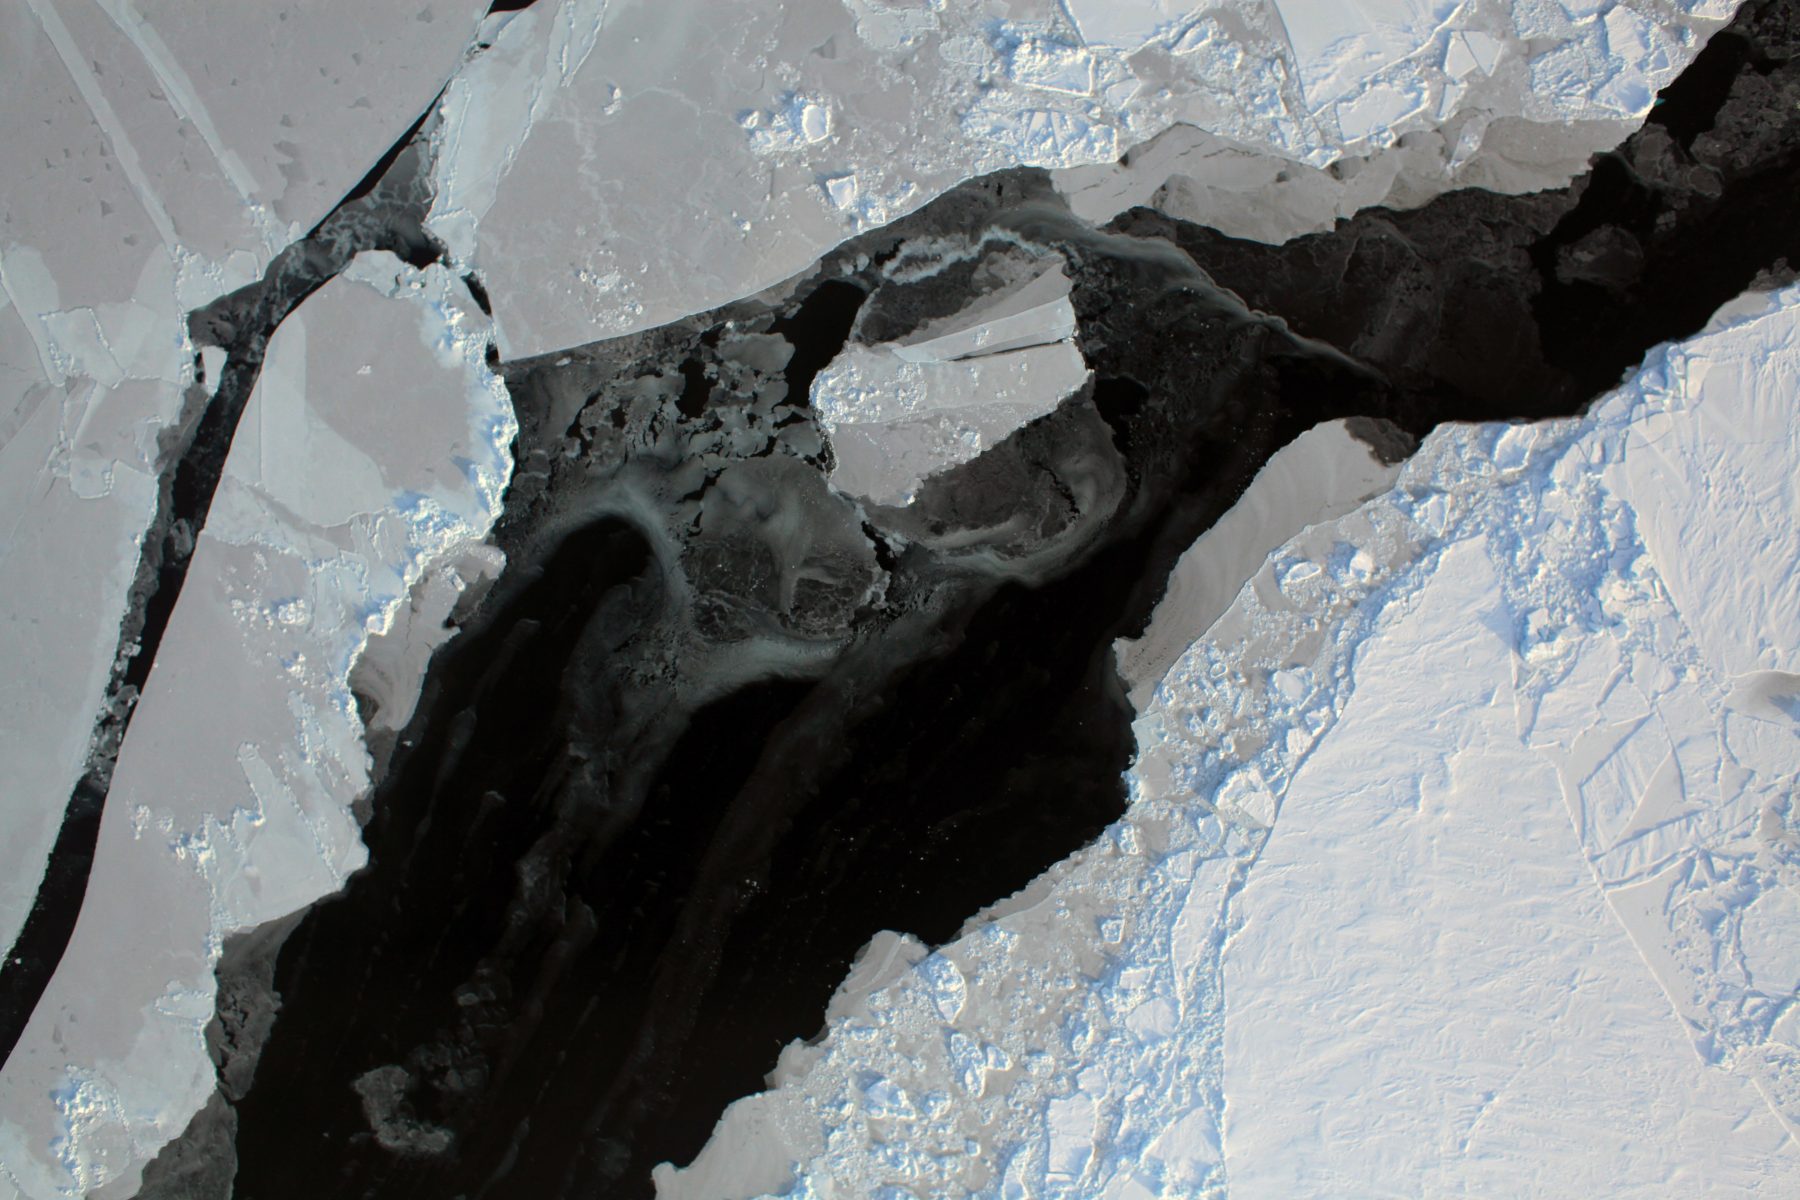
Banner photo: Photo: NASA/GSFC. https://www.flickr.com/photos/gsfc/7873353514/