Climate and weather events cause billions of dollars of economic damages every year in the United States. The U.S. Global Change Research Program (USGCRP) Billion-Dollar Disasters indicator shows that these events are happening more often, due in part to climate change. Indicators such as these can help us see trends in climate-related events and make decisions that ultimately lead to communities becoming more resilient.
From 1980 to 2021, the U.S. experienced 323 weather and climate disasters with overall damage costs reaching or exceeding $1 billion, adjusted for inflation (Figure 1). The cumulative cost of all 323 events exceeds $2.195 trillion. All U.S. states, Puerto Rico, and the Virgin Islands have been affected by at least one billion-dollar disaster since 1980.
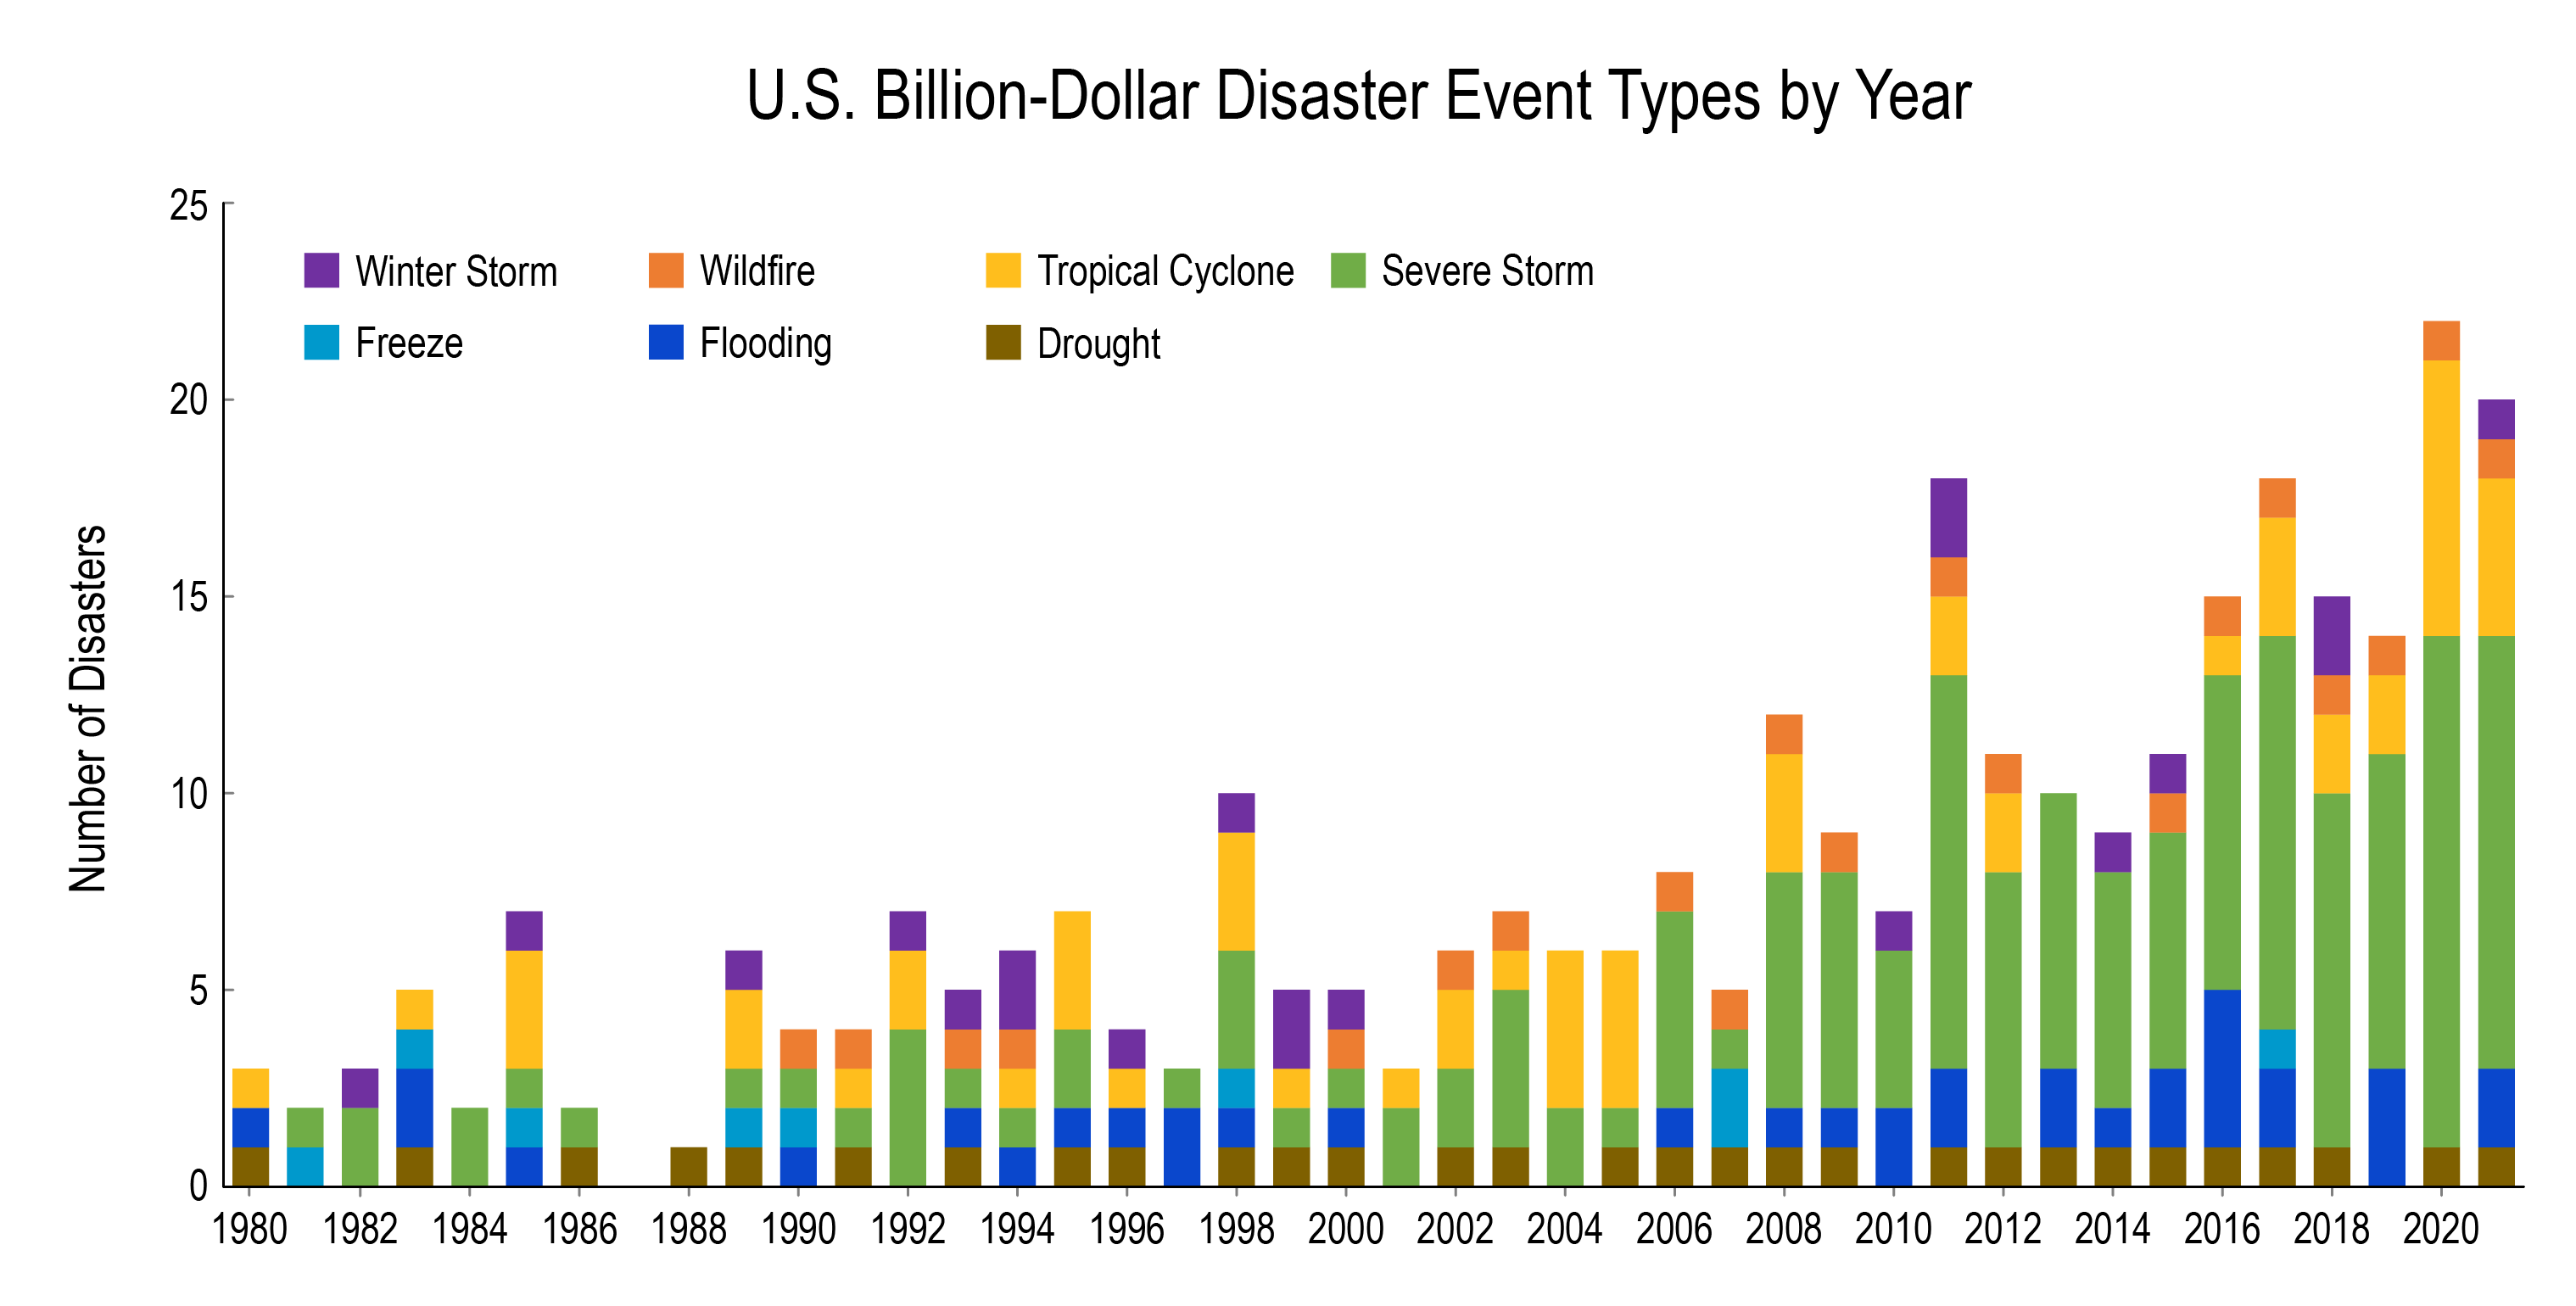
Figure 1: The Billion-Dollar Disasters indicator shows the number of individual climate and weather events that caused more than one billion dollars of direct losses each year. The length of each bar corresponds to the annual number of events. These events are binned into seven hazard types, each represented by its own color. Source: USGCRP.
The USGCRP Indicator Platform provides a suite of climate-related indicators, ranging in scope from greenhouse gas concentrations to societal impacts, such as billion-dollar disaster events. These indicators allow users to stay updated about climate-related changes that can impact everyday lives. The platform is guided by the USGCRP Indicators Interagency Working Group (IndIWG), which highlights federal agency research and data and supports the National Climate Assessment and other USGCRP products.
As members of the IndIWG, NCICS’s Laura Stevens and NCEI’s Jessica Blunden facilitate the development and maintenance of USGCRP indicators. They have been instrumental in keeping information on the platform relevant by updating indicators on an annual basis, and they work directly with scientists at various federal agencies to add new content each year. The methods behind all of the USGCRP indicators are well-documented and easily accessible by National Climate Assessment authors and the general public alike.
Stevens notes that “In order to evaluate the impacts of climate change, we first need to understand how our climate is changing. Indicators like those on the USGCRP platform are an excellent way to illustrate how environmental conditions are changing over time, which can ultimately help us evaluate climate impacts, risks, and vulnerabilities.”
The Billion-Dollar Disasters indicator is one such example. Data available on NOAA NCEI’s website provide insight into the costs of these major events as well as the frequency at which they are occurring in the United States. The weather and climate disasters included in the NCEI analysis are drought/heat wave, flooding, hail, hurricane, tornado outbreak, severe weather, wildfire, and winter storm/cold wave. The time series and mapping tools provide county-level information across the United States and allow users to explore information most relevant to them. Recent additions to the NCEI site also allow users to explore how these climate and weather events interact with indicators of social vulnerability.
Although every state has been impacted by at least one billion-dollar disaster since 1980, the southeast region (AL, FL, GA, NC, SC, VA) experiences a higher frequency of these disasters than other parts of the country (Figure 2).
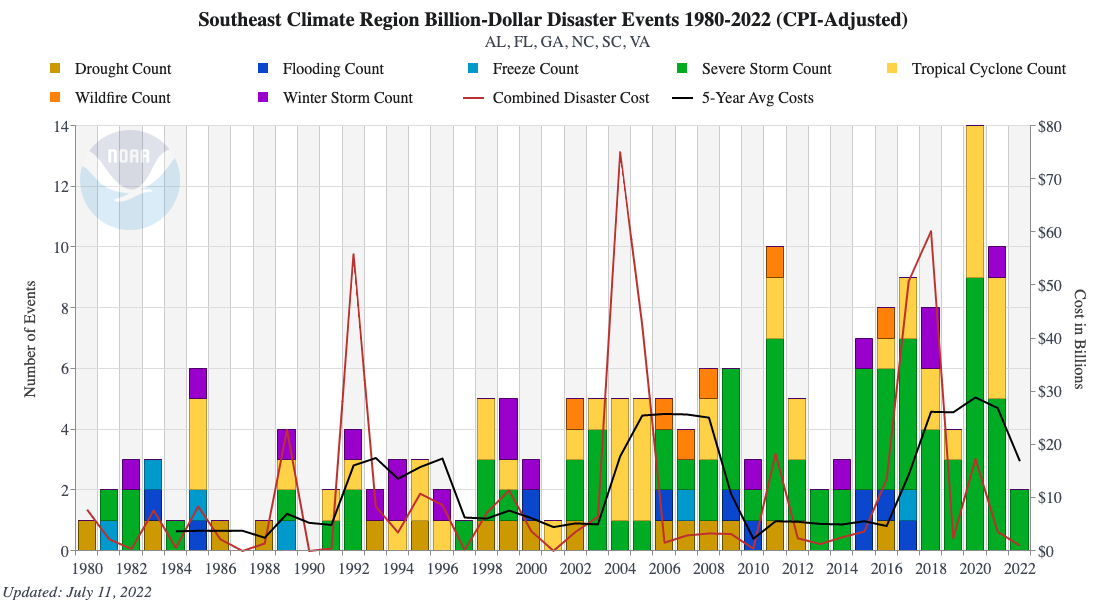
Figure 2: As an example of how data can be customized to the user, this bar graph shows the number of individual billion-dollar disaster events and associated costs for the southeast region. Source: NOAA NCEI.
Nationwide, there were 20 total events in 2021 with damages exceeding $1 billion (Figure 3), the second-highest annual total after 2020, which had 22 events. Hurricane Ida was particularly damaging in 2021, causing $75 billion in damages.
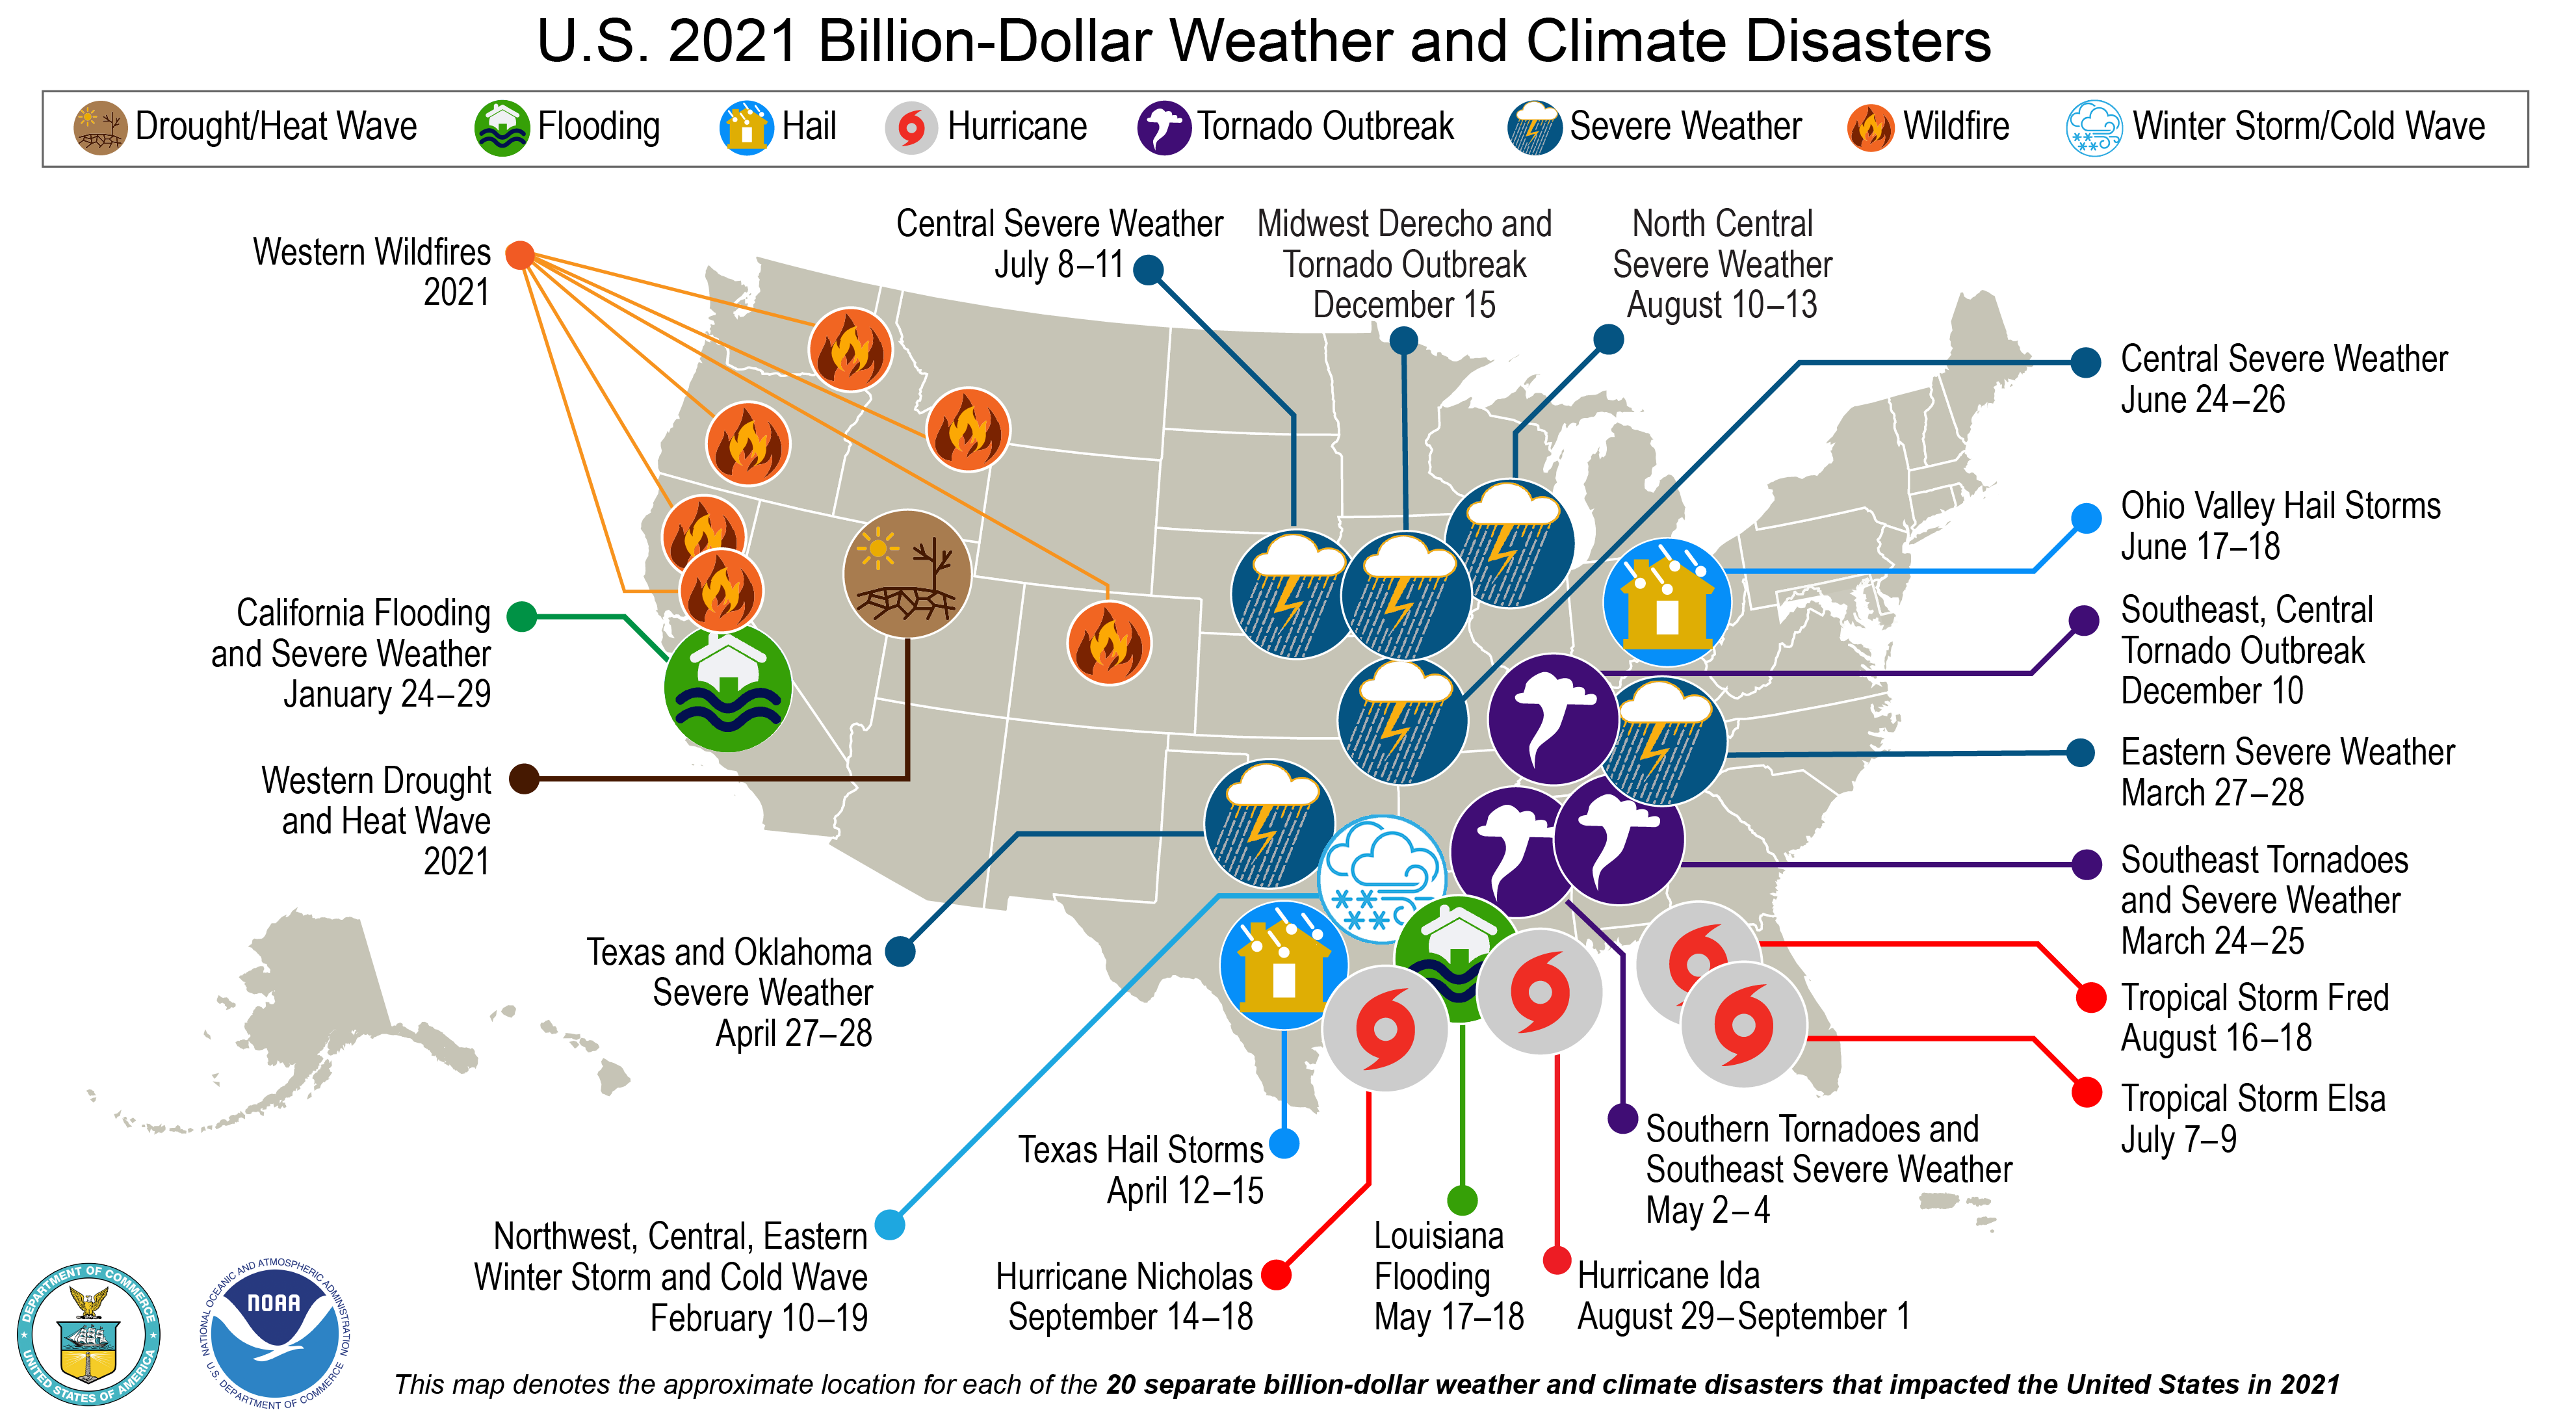
Figure 3: The map shows billion-dollar events in the United States during the year 2021. These events include drought/heat wave, flooding, hail, hurricane, tornado outbreak, severe weather, wildfire, and winter storm/cold wave. Source: NOAA NCEI
In addition to direct threats to life and safety, major weather and climate disasters claim property, disrupt business, and affect daily life. Climate change is playing a role in the increasing frequency of some types of extreme weather that lead to billion-dollar disasters. It is important to monitor and collect as much data as we can to help prepare.
Resources:
- USGCRP Billion-Dollar Disasters Indicator
- NOAA NCEI Billion-Dollar Weather and Climate Disasters
- NOAA Climate.gov: 2021 U.S. billion-dollar weather and climate disasters in historical context
- Fourth U.S. National Climate Assessment: Water-Related Billion-Dollar Weather and Climate Disaster Events in the United States
Media Contact
Tom Maycock
Science Public Information Officer
NC State University’s North Carolina Institute for Climate Studies
tmaycock@ncics.org
828-271-4272