Building on a decade of experience and innovation, CISESS staff at the NOAA Assessments Technical Support Unit made major contributions to the Fifth National Climate Assessment.
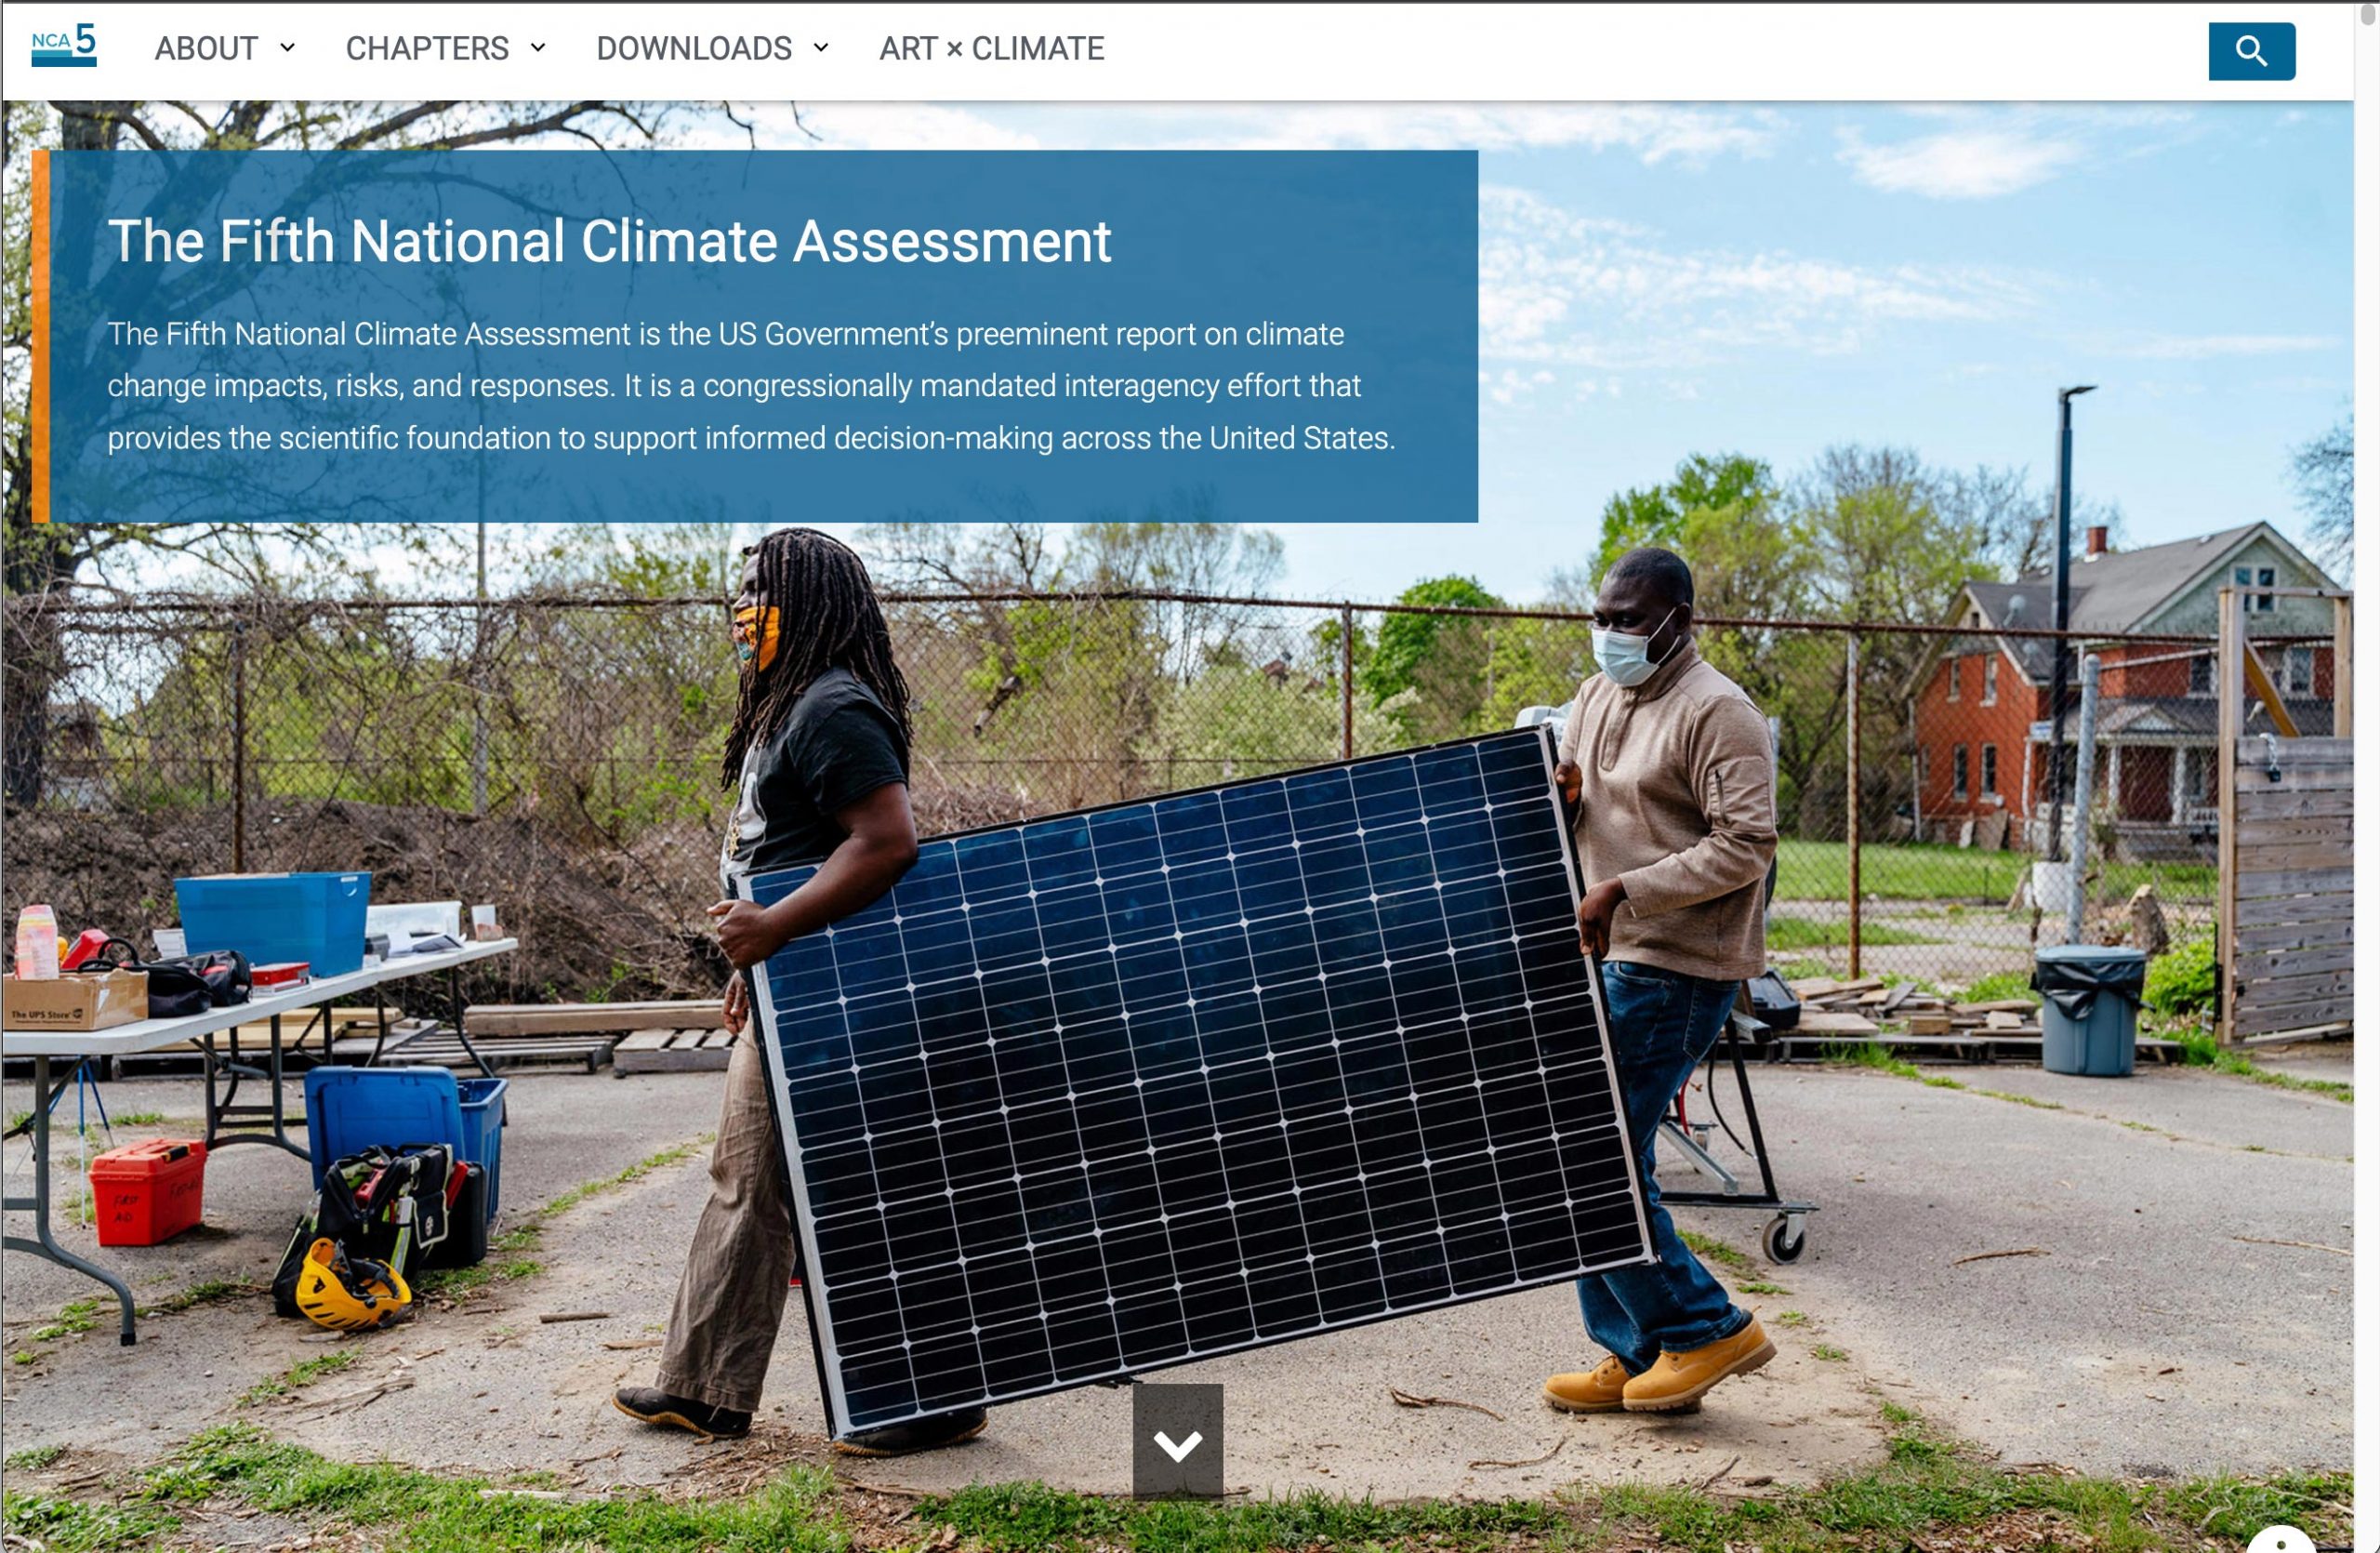
On November 14, 2023, the U.S. Global Change Research Program (USGCRP) released The Fifth National Climate Assessment (NCA5). This important report, which advances our understanding of climate change, its impacts on the United States, and efforts to respond to the challenges it presents, is available now at https://nca2023.globalchange.gov.
Scientists and other experts from CISESS constitute most of the staff of NOAA’s Assessments Technical Support Unit (TSU), which is based at NOAA’s National Centers for Environmental Information (NCEI) in Asheville, North Carolina. Working alongside federal and contractor colleagues at NCEI and USGCRP, the scientists and other experts at CISESS support the work of more than 400 authors and contributors with scientific analyses, project management, software engineering, web development, metadata collection, editorial support, data visualization, and graphic design.
Key accomplishments and innovations for NCA5 include the following:
Science
Led by Dr. Kenneth Kunkel, the TSU science team implemented a full suite of cloud-based CMIP6 analysis tools and generated multiple figures for the report based on these analyses. The effort to move away from on-premises computing infrastructure leveraged the experience of multiple IT experts at CISESS who have been supporting other cloud-transition activities. These efforts also pave the way for much faster and more cost-effective analyses of massive climate datasets in the future.
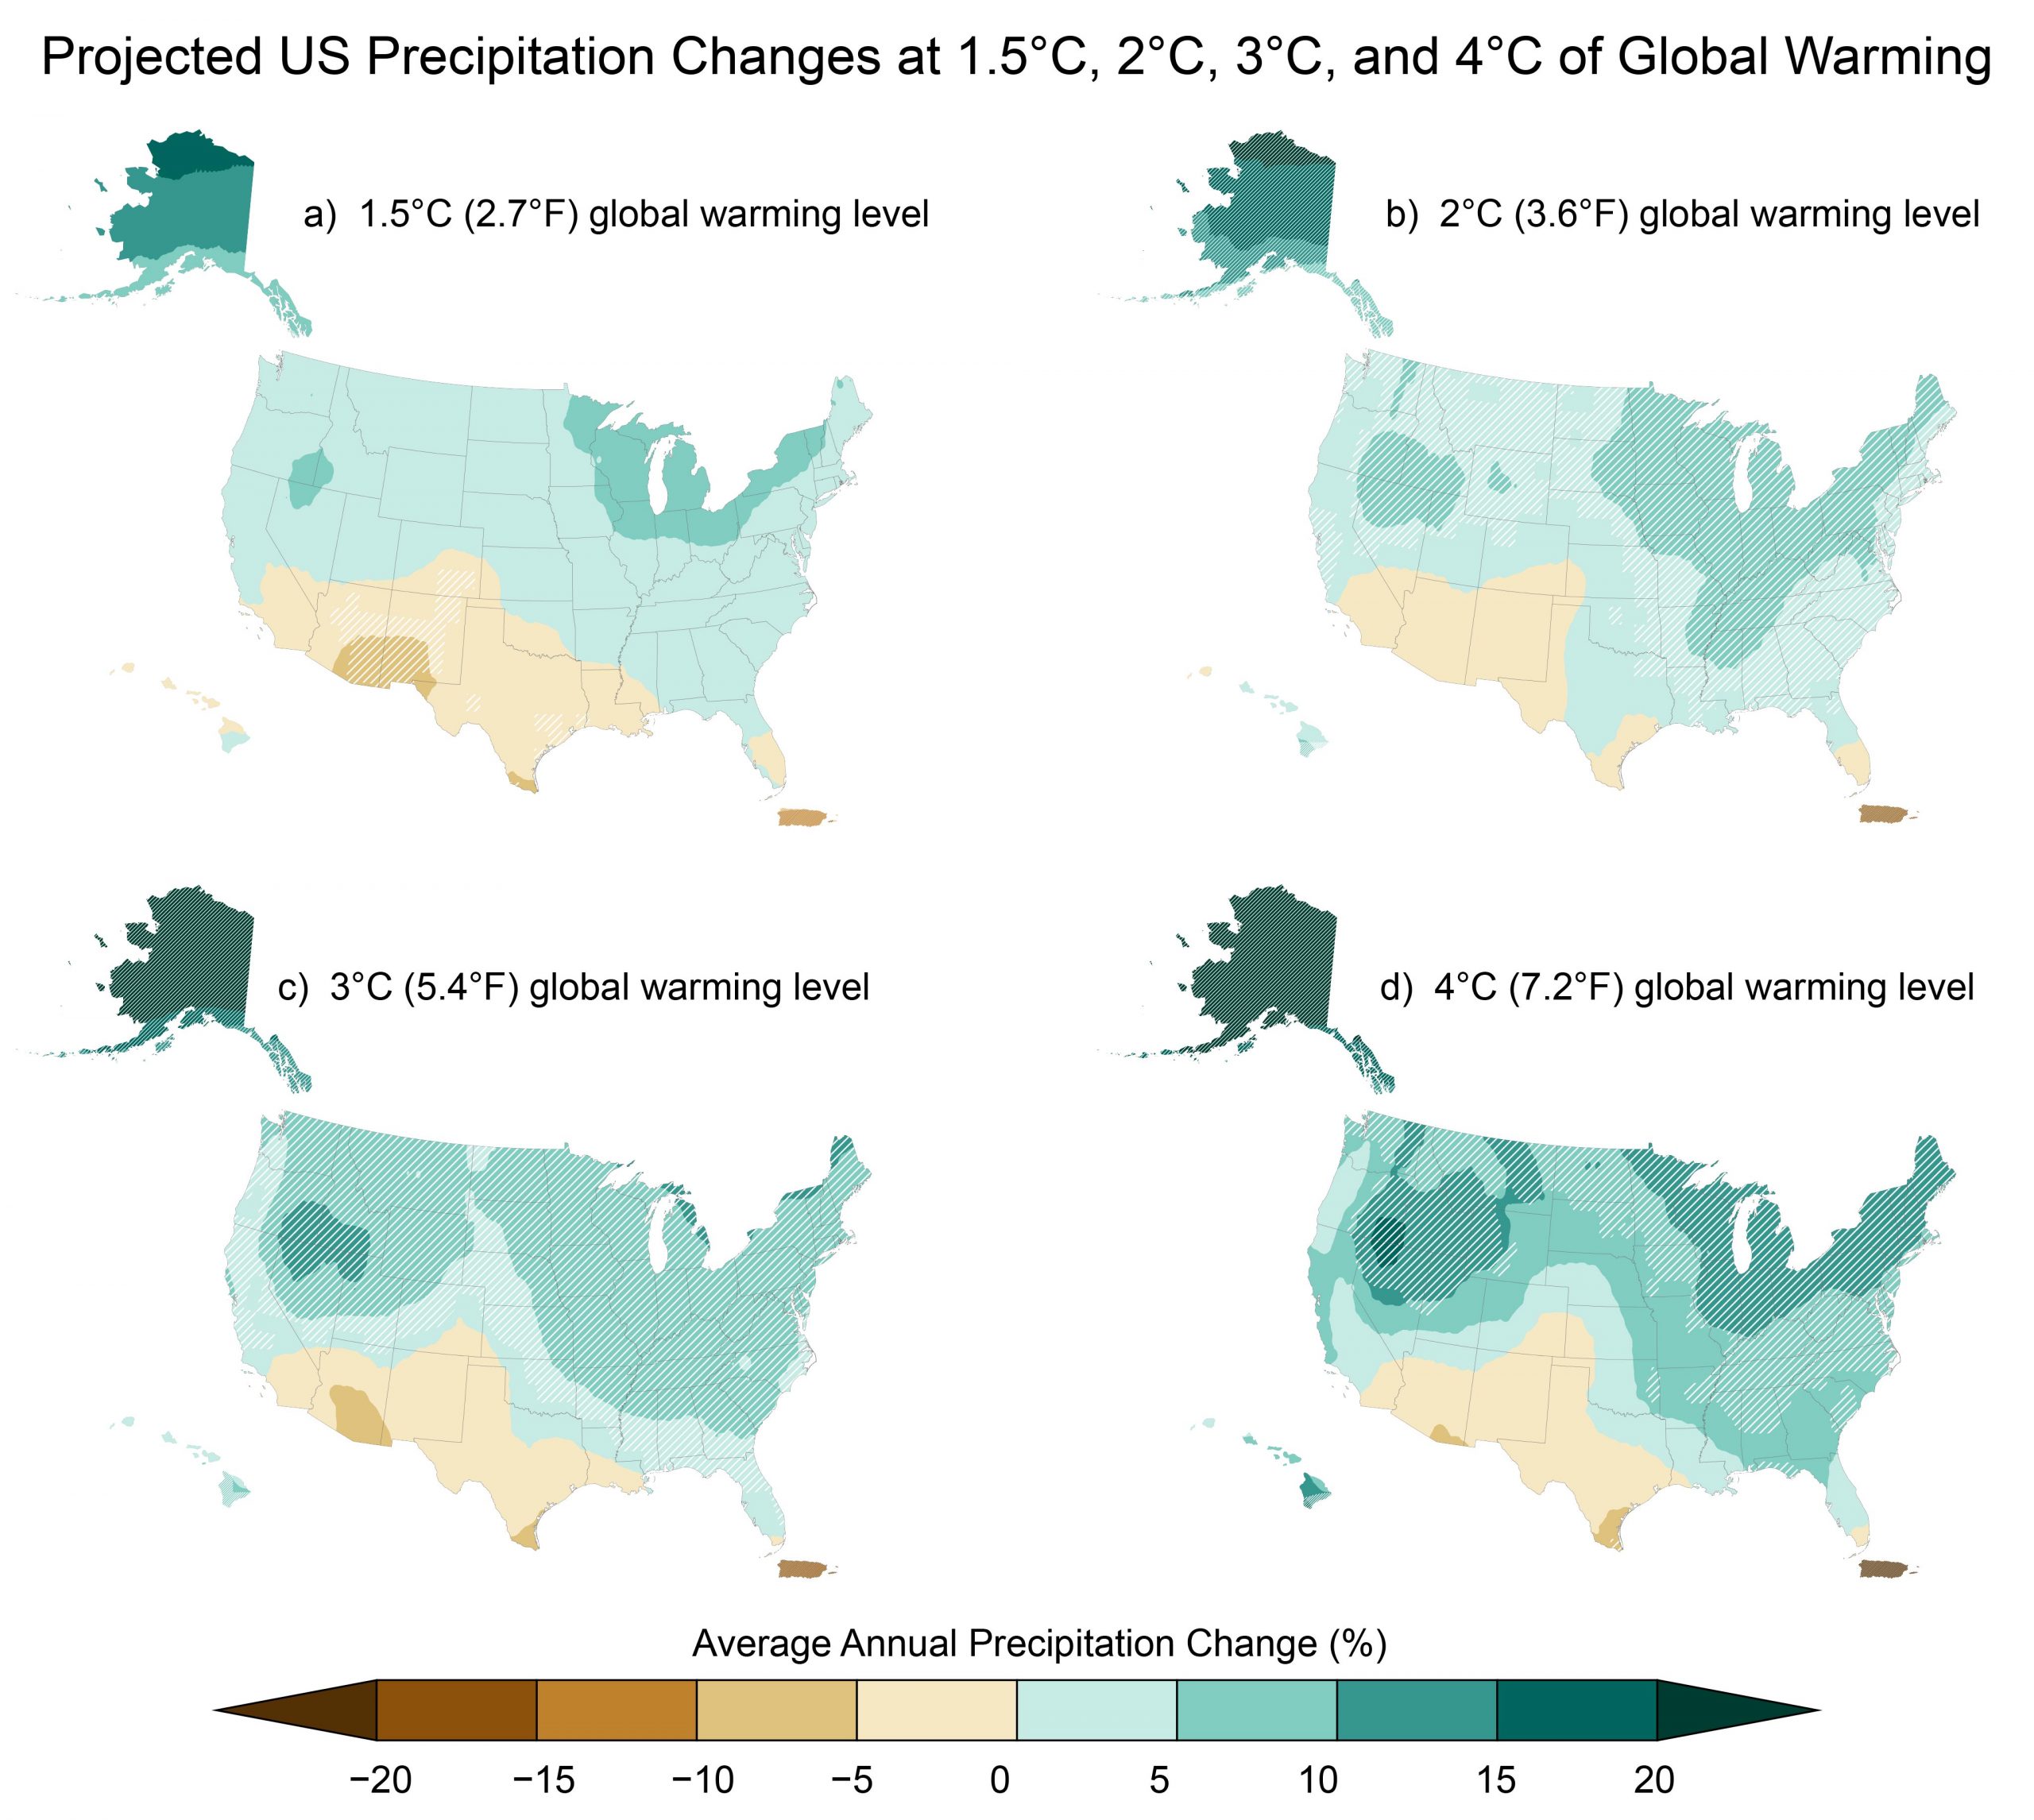
The team also developed multiple figures using results from two new methods for generating downscaled climate model projections for the U.S. (LOCA2 and STAR) and provided GIS and other data visualization support for dozens of other figures.
In addition, Laura Stevens from the science team served as the lead author for the Indicators Appendix.
Science Communications
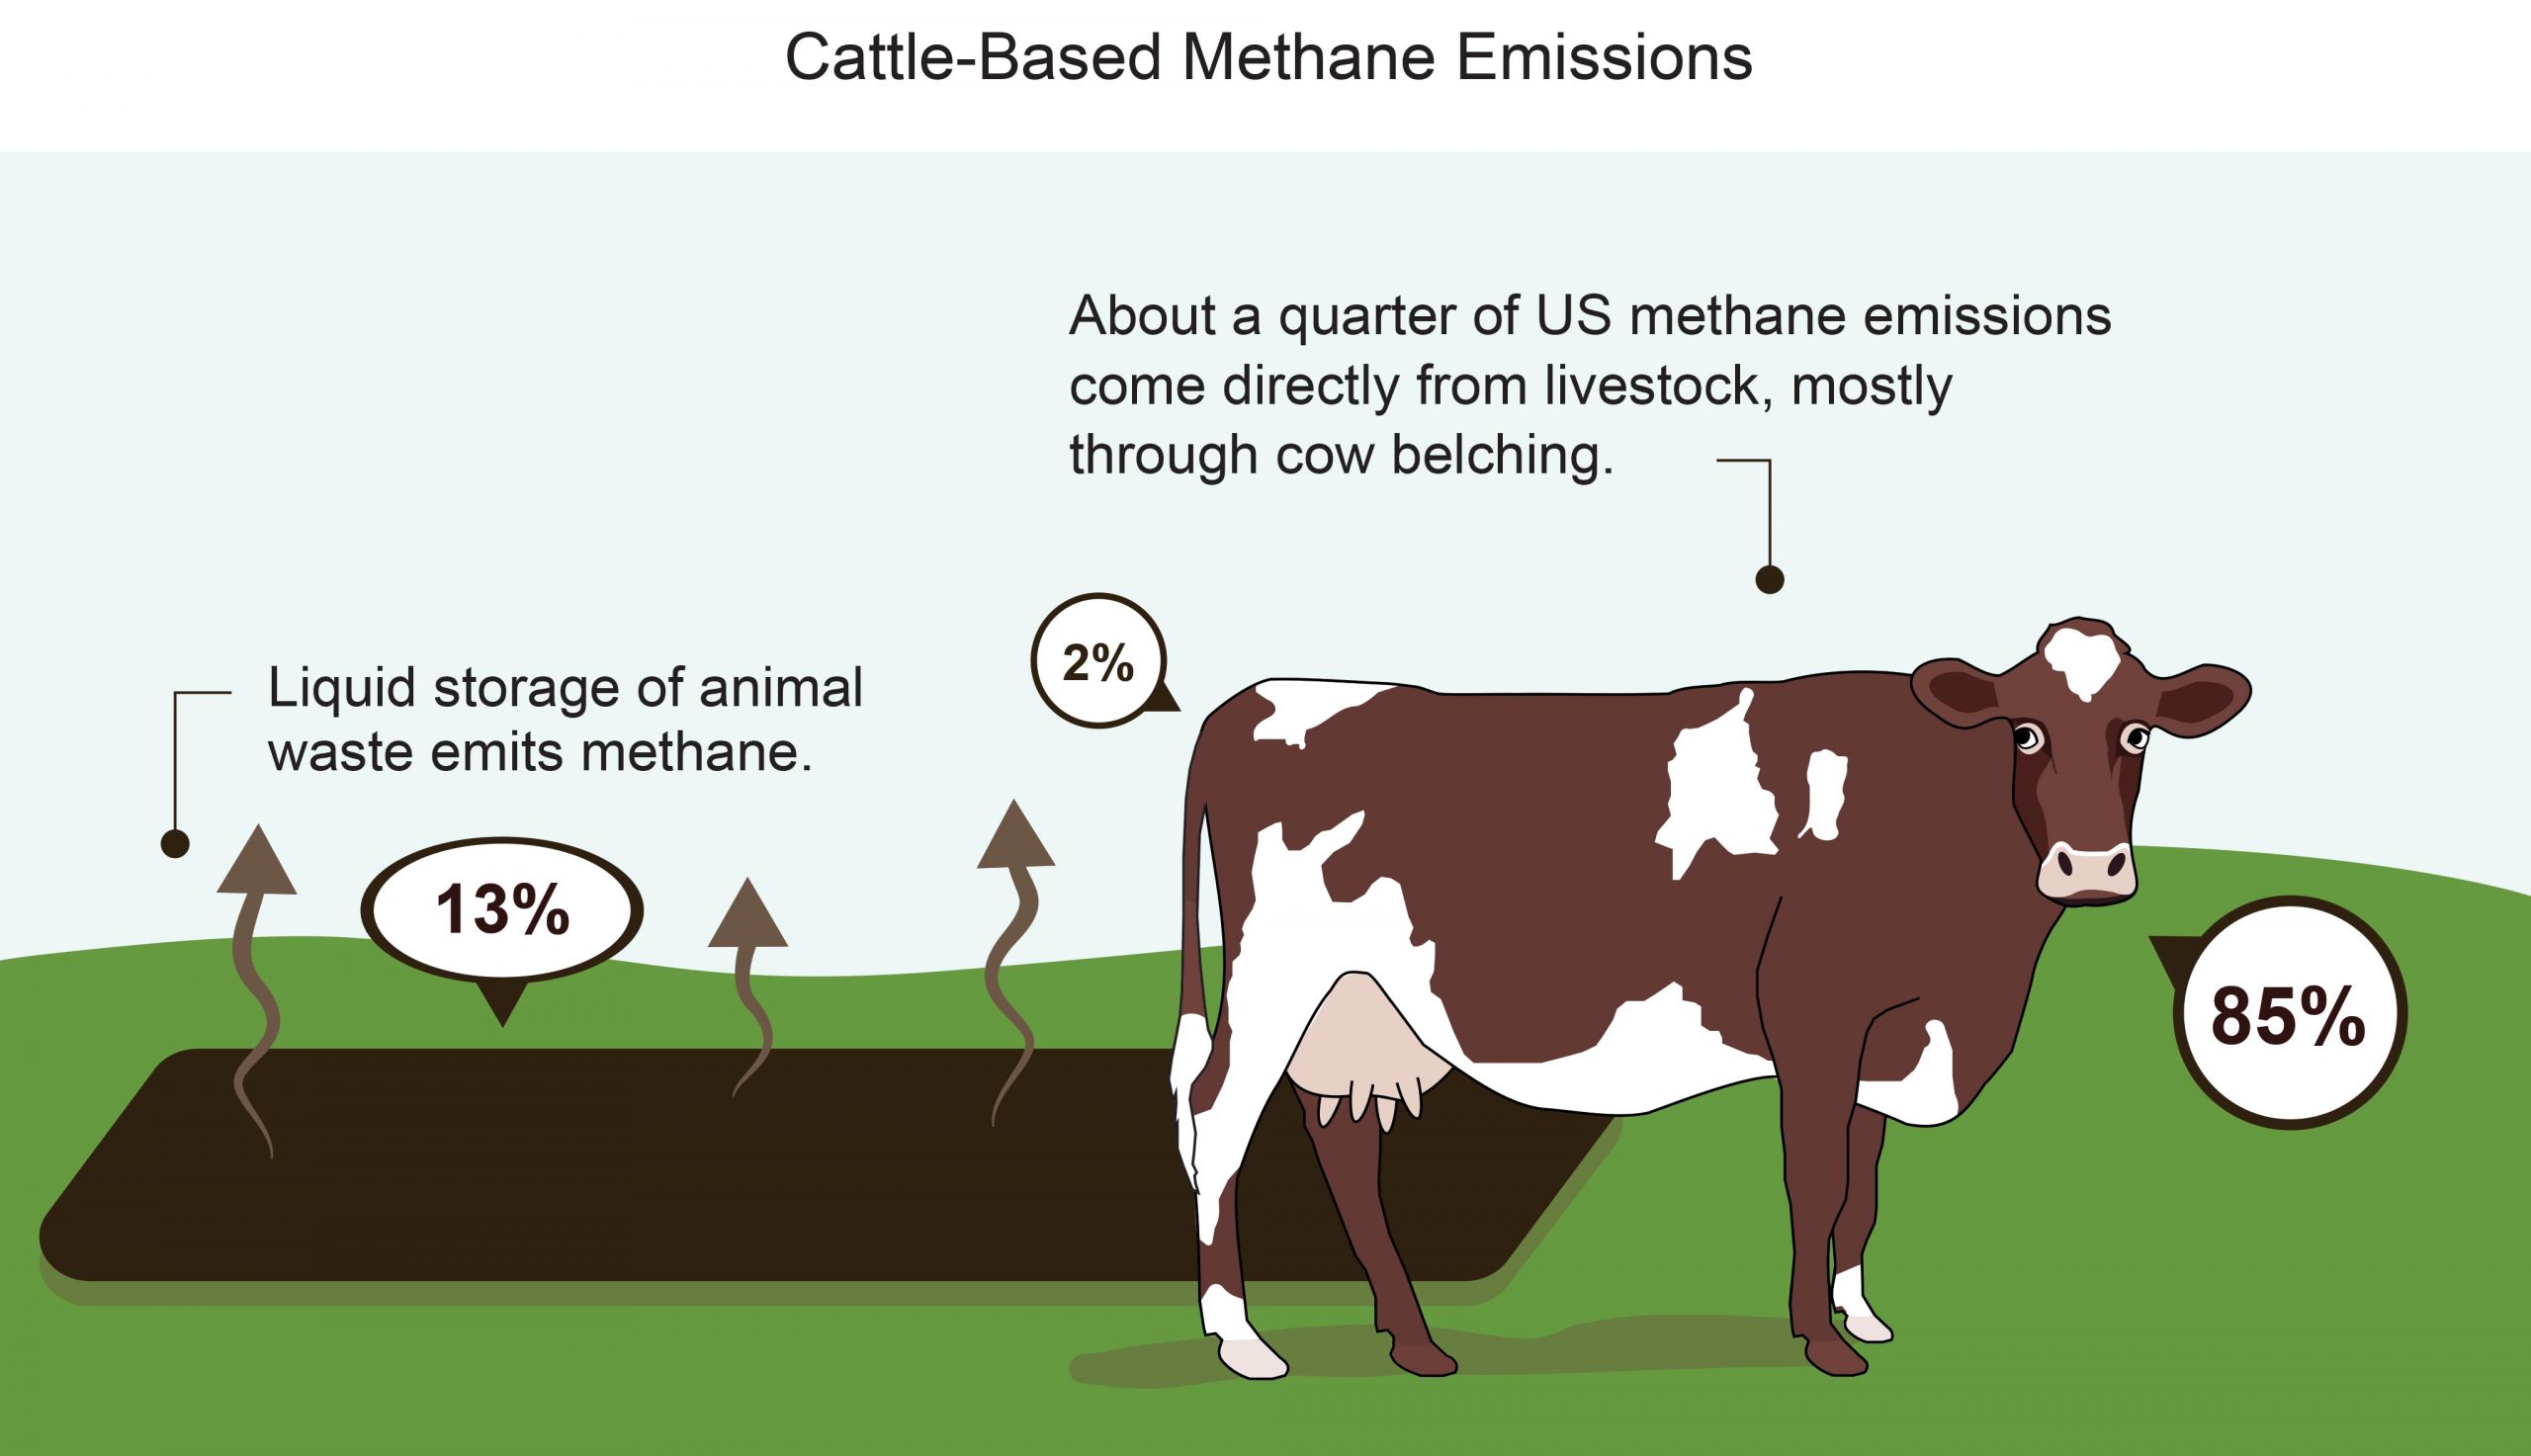
Science communications experts drafted extensive author guidance and provided multiple rounds of scientific, technical, and copy-editing reviews for each of the more than 40 chapters and appendices in the report. The team engaged in more than 200 meetings with authors, most of which focused on helping authors develop effective and accessible figures. Visual communication and data visualization experts at the TSU produced dozens of figures for the report and enhanced the design of virtually every figure. The editorial team made significant contributions to the report glossary and wrote alternative text descriptions for every figure, giving visually impaired users access to the key points of each figure via screen reader tools.
Software Engineering and Web Development
In addition to supporting the science team’s transition to cloud-based processing, the team implemented a major upgrade to the custom-designed Assessment Collaboration Environment website, which was used by the TSU, USGCRP, and more than 400 authors and contributors to manage author onboarding and intellectual property rights management, deliver guidance documents and technical resources, support the development of nearly 400 figures, provide access to chapter drafts, and collect and curate metadata and copyright information for every figure in the report.
The team also designed the innovative new website used to deliver the report. Some of the key features include expandable/collapsible content sections and improved search capabilities to make it easy to find and read relevant information, extensive cross-reference hyperlinks to facilitate access to related information on many topics, the ability to view all figures and all key messages on single pages, extensive support for accessibility, and extensive integration of the many artworks submitted as part of the Art × Climate project.
Data
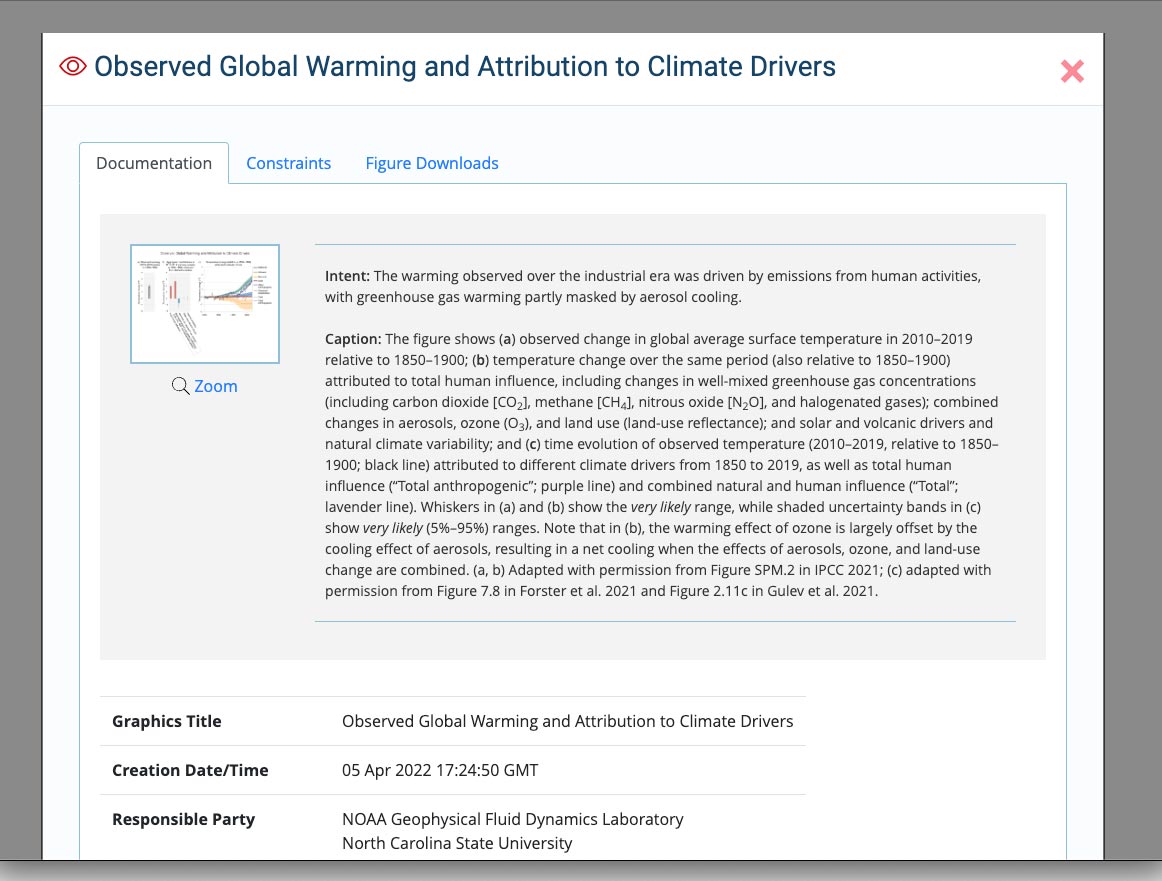
As in the Fourth National Climate Assessment (2018), complete metadata is provided for every figure in the report. A new version of the metadata viewer provides enhanced access to figure information and underlying datasets, as well as the option to download computer code used to generate many of the figures.