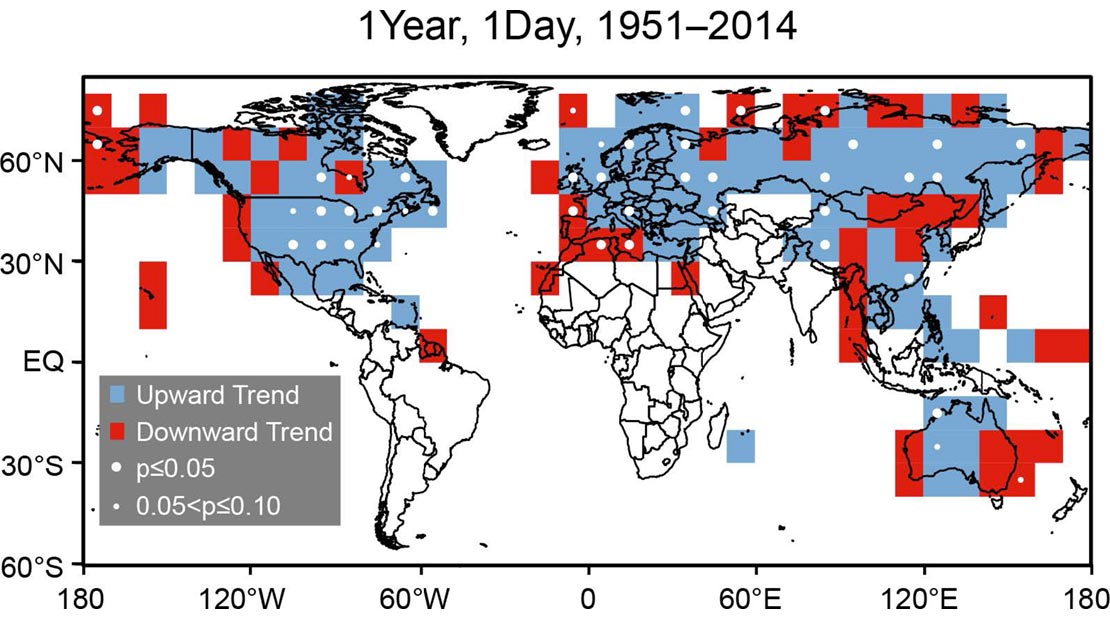
The 1951–2014 trend of number of 1-day total precipitation events exceeding the station-specific threshold for an average 1-year recurrence Interval (POT1d1y). White dots indicate that the trend is significant at the p = 0.10 (small dots) or p = 0.05 (large dots) level
In an article published in the Journal of Extreme Events, CICS-NC’s Kenneth Kunkel and Rebekah Frankson analyze trends in heavy precipitation events and their relationships to expectations for a warming world. They also explore issues related to the availability of precipitation data and associated limitations for evaluations of observed vs expected trends. For areas where sufficient data is available, the authors found statistically significant increasing and decreasing trends in many locations, with more areas experiencing increases than decreases.
The paper notes that precipitation data is generally sparse in Central and South America, Africa, the Middle East, and southern Asia. The resulting poor coverage across the Southern Hemisphere, the tropics, and the Northern Hemisphere subtropics makes it difficult to identify or analyze variations in how precipitation is responding to warming across different latitude zones.
Data availability also varies over time. For the Global Historical Climatology Network–Daily (GHCN–D) dataset used for the trend analyses, the number of suitable stations drops off dramatically for the most recent years. This is largely due to the time lags involved in incorporating data from outside the United States, and serves to increase uncertainty in the most recent trend estimates. There are also other significant regional limitations. For example, there is very little data beyond the early 1970s for the Middle East–South Asia region.
The trend analysis evaluated several “points over thresholds” (POT) metrics, including one-day exceedance of annual and 10-year recurrence intervals, five-day events exceeding 10-year recurrence periods, and daily events exceeding the 99th percentile of events throughout the period of record.
Time series for north of 30° in the Northern Hemisphere show generally increasing trends since the mid-1970s. Maps presented in the paper show spatial variations, with the area experiencing increases being roughly 1.5 to 2 times larger than the area experiencing decreases.
Kunkel, K. E., and R. M. Frankson, 2016: Global land surface extremes of precipitation. Journal of Extreme Events, 2, 1550004. http://dx.doi.org/10.1142/S2345737615500049