In 2017 and 2018, the United States experienced historic rainfall totals and damaging inland floods from two slow-moving hurricanes—Harvey and Florence. In a new paper in Geophysical Research Letters, Kenneth Kunkel and Sarah Champion compared these two storms with the historical record and determined that Hurricane Harvey produced far more rainfall in the contiguous United States (CONUS) than any other storm since 1949. They also explored the meteorological drivers of the heaviest precipitation events and looked at changes in their frequency and severity over time.
Kunkel and Champion analyzed four-day rainfall totals averaged over geographic areas of varying sizes to identify the 100 most extreme large-scale precipitation events from 1949 through 2018, using data from NOAA NCEI’s Global Historical Climatology Network-Daily dataset. For areas sized 50,000 square kilometers, Hurricane Harvey was by far the heaviest rainfall event on record in the CONUS, with an average of 612 millimeters (about 24 inches) of rain over the affected area from August 25 through September 1, 2017 (Figure 1). Some locations saw more than 40 inches of rain, with a maximum of 60.58 inches near Nederland, Texas. The storm produced estimated economic losses of more than $128 billion (in 2019 dollars).
Although Hurricane Florence affected a smaller area than Harvey, it also produced torrential rains, with a maximum observed total of 970 millimeters (38 inches) near Wilmington, North Carolina. Florence ranked seventh on record for the CONUS at the 50,000-square-kilometer scale, with an area average of 328 millimeters (about 13 inches; Figure 1). Florence was also a much weaker storm than Harvey in terms of wind speeds (Category 1 versus Category 4 at landfall), but it still produced an estimated $24 billion in damages (in 2019 dollars). Thus, Florence serves as a reminder of the potentially devastating economic and human impacts of inland rainfall events from hurricanes.
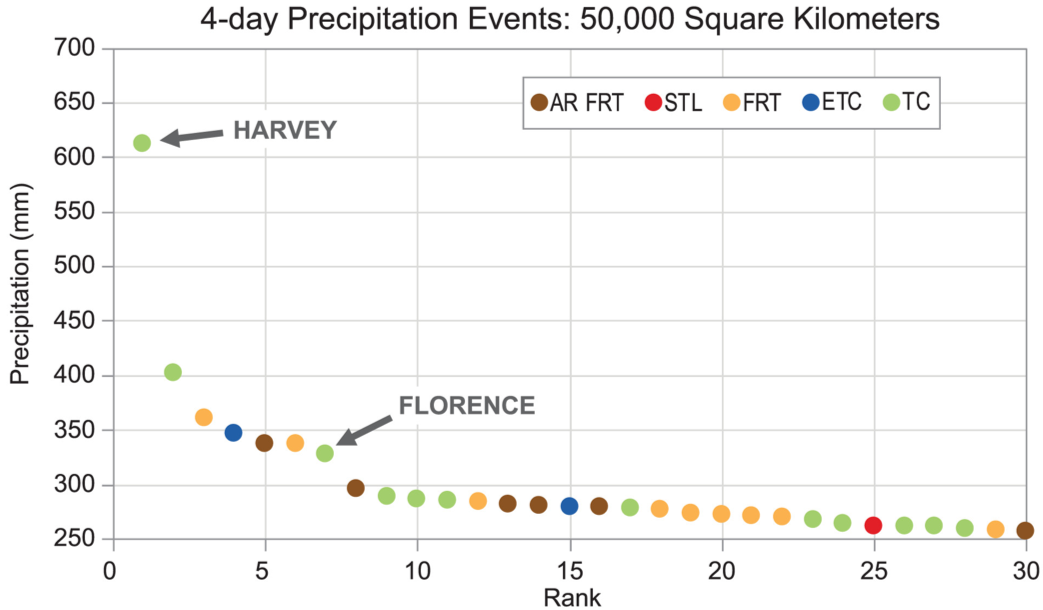
Figure 1: For heavy precipitation events in the contiguous United States averaged over four days and over 50,000 square kilometers, Hurricane Harvey produced the most precipitation by far, while Hurricane Florence ranked seventh. The colors indicate the meteorological cause identified for each event by expert judgment, using the following categories: tropical cyclones (TC), fronts associated with an extratropical cyclone (FRT), extratropical cyclones not colocated with fronts (ETC), fronts with an associated atmospheric river (AR FRT), ETCs with associated atmospheric rivers (AR ETC), and subtropical lows (STL). Five of the top 10 events were associated with tropical cyclones. Source: Kunkel and Champion 2019.
From 1949 through 2018, tropical cyclones produced 25% of the top 100 rainfall events but were responsible for 5 of the 10 heaviest events. The majority (59%) of events were caused by weather fronts associated with extratropical cyclones (ETCs), with another 13% caused by ETCs but not associated with a front. With the exception of Hurricane Agnes, which caused intense flooding in Pennsylvania in 1972, most of the events occurred over the southern plains and the Southeast, although 15 events were located along the West Coast. All of the West Coast events were associated with atmospheric rivers. A look at these very heavy precipitation events by decade shows that they are becoming more common, with the largest number (25) occurring between 2009 and 2018 (Figure 2). However, there is no clear trend in terms of the magnitude rankings of events.
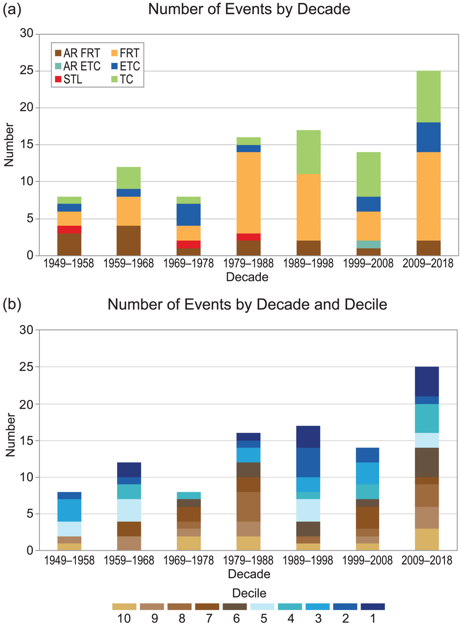
Figure 2: Panel (a) shows the breakdown of top 100 events by decade for 1949–2018, with the most recent decade having the largest number of such events. As in Figure 1, colors show associated meteorological causes. The categories are the same with the addition of ETCs with associated atmospheric rivers (AR ETC), which was not among the drivers behind any of the top 30 events. Panel (b) shows the breakdown of how the events in each decade ranked in terms of area-averaged precipitation, where decile 1 = events ranking in the top 10, decile 2 = events ranked 11–20, and so on. Source: Kunkel and Champion 2019.
This research was motivated in large part by requests from the media and various stakeholder groups who were interested in understanding how these events compare to previous precipitation events, whether back-to-back years with major hurricane-driven rain events are evidence of an increasing trend, and what the implications might be for designing infrastructure to withstand extreme precipitation events in the future. The methodology used in the study—particularly the approach of analyzing events averaged over relatively large areas—lends itself to similar approaches in analyzing the results of climate models, and the team is currently engaged in research on what climate models can tell us about the spatial distribution and meteorological causes of events.
Kunkel, K. E. and S. M. Champion, 2019: An assessment of rainfall from Hurricanes Harvey and Florence relative to other extremely wet storms in the United States. Geophysical Research Letters, 46. http://dx.doi.org/10.1029/2019GL085034