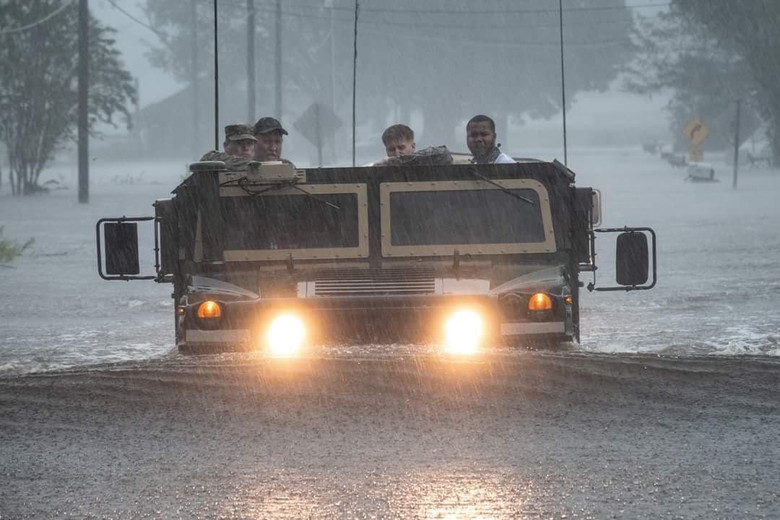
U.S. Army Soldiers help evacuate residents affected by Hurricane Florence. (Photo Credit: U.S. Army photo )
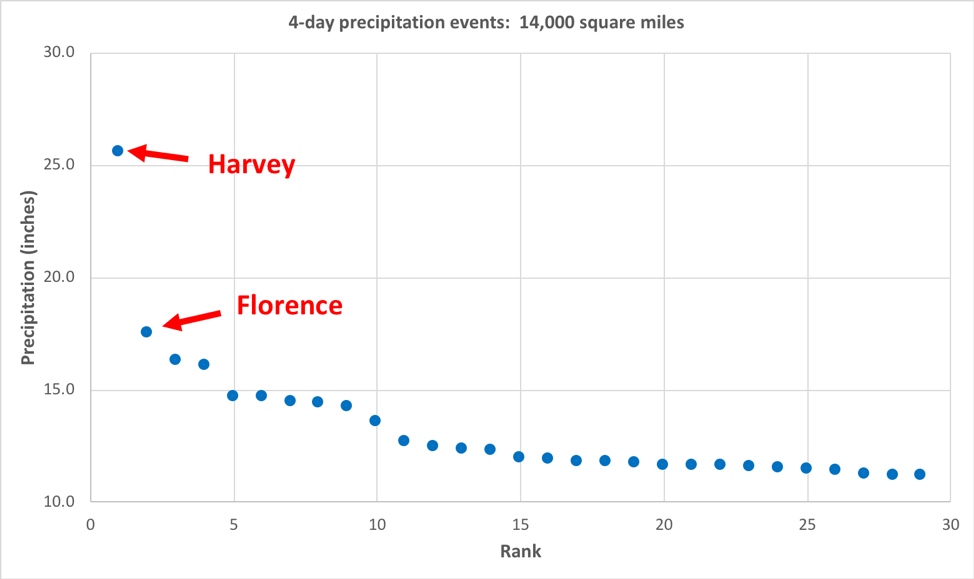
Preliminary research by NCICS’ Kenneth Kunkel indicates that Hurricane Florence was among the rainiest storms to hit the United States in the last 70 years. Based on four-day rainfall totals, Florence delivered an average of more than a foot of rain—17.5 inches—over an area of 14,000 square miles. That ranks Florence second for an area of that size, behind only the 25.6 inches that Hurricane Harvey delivered in 2017.
Dr. Kunkel’s analysis compared Florence against other four-day rainfall totals in the contiguous United States from 1949 to the present, using averages over various sizes of geographic area ranging from 10,000 square miles up to 80,000 square miles. The rainfall totals for Florence were calculated for September 14–17, 2018, from preliminary reports from National Weather Service’s Cooperative Observer Network.
The figures below show the precipitation amounts for the largest 30 events averaged for two area sizes: 14,000 square miles (t0p) and 20,000 square miles (bottom). In both cases, the largest four-day event was Hurricane Harvey. While Florence ranked second when averaging over 14,000 square miles, it ranks seventh when looking at averages over 20,000 square miles. The second-ranked event at 20,000 square miles is Hurricane Georges in 1998 (September 27–30), which produced very heavy rain in the central Gulf Coast. The 3rd through 6th-ranked events (none of which were hurricanes) included two 2016 events in Louisiana—one in March, the other in August—followed by a 1962 event in northern California and a 1994 event in southeast Texas. When looking at larger areas, Florence ranks considerably lower. For example, at 80,000 square miles, it ranks 49th.
Florence’s rainfall was unprecedented for eastern North Carolina and make it one of the largest on record for the entire United States for areas up to 20,000 square miles. The analysis also serves as a reminder that Hurricane Harvey not only delivered a tremendous amount of rainfall but did so over a very large area.
Note that the relative ranking of Florence could change as additional data are obtained and the preliminary data are quality-controlled. Also, this analysis only uses stations that have been reporting reliably throughout the 70 year period. This means that only a small fraction of current reporting stations are used. However, the use of a consistent network of stations across the entire period increases the reliability of the resulting rankings.
For more on these findings, see this Associated Press story by Seth Borenstein: https://apnews.com/3ce363b1eb4d4243b0e7b2d994fd7249


