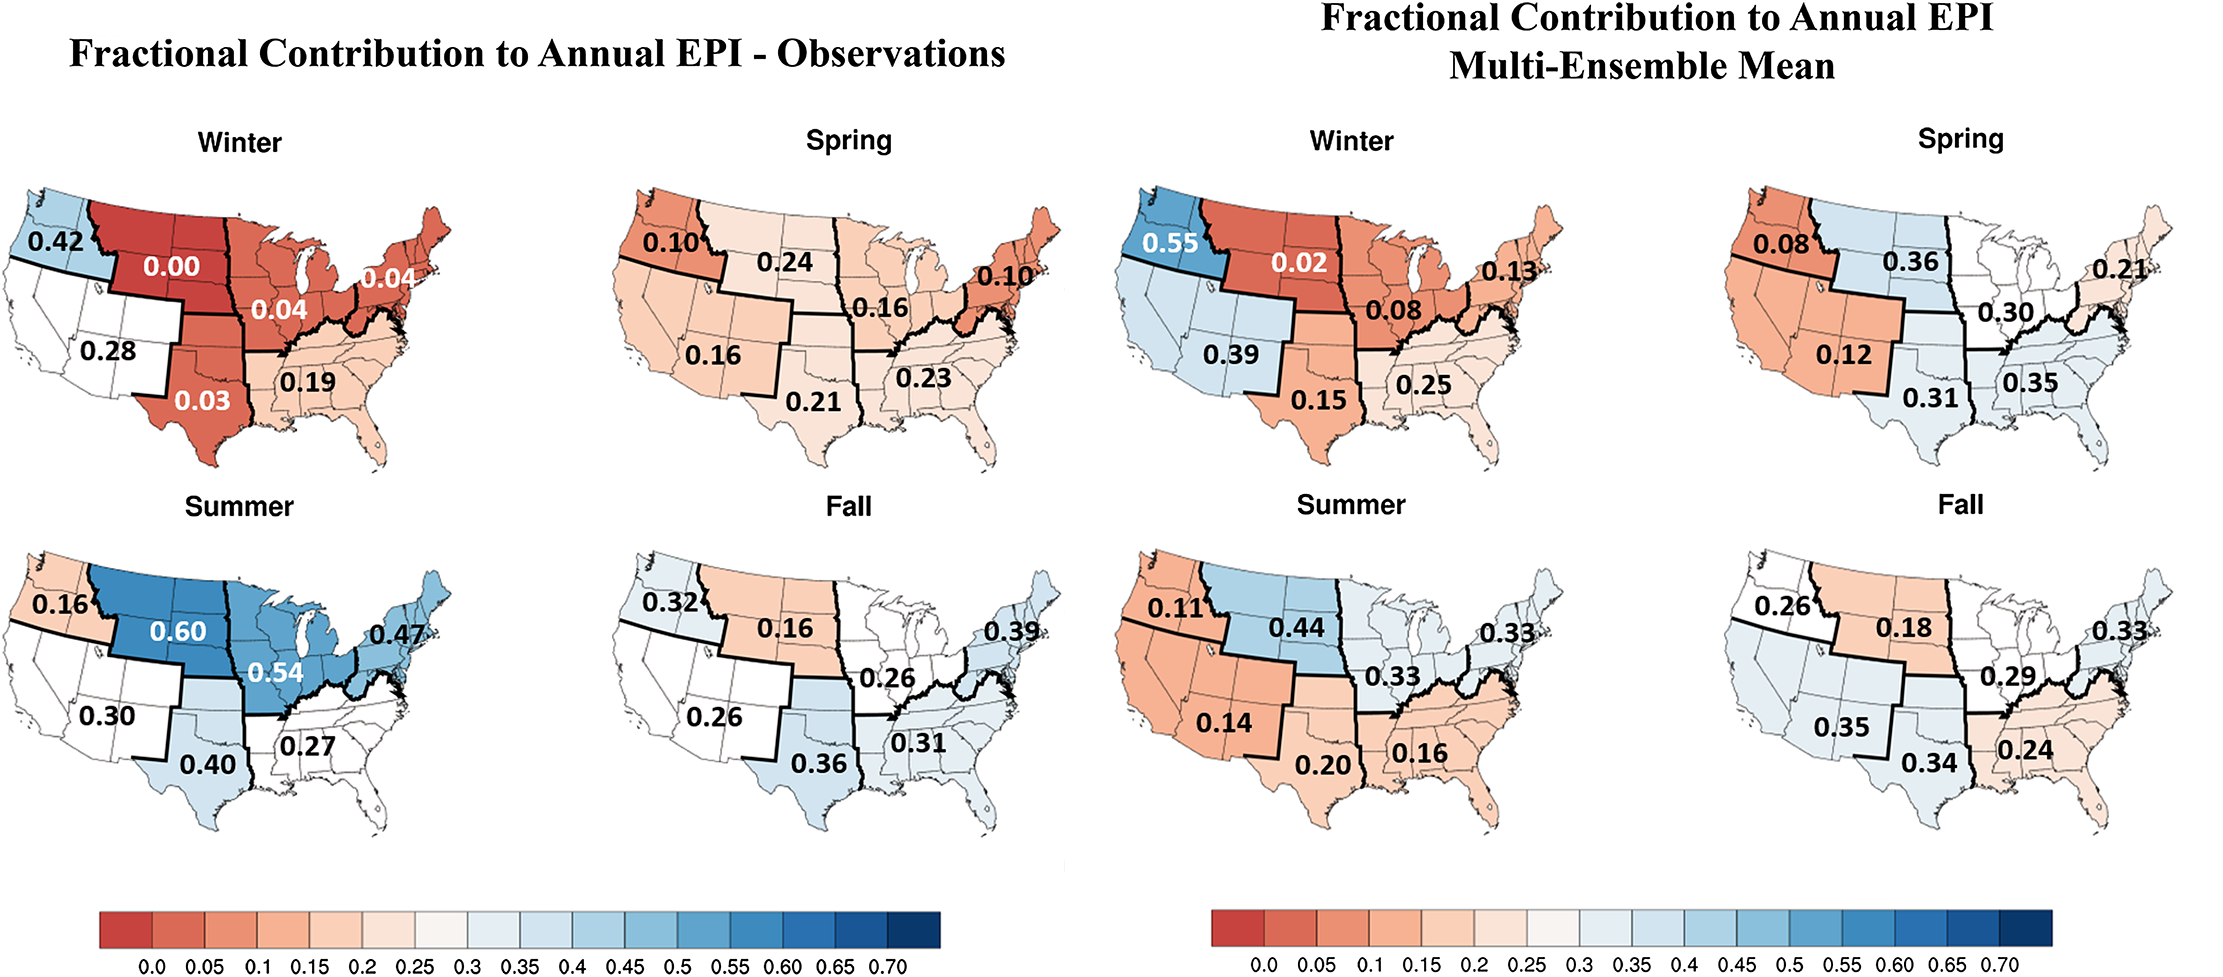
The two figures above display the average seasonal contribution for each region of United States to the average annual extreme precipitation index (EPI) of that area. The left figure shows observed EPI contributions for the period between 1901-2005 and the figure to right exhibits contributions simulated by CMIP5 models. Overall, CMIP5 simulations capture historical EPI contributions with reasonable accuracy, but mistakenly shift a portion of summer events into the spring and generally overestimate the EPI contributions for winter months.
Climate models are central to our ability to predict and adapt to the major long-term weather and climate changes that we are likely to experience in the future. Therefore, understanding and improving the accuracy of these models is important for many public concerns, from safeguarding human health to maintaining infrastructure. Authors from the Department of Atmospheric Sciences at the University of Illinois worked alongside NCICS’ Kenneth Kunkel to discover how the simulations of CMIP5 climate models compare to observed extreme precipitation dating from 1901 to 2005. Their research provides a better understanding of the current state of knowledge about seasonal trends in extreme precipitation throughout the regions of the United States and predicts seasonal trends into 2100.
Observational data analyzed by the authors show that for the majority of regions the summer months contribute the most, and the winter months the least, to the annual extreme precipitation index (EPI), a measure of the frequency of extreme precipitation events. Increasing trends in annual EPI are observed for the Midwest and Northeast. Some seasonal trends are also observed, although these trends are not statistically significant when evaluated across entire regions.
To assess the performance of climate models, the authors compared the seasonal contributions to the observed EPI values to those simulated by the CMIP5 models. The most significant difference found was that the CMIP5 models simulated too few events in the summer and too many in the spring compared to the observed data. Possible explanations for the discrepancy include the fact that even high-resolution CMIP5 models do not account well for terrain features (mountains, plateaus), and thus poorly capture their effects on precipitation in some areas. In addition, warm and cold fronts, even though they are weak, are an important trigger for extreme rainfall in the summer, but it is not known whether climate models adequately simulate these weak systems. These factors may account for the models’ inclination to shift extreme precipitation events earlier into the warm season. CMIP5 simulations for the future indicate a shift toward more winter and spring events, at the expense of the summer. However, the reliability of such projected seasonal shifts is questionable because of the seasonal bias in that same direction of the historical CMIP5 simulations.
The observational data comes from the U.S. Cooperative Observer Network, specifically a subset of 766 stations across the nation with mostly complete data from 1901 through 2014. Observations were compared to CMIP5 simulations for those years and individual seasons. A time series from these stations is only considered acceptable annually when at least 300 days of data are available and for seasonal comparisons when 75 days are available for each season. The definition of an extreme event was unique to each station based on its own historical climatology, resulting in a nearly equal number of extreme precipitation events at each station, despite a wide range of of extreme precipitation climatology characteristics.
Janssen, E., R. L. Sriver, D. J. Wuebbles, and K. E. Kunkel, 2016: Seasonal and regional variations in extreme
precipitation event frequency using CMIP5. Geophysical Research Letters, 43, 5385-5393. http://dx.doi.org/10.1002/2016GL069151