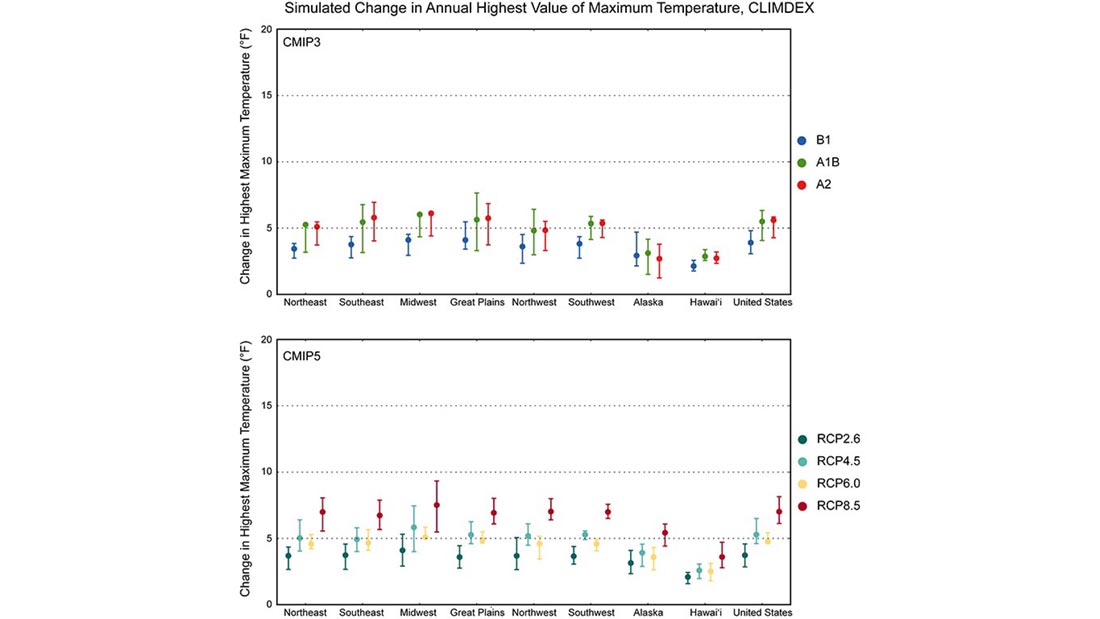
Figure 1. Simulated change in the annual highest value of daily maximum temperature (TXx) for each region and the contiguous United States, for 2046–2065 with respect to the reference period of 1981–2000. The upper panel shows values for the CLIMDEX SRES B1 (blue), A1B (green), and A2 (red) scenarios. The lower panel shows values for the CLIMDEX RCP2.6 (dark teal), 4.5 (light teal), 6.0 (yellow), and 8.5 (dark red) scenarios. Bars indicate the interquartile ranges of model values and circles depict the multi-model means.
The National Oceanic and Atmospheric Administration (NOAA) has released a new report comparing results for the United States from two generations of climate model simulations. The report, entitled “Regional Surface Climate Conditions in CMIP3 and CMIP5 for the United States: Differences, Similarities, and Implications for the U.S. National Climate Assessment,” compares simulations of historical and future U.S. climate produced by Phases 3 and 5 of the Coupled-Model Intercomparison Project (CMIP3 and CMIP5, respectively).
The report provides important insights into similarities and differences between the two generations of model simulations and the two sets of underlying scenarios. It concludes that the differences between the two are generally very small, both in magnitude and in spatial distribution. Because many of the findings of the Third National Climate Assessment (NCA3), released in May 2014, were based on CMIP3 simulations, the finding that CMIP5 simulations produce very similar results serves as further validation of the findings of NCA3.
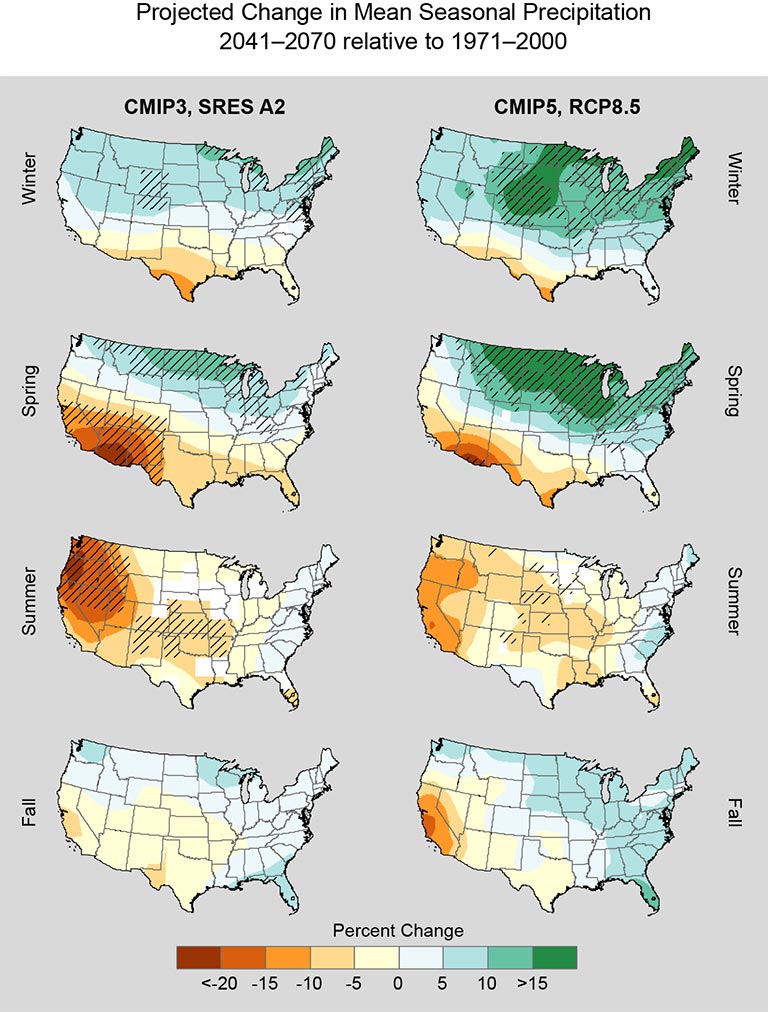
Figure 2. Projected change in mean seasonal precipitation (%) for the contiguous United States, for 2041–2070 with respect to the reference period of 1971–2000. These are multi-model means using CMIP3 SRES A2 (left column), and CMIP5 RCP8.5 (right column). Color only (category 1) indicates that less than 50% of the models show a statistically significant change. Whited out areas (category 2) indicate that more than 50% of the models show a statistically significant change, but less than 67% agree of the sign of the change. Color with hatching (category 3) indicates that more than 50% of the models show a statistically significant change, and more than 67% agree on the sign of the change.
Both sets of simulations indicate that future warming will increase temperatures well beyond the envelope of historical occurrences for the moderate to high emissions scenarios. Along with average temperatures, changes are also projected for a variety of climate extremes, including maximum temperatures, which are projected to increase (see Figure 1). Most of the differences between the CMIP3 and CMIP5 projections are likely due to the fact that the CMIP5 scenarios cover a larger range of possible future greenhouse gas concentrations, resulting in a wider range of climate outcomes in the CMIP5 simulations.
In both sets of simulations, projections for precipitation changes indicate that the United States straddles the transition zone between wetter conditions across the north to drier conditions in the southwest in the winter and spring. Regional patterns of projected precipitation changes do vary somewhat between CMIP3 and CMIP5, reflecting both differences in scenarios and the fact that precipitation projections tend to vary more widely among different climate models (see Figure 2).
The new report, which underwent extensive peer review, was authored by Liqiang Sun, Kenneth Kunkel, Laura Stevens, and Andrew Buddenberg of the Cooperative Institute for Climate and Satellites–North Carolina (CICS-NC); J. Greg Dobson of the National Environmental Modeling and Analysis Center (NEMAC) at the University of North Carolina–Asheville; and David Easterling of NOAA’s National Centers for Environmental Information (NCEI).
The report serves as an update to the detailed CMIP3 simulations presented in an earlier set of NOAA Technical Reports, produced by the many of the same authors, entitled “Regional Climate Trends and Scenarios for the U.S. National Climate Assessment” (available online at http://scenarios.globalchange.gov/scenarios/climate). These Technical Reports provided the basis for many of the projections presented in NCA3. This new report, along with another produced by the NOAA CMIP5 Task Force, serve as an update to the earlier NOAA Technical Reports. These new reports should inform the science and projections in the next National Climate Assessment report.
Sun, L., K.E. Kunkel, L.E. Stevens, A. Buddenberg, J.G. Dobson, and D.R. Easterling, 2015: Regional Surface Climate Conditions in CMIP3 and CMIP5 for the United States: Differences, Similarities, and Implications for the U.S. National Climate Assessment. NOAA Technical Report, NESDIS 144. 111 pp. DOI: 10.7289/V5RB72KG ftp://ftp.library.noaa.gov/noaa_documents.lib/NESDIS/TR_NESDIS/TR_NESDIS_144.pdf