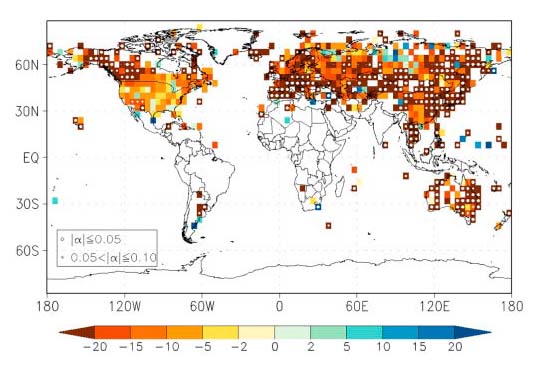
Trend (%/decade) for the period of 1951–2014 in the number of 5-day duration cold spells with mean temperature less than the threshold for a 1-in-5yr recurrence. Grid box (4°×4°) averages calculated from 5084 stations with less than 10% missing daily temperature data for 1951–2014. Grid boxes with statistically significant trends (computed with non-parametric Mann-Kendall test) identified with white dots. Data used are from the Global Historical Climatology Network-Daily data set (Menne et al., 2011).
Kenneth Kunkel and Liqiang Sun of CICS-NC are coauthors on a paper that provides an overview of the science of detecting changes in climate extremes and determining to what extent those changes can be attributed to specific causes, such as warming caused by increases in greenhouse gas concentrations. The paper also explores the emerging science of event attribution, which seeks to determine whether human activities directly influenced the likelihood or severity of particular extreme events.
In this context, detection is the process of identifying statistically significant changes in some aspect of the climate system, such as extreme values of a climate variable over time, while attribution involves the use of climate model simulations to determine whether a detected change can be attributed to a cause.
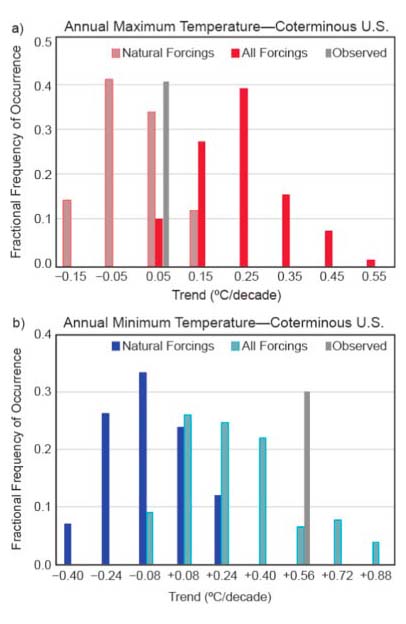
Probability distribution functions of the trends in two extreme temperature metrics for the coterminous United States for 1956–2005. Metrics include (a) annual maximum value of daily maximum temperature; and (b) annual minimum value of daily minimum temperature. The CMIP5 model trend distributions are shown for 78 historical forcing (natural and anthropogenic) simulations from 29 CMIP5 models (red) and for 35 natural forcing only simulations from 15 CMIP5 models (blue). The observed U.S. trend is shown in gray. (For interpretation of the references to color in this figure legend, the reader is referred to the web version of this article.)
The paper uses several examples to illustrate the current state of the science in detection and attribution. For example, Figure 4 reveals the detection of widespread downward trends in the number of five-day cold spells, with many of these trends being statistically significant. Figure 6 demonstrates some of the complexity of attribution efforts—trends in annual maximum temperature for the contiguous United States are not statistically significant in this analysis, and it is not clear whether human factors have influenced the observed trend. On the other hand, annual minimum temperatures do show a statistically significant trend, and that trend is well outside the range that would be expected to result from natural factors only.
The authors note that data availability and quality are often limiting factors. For example, data quality control efforts may remove “outliers” that could in fact be valid extreme conditions. Limited spatial coverage can inhibit the accurate estimation of trends in many areas, as well as the ability to evaluate model simulations. This is particularly for true in underdeveloped areas that may be most vulnerable to extreme events.
The paper concludes with a look at the development of techniques for quantifying the effect of human-induced climate change on variety of extreme weathers. For example, it is now often possible to compute a risk or probability ratio for a given event, showing the ratio of probabilities in the real world versus simulations without climate change. Another approach—fraction attributable risk (FAR)—defines how much of the risk of an event was due to particular natural and human-caused factors.
Easterling, D. R., K. E. Kunkel, M. F. Wehner, and L. Sun, 2016: Detection and attribution of climate extremes in the observed record. Weather and Climate Extremes, 11, 17-27. http://dx.doi.org/10.1016/j.wace.2016.01.001