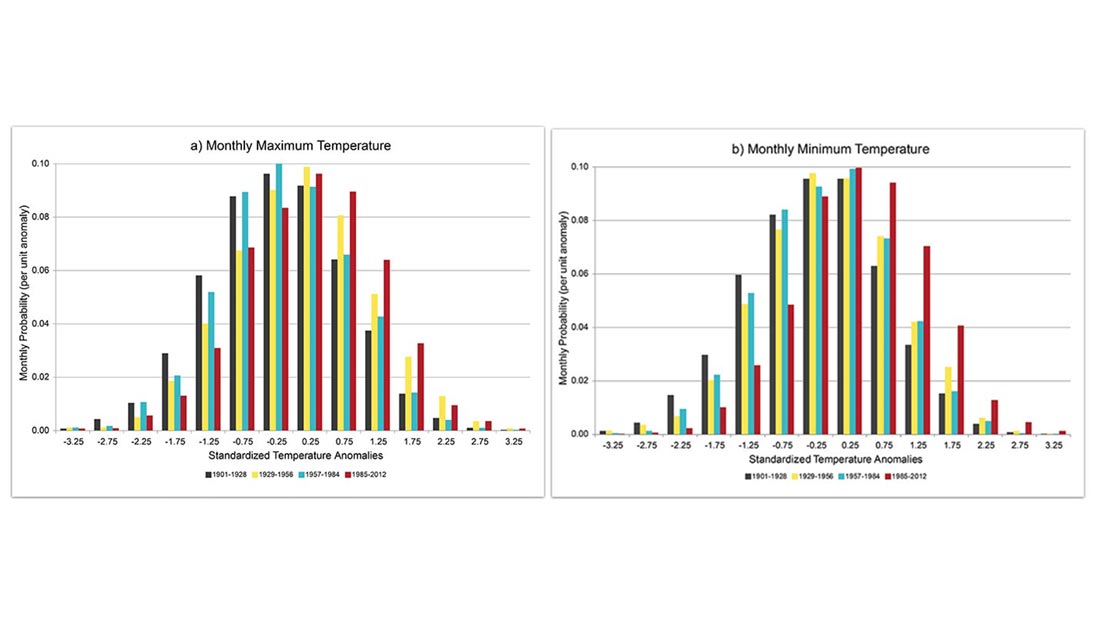
Probability distribution function of standardized monthly temperature anomalies for (a) monthly maximum temperature and (b) monthly minimum temperature. These are aggregates for seven conterminous U.S. regions for all 12 months for four 28 year periods: 1901–1928 (black), 1929–1956 (yellow), 1957–1984 (teal), and 1985–2012 (red). Vertical scale is monthly fractional probability per unit standardized temperature anomaly.
We know that global and national average temperatures have been increasing since around the start of the 20th century. But have there also been increases in the frequency of both the very hottest and coldest months?
Kenneth Kunkel, Laura Stevens, and Richard Knight of CICS-NC, along with NOAA National Centers for Environmental Information (NCEI) colleague Russell Vose, investigate that question in a new paper in Geophysical Research Letters entitled “Is the monthly temperature climate of the United States becoming more extreme?”
The short answer is “no.” While very warm months have become more frequent, the occurrence of very cold months has decreased by a similar amount. In mathematical terms, the width and shape of the probability distribution of U.S. monthly temperatures has remained relatively consistent, simply shifting to a warmer range as average temperatures have increased.
This can be seen in the figure at right, which shows the distributions of monthly temperatures for four different 28-year periods with respect to the long-term temperature average over the entire period (1901-2012). Comparing the distributions of the black bars (monthly temperatures for 1901–1928) and the red bars (monthly temperatures for 1985–2012) reveals that the entire distribution has shifted to the right (warmer) for both maximum and minimum temperatures. The difference between the tails of the distribution has not increased, however, leading to the conclusion that the temperature climate of the United States has not become more extreme.
The figure also indicates that the warmth of the period that includes the Dust Bowl years (yellow bars) was caused primarily by warm daytime maximum temperatures (likely due in part to drought conditions prevalent during this period), while the warmth of the most recent period was caused by both warm daytime maximum and nighttime minimum values.
Kunkel, K. E., R. S. Vose, L. E. Stevens, and R. W. Knight, 2015: Is the monthly temperature climate of the United States becoming more extreme? Geophysical Research Letters, 42, 2014GL062035, doi:10.1002/2014GL062035. Available online at: http://dx.doi.org/10.1002/2014GL062035