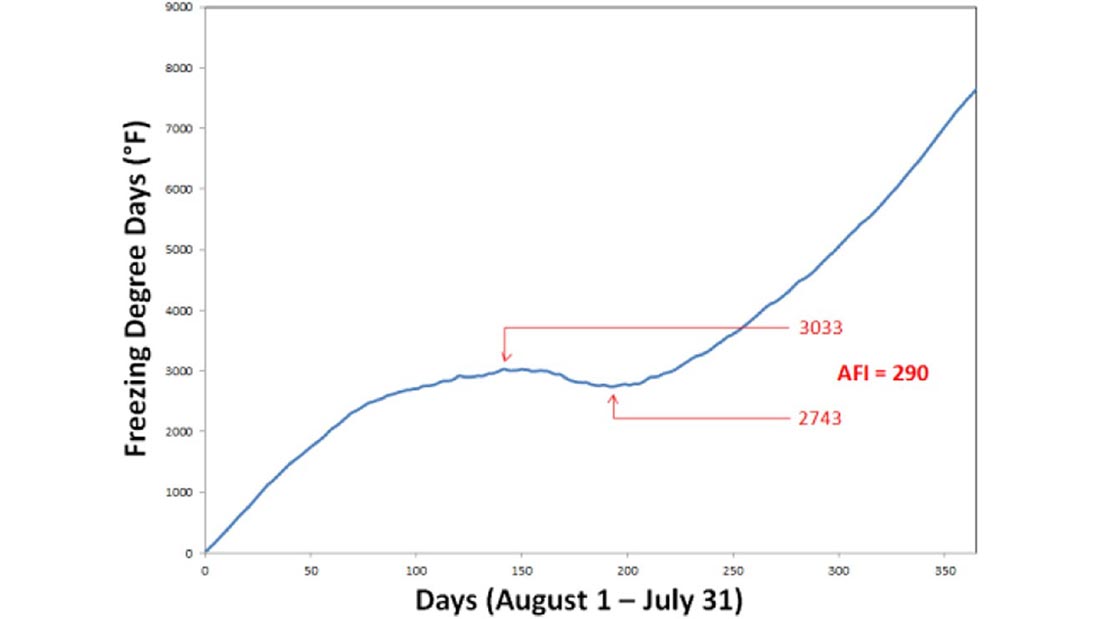
Figure shows the FDD value for each day over the 1976–1977 cold season at the Asheville, North Carolina, Regional Airport ASOS weather station. The Air-Freezing Index (AFI) for that year, calculated as the gap between the local maximum and minimum FDDs at the onset and end of the cold season, was 290.
In many areas of the country, proper building design and construction depend on accurate expectations of how deeply the ground will freeze in the winter. Soil frost depth also has important implications for hydrology, agriculture, and even burials. Because frost depth is driven by both the intensity and length of below-freezing weather, the observed warming over the last several decades is likely altering patterns of soil freezing.
In a new paper in the Journal of Applied Meteorology and Climatology titled Calculation and Evaluation of an Air-Freezing Index for the 1981–2010 Climate Normals Period in the Coterminous United States, a team of authors based at NOAA’s National Centers for Environmental Information (NCEI), including Rocky Bilotta of ERT Inc., Jesse Bell of the Cooperative Institute for Climate and Satellites–North Carolina, Ethan Shepherd of STG Inc., and Anthony Arguez of NOAA NCEI, present a new version of NOAA’s air-freezing index (AFI) that can be used to estimate maximum soil frost depth. They find significant reductions in the AFI for 1981-2010 compared to 1951-1980, consistent with the trends in climate change observed over that time period.
Evaluating soil frost depth is difficult because direct measurements of frost depth are not widely available and those that are available don’t date back very far. But, because frost depth is closely linked to air temperatures, an index that measures how often, and by how much, air temperatures remain below freezing through the winter can serve as a useful proxy measurement for frost depth.
The AFI presented in the paper is based on “freezing degree days”—the number of degrees by which the average temperature on a given day is above freezing (positive FDD values) or below freezing (negative FDD values). For example, if the average temperature at a location is 42°F (10°F above freezing), the FDD value for that day is 10. For a daily average that only reaches 20°F, then the value is –12 FDD.
The AFI for a given year is computed as a running sum of FDD over that year, starting from August 1 and running through July 31 of the next year—the period centered around a single cold season. For most areas of the country, the AFI steadily increases during the first few months of this period, as daily temperature averages tend to be above freezing and the corresponding positive FDD values increase the value of the running AFI sum.
With the onset of the cold season, days below freezing produce negative FDD values which lower the value of the running AFI sum. The AFI then begins to increase again as warm weather returns and FDDs become positive again.
The gap between the AFI peak at the onset of the cold season and the lowest AFI value observed at the end of the cold season provide a measure of the intensity of that cold season—the bigger the gap, more intense the freezing for that winter. In warm areas of the country, where average temperatures are almost always above freezing, the AFI will be very low or zero. In colder areas of the country, long intense winters result in AFI’s of 1,000 or more.
Comparing averages for 1981-2010 and 1951-1980, Bilotta and his co-authors found that the AFI has decreased significantly for most of the country. Examining “two-year return” winters, that is, winters of a severity typically observed every two years, the AFI decreased by more than 10% for more than 80% of stations, while only 2% of stations showed an increase of 10% or more. For rarer, more extreme winters with a 100-year return period, 59% of the stations showed a decrease in AFI of 10% or more, with 21% of stations showing an increase of 10% or more.
Bilotta, R., J. E. Bell, E. Shepherd, and A. Arguez, 2015: Calculation and evaluation of an air-freezing index for the 1981–2010 climate normals period in the coterminous United States. Journal of Applied Meteorology and Climatology, 54, 69-76, doi:10.1175/JAMC-D-14-0119.1. Available online at http://dx.doi.org/10.1175/JAMC-D-14-0119.1