Search Results for: %E3%80%94upso747.C%CE%98M%E3%80%95%EC%B0%BD%EC%9B%90%ED%92%80%EC%8B%B8%EB%A1%B1%E2%98%A3%E2%94%8E%EB%B4%89%EC%82%AC%EB%B0%9B%EB%8A%94%E2%94%9A%E2%85%B3%EC%B0%BD%EC%9B%90%ED%82%A4%EC%8A%A4%EB%B0%A9%E2%9C%94%EC%B0%BD%EC%9B%90%EC%98%A4%ED%94%BC%E2%8C%92%EC%B0%BD%EC%9B%90%ED%95%B8%ED%94%8C%E3%81%A4%EC%B0%BD%EC%9B%90%EB%A6%BD%EC%B9%B4%ED%8E%98%E2%98%BF%EC%B0%BD%EC%9B%90%EC%8A%A4%ED%8C%8C%E2%96%A7%EC%B0%BD%EC%9B%901%EC%9D%B8%EC%83%B5
Aug 25, 2016
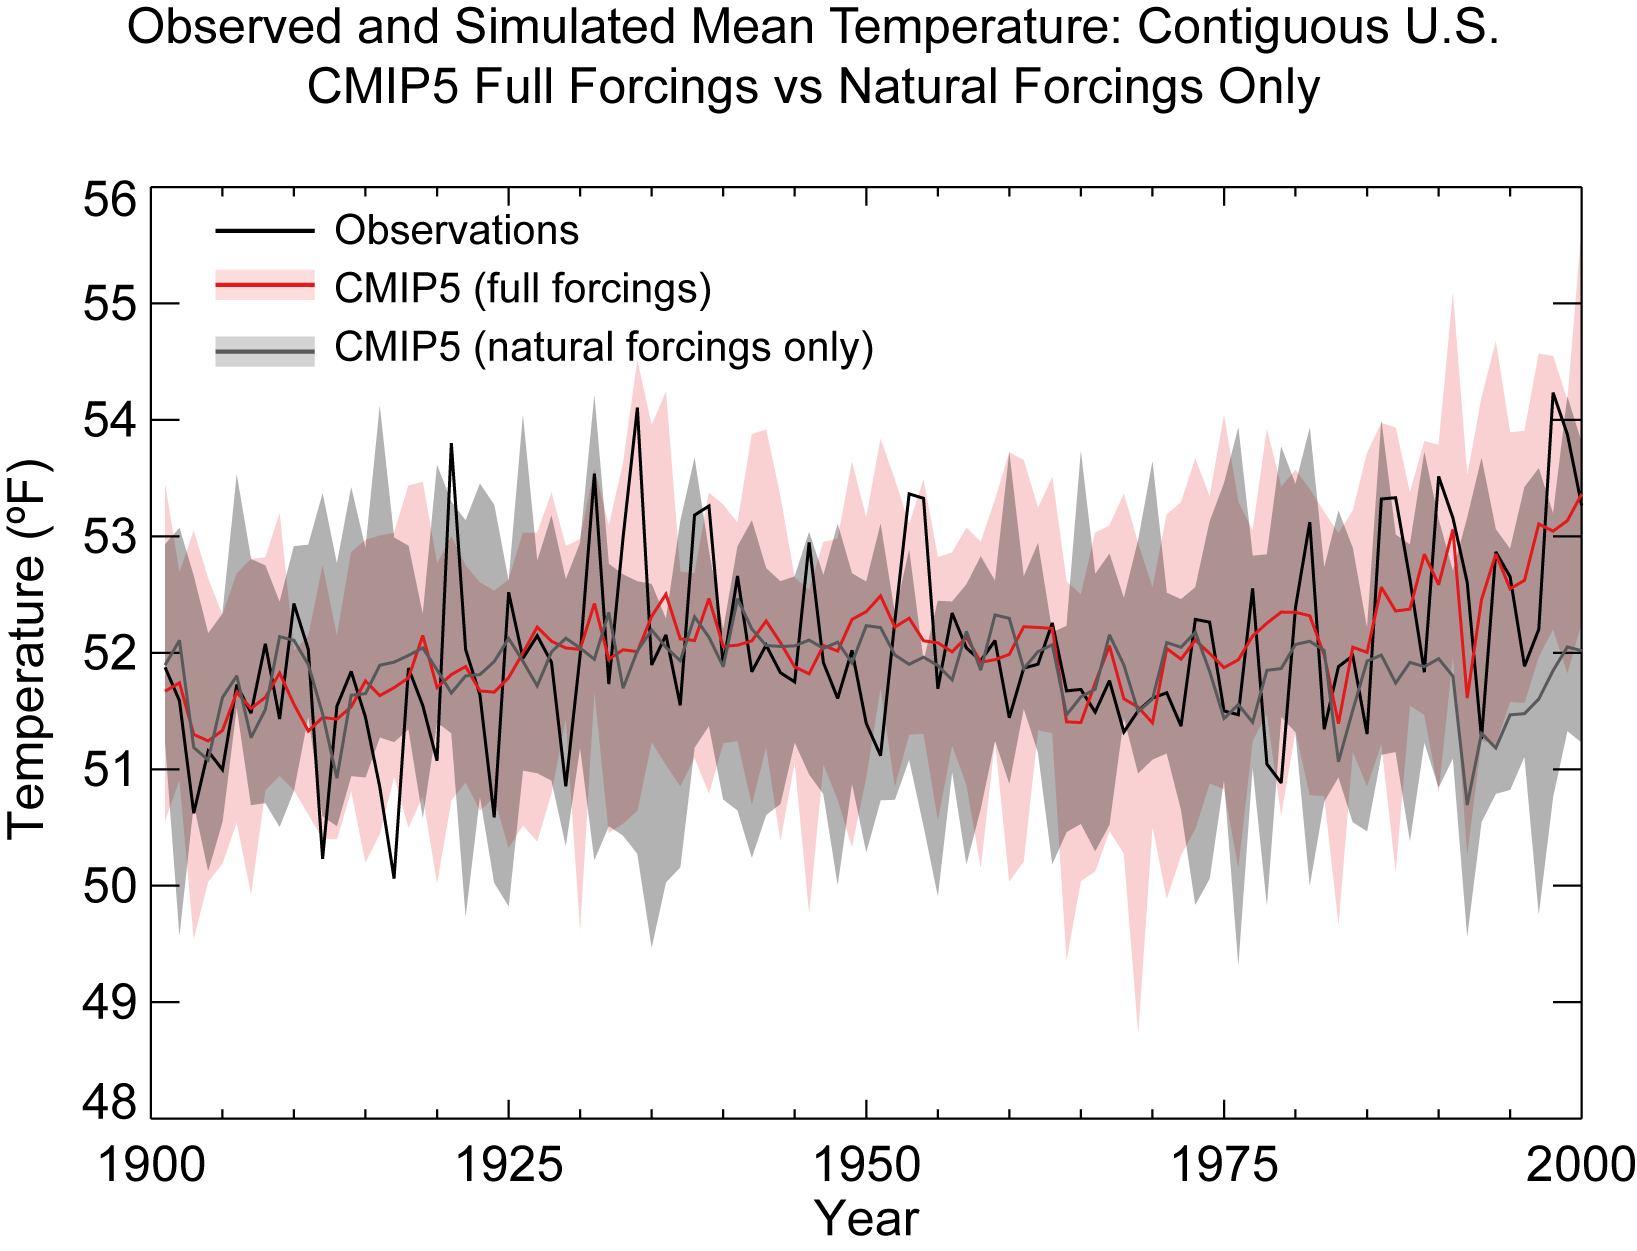
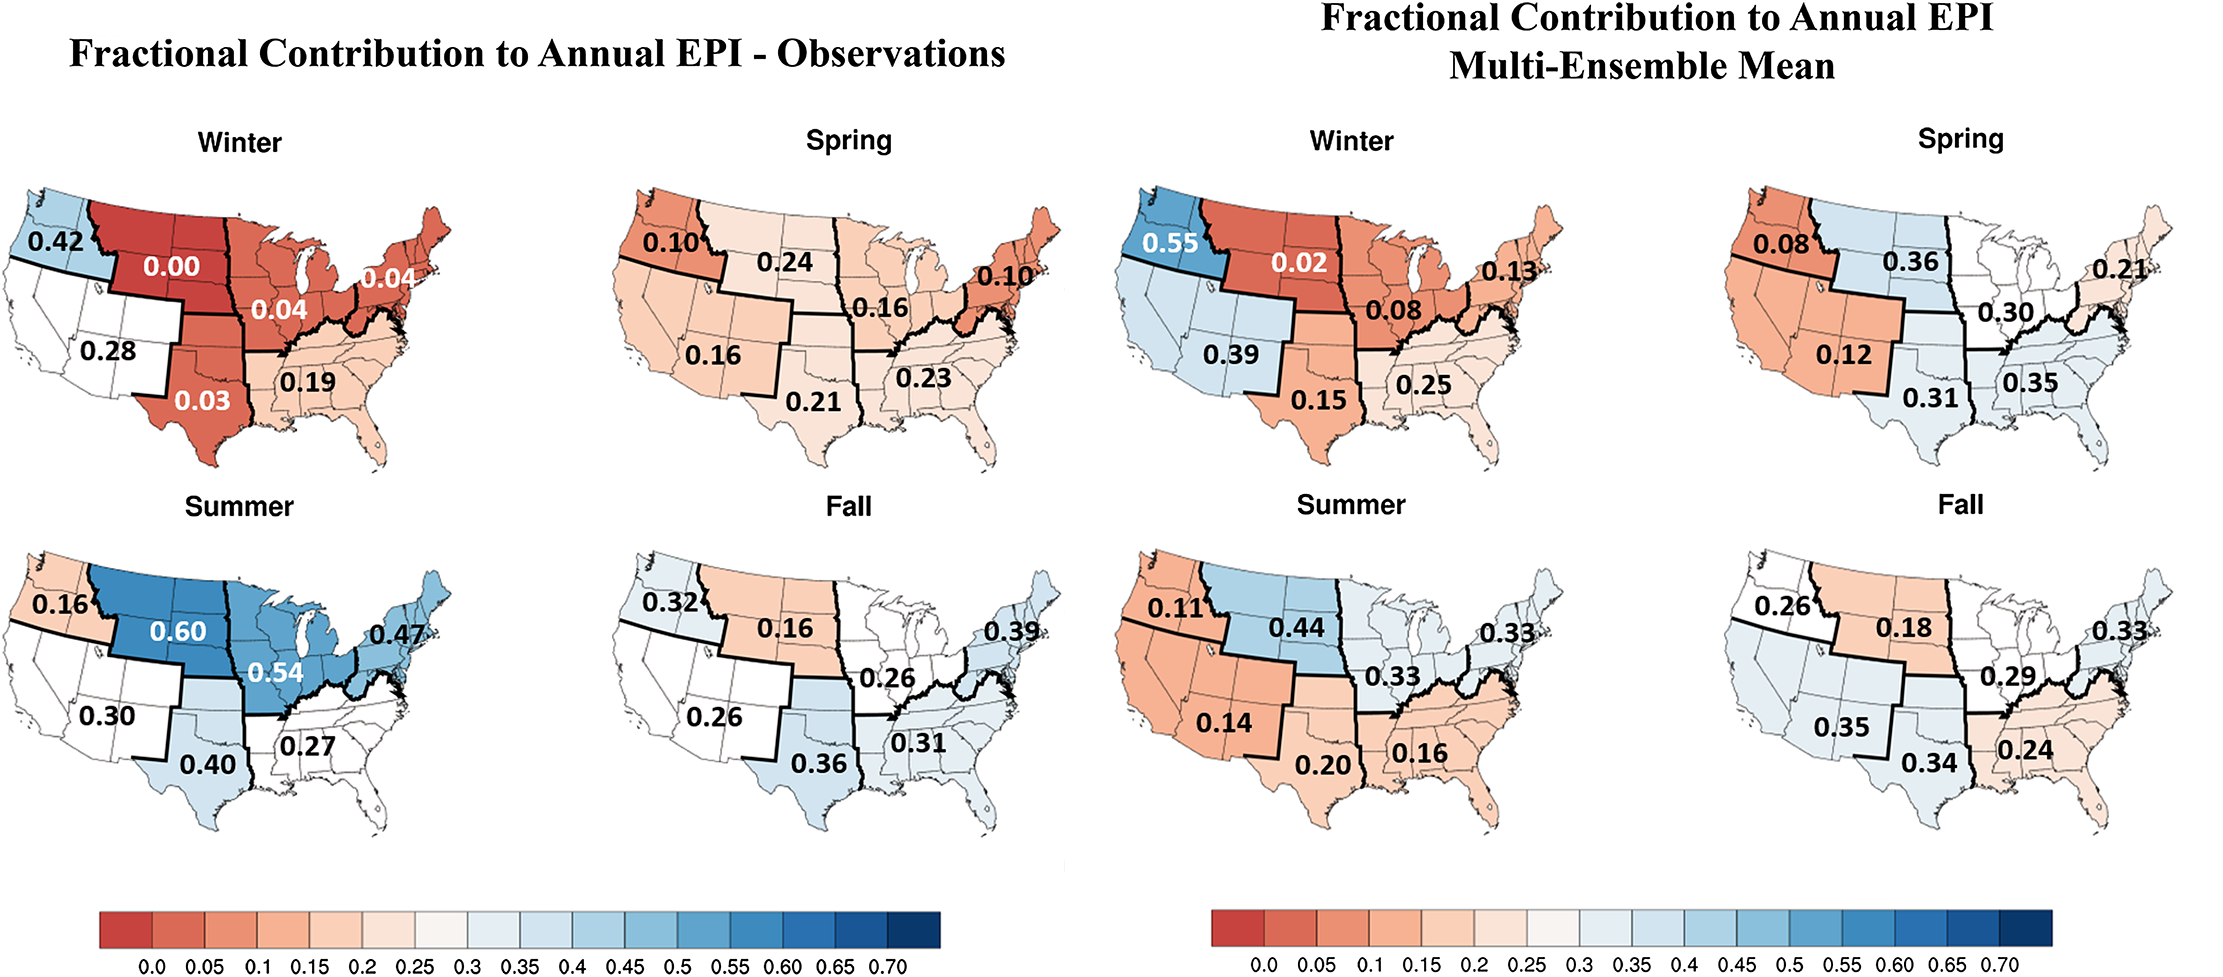
Seasonal and regional variations in extreme precipitation event frequency using CMIP5
Climate models are central to our ability to predict and adapt to the major long-term weather and climate changes that we are likely to experience…→
Jun 17, 2019
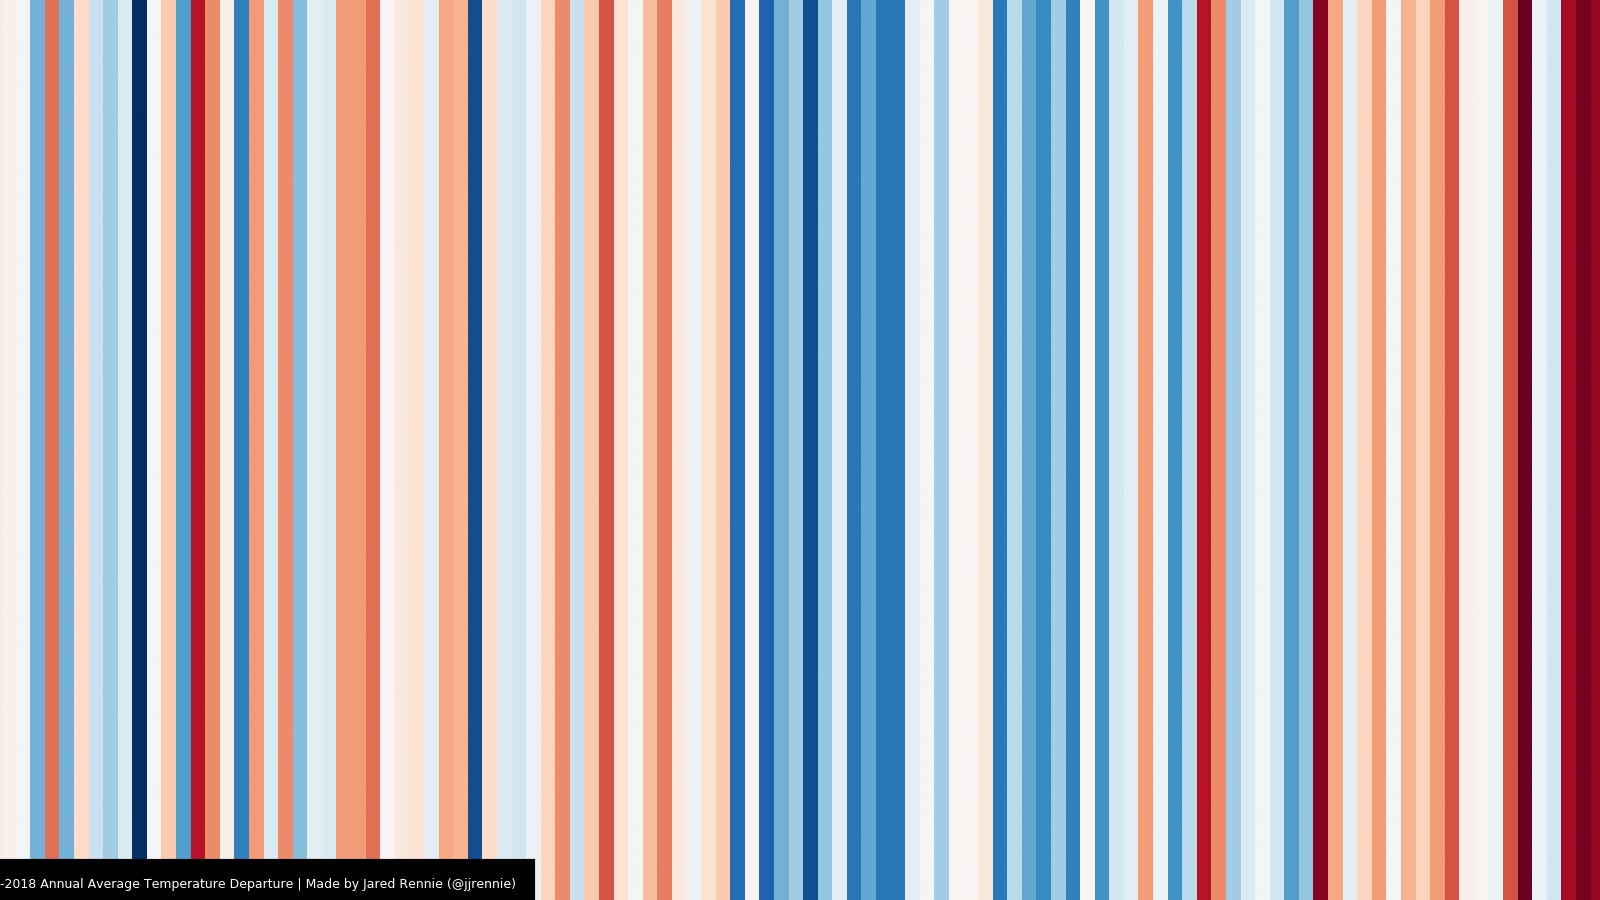
"Climate Stripes" for US Temperature and Precipitation by County
Inspired by climate scientist Ed Hawkins’ Show Your Stripes project, NCICS’s Jared Rennie has developed an online geographic information system (GIS) tool to generate “Warming…→
Jan 13, 2022
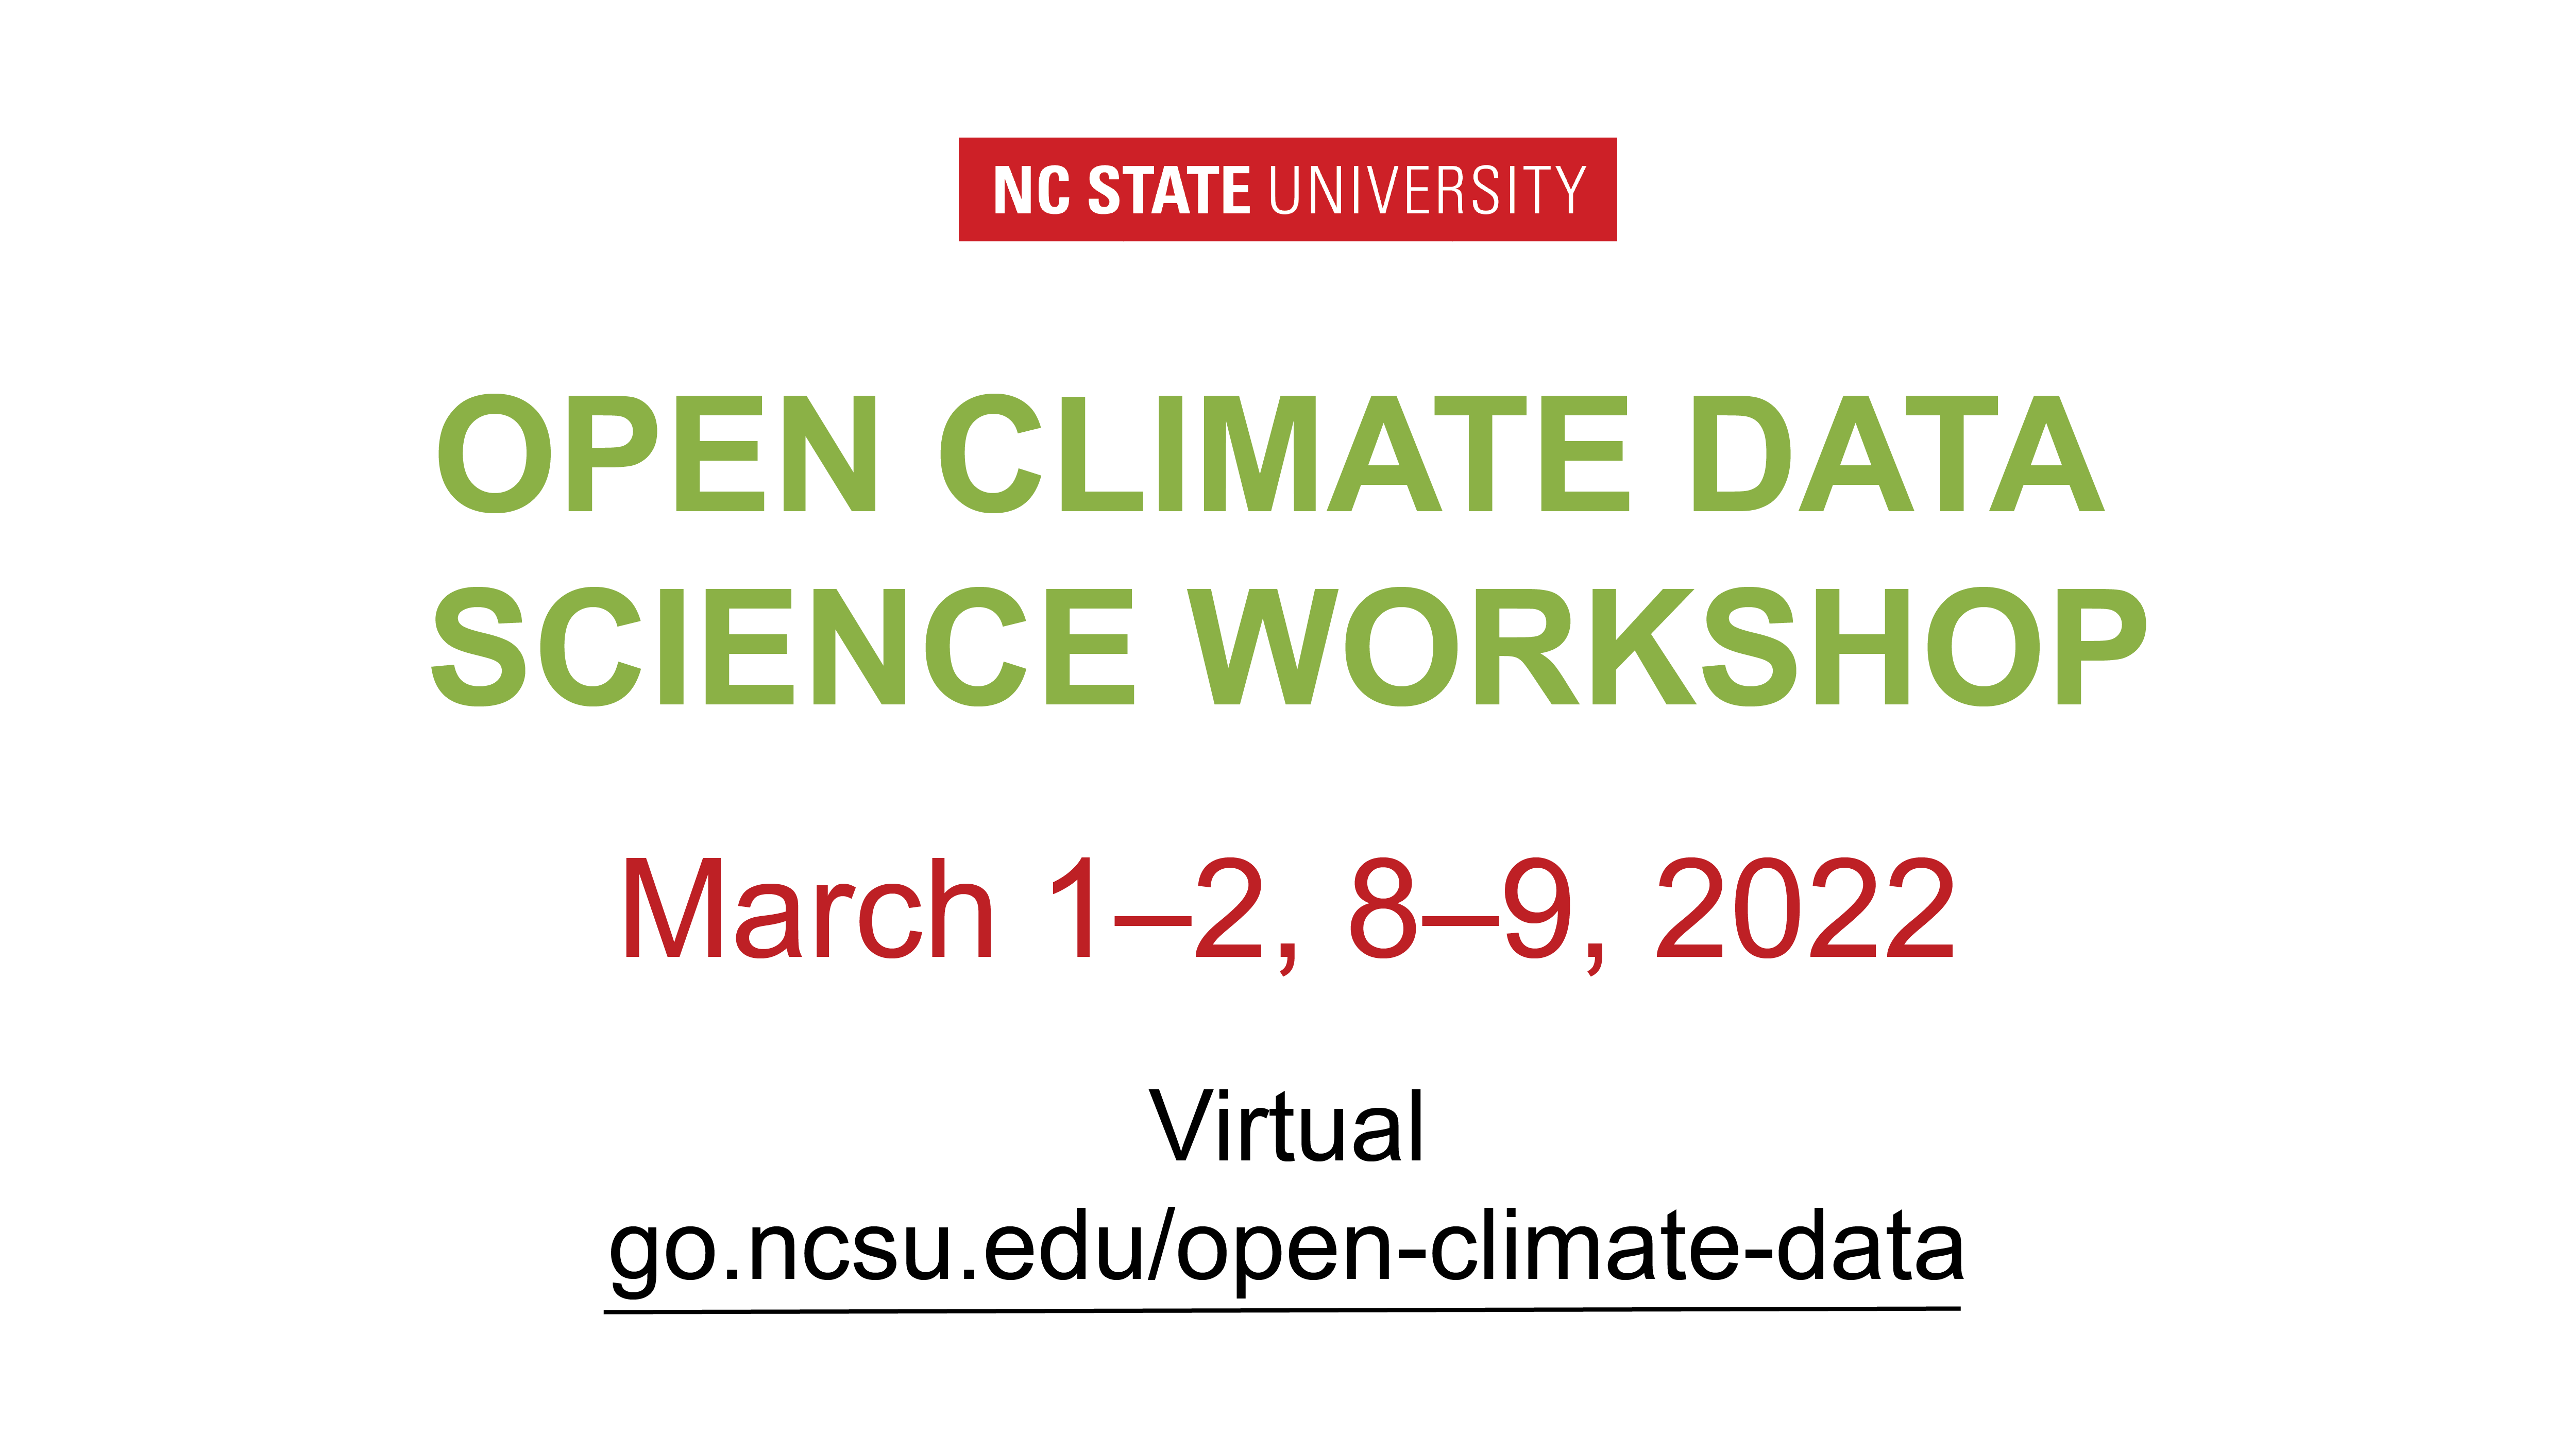
Open Climate Data Workshop 2022
Interested in using data to help address climate challenges in North Carolina? If so, please join us at the virtual Open Climate Data Science Workshop…→
Sep 1, 2016
A Catalyst for Change
WNC Magazine→